Home > Comparison > Technology > STX vs PSTG
The strategic rivalry between Seagate Technology Holdings plc and Pure Storage, Inc. shapes the trajectory of the computer hardware sector. Seagate operates as a capital-intensive giant, focusing on mass capacity storage products and legacy applications. Pure Storage emphasizes high-margin, software-driven flash storage solutions with a subscription model. This analysis weighs their contrasting operational models to identify which offers a superior risk-adjusted return for diversified portfolios amid evolving technology demands.
Table of contents
Companies Overview
Seagate Technology Holdings plc and Pure Storage, Inc. lead innovation in data storage with distinctive market approaches and scale.
Seagate Technology Holdings plc: Veteran Leader in Mass Capacity Storage
Seagate defines itself as a mass capacity storage provider focusing on hard disk and solid-state drives for enterprises and consumers. Its core revenue stems from selling HDDs, SSDs, and external storage solutions under established brands like LaCie. In 2026, Seagate sharpens its strategy around its Lyve edge-to-cloud platform, reinforcing its legacy in scalable physical storage infrastructure.
Pure Storage, Inc.: Pioneer in Flash Storage and Software
Pure Storage positions itself as a flash storage innovator delivering high-performance, software-driven data solutions for enterprise workloads. It generates revenue through sales of FlashArray and FlashBlade products, augmented by subscription services like evergreen storage and Pure as-a-Service. The company’s 2026 strategy prioritizes cloud-native data management and AI-ready infrastructure, signaling a shift toward hybrid and software-centric storage models.
Strategic Collision: Similarities & Divergences
Seagate and Pure Storage both compete in the data storage hardware sector but diverge in approach; Seagate emphasizes physical, high-capacity drives, while Pure champions all-flash, software-defined architectures. Their primary battleground is enterprise data infrastructure, balancing legacy mass storage against agile, cloud-integrated solutions. These contrasts shape distinct investment profiles: Seagate offers scale and stability, Pure targets innovation and growth potential.
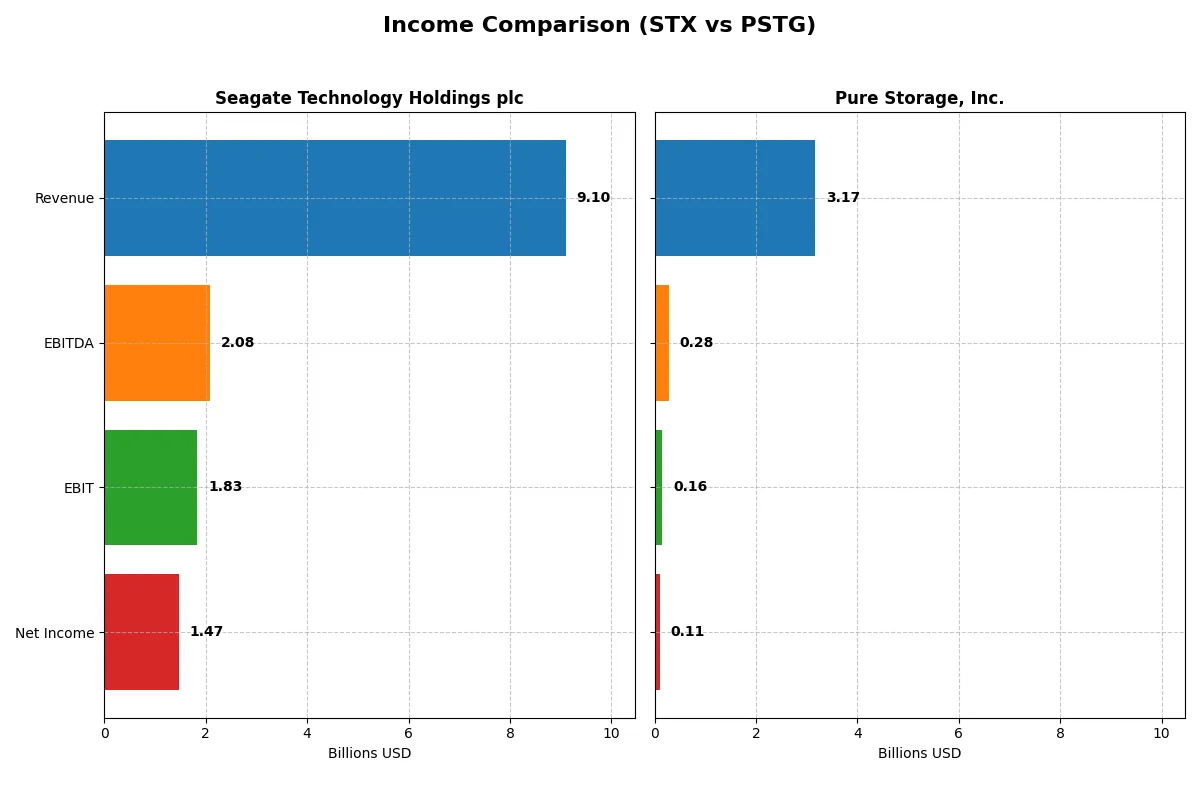
Income Statement Comparison
The following data dissects the core profitability and scalability of both corporate engines to reveal who dominates the bottom line:
| Metric | Seagate Technology Holdings plc (STX) | Pure Storage, Inc. (PSTG) |
|---|---|---|
| Revenue | 9.1B | 3.2B |
| Cost of Revenue | 5.9B | 955M |
| Operating Expenses | 1.31B | 2.13B |
| Gross Profit | 3.2B | 2.21B |
| EBITDA | 2.09B | 282M |
| EBIT | 1.83B | 156M |
| Interest Expense | 321M | 7.8M |
| Net Income | 1.47B | 107M |
| EPS | 6.93 | 0.33 |
| Fiscal Year | 2025 | 2025 |
Income Statement Analysis: The Bottom-Line Duel
This income statement comparison reveals which company runs a more efficient and profitable business engine through recent financial performance.
Seagate Technology Holdings plc Analysis
Seagate’s revenue dipped 15% over five years but surged nearly 39% from 2024 to 2025, reaching $9.1B. Net income rose steadily, hitting $1.47B in 2025 with a strong 16.15% net margin. The firm improved gross and EBIT margins above 35% and 20%, reflecting robust operational efficiency and margin expansion momentum.
Pure Storage, Inc. Analysis
Pure Storage grew revenue by 88% from 2021 to 2025, reaching $3.17B, with a one-year growth of nearly 12%. Net income increased 138% over five years but remains modest at $107M, with a 3.37% net margin. Gross margin of nearly 70% is impressive, though EBIT and net margins reflect ongoing investment and moderate profitability.
Margin Strength vs. Growth Scale
Seagate leads in profitability and margin quality, delivering strong net and EBIT margins alongside recent revenue acceleration. Pure Storage stands out for rapid revenue and net income growth but operates with thinner margins. Investors seeking stable, efficient earnings may prefer Seagate, while those favoring growth over margin strength might find Pure Storage’s profile more attractive.
Financial Ratios Comparison
These vital ratios act as a diagnostic tool to expose the underlying fiscal health, valuation premiums, and capital efficiency of the companies compared here:
| Ratios | Seagate Technology Holdings plc (STX) | Pure Storage, Inc. (PSTG) |
|---|---|---|
| ROE | -3.24% (2025) | 8.17% (2025) |
| ROIC | 33.76% (2025) | 2.45% (2025) |
| P/E | 20.4x (2025) | 207.0x (2025) |
| P/B | -66.2 (2025) | 16.9 (2025) |
| Current Ratio | 1.38 (2025) | 1.61 (2025) |
| Quick Ratio | 0.84 (2025) | 1.58 (2025) |
| D/E | -11.86 (2025) | 0.22 (2025) |
| Debt-to-Assets | 67.0% (2025) | 7.1% (2025) |
| Interest Coverage | 5.89x (2025) | 10.91x (2025) |
| Asset Turnover | 1.13 (2025) | 0.80 (2025) |
| Fixed Asset Turnover | 5.49 (2025) | 5.21 (2025) |
| Payout ratio | 40.8% (2025) | 0% (2025) |
| Dividend yield | 2.00% (2025) | 0% (2025) |
| Fiscal Year | 2025 | 2025 |
Efficiency & Valuation Duel: The Vital Signs
Ratios act as a company’s financial DNA, exposing hidden risks and highlighting operational excellence in clear, quantifiable terms.
Seagate Technology Holdings plc (STX)
Seagate posts a strong 16.15% net margin and a robust 33.76% ROIC, signaling operational efficiency. Its P/E ratio at 20.41 suggests a fairly valued stock. Despite a deeply negative ROE, Seagate supports shareholders with a 2% dividend yield, reflecting stable cash returns rather than aggressive growth reinvestment.
Pure Storage, Inc. (PSTG)
Pure Storage’s profitability lags with a 3.37% net margin and 2.45% ROIC, indicating operational challenges. Its P/E ratio at 207 marks the stock as highly expensive. The company retains earnings for growth, investing heavily in R&D at over 25% of revenue, but it pays no dividends, prioritizing future expansion over immediate shareholder returns.
Premium Valuation vs. Operational Safety
Seagate offers a balanced profile with solid profitability and a reasonable valuation, backed by shareholder dividends. Pure Storage trades at a steep premium despite weaker margins, relying on growth investments. Risk-averse investors may prefer Seagate’s stability, while growth seekers might tolerate Pure Storage’s stretched multiples.
Which one offers the Superior Shareholder Reward?
I observe Seagate Technology Holdings plc (STX) delivers steady dividends with a 2.0% yield and a manageable 41% payout ratio, supported by robust free cash flow coverage (1.25x). STX also executes consistent buybacks, enhancing total returns. In contrast, Pure Storage, Inc. (PSTG) pays no dividends, reinvesting heavily in R&D and growth, reflected by zero payout and high price multiples. PSTG’s buyback activity is minimal, implying lower direct shareholder distributions. Historically, STX’s balanced dividend and buyback strategy offers more sustainable, immediate shareholder rewards. I conclude STX presents a superior total return profile for 2026 investors seeking both income and capital appreciation.
Comparative Score Analysis: The Strategic Profile
The radar chart reveals the fundamental DNA and trade-offs of Seagate Technology Holdings plc and Pure Storage, Inc., highlighting their financial strengths and valuation nuances:
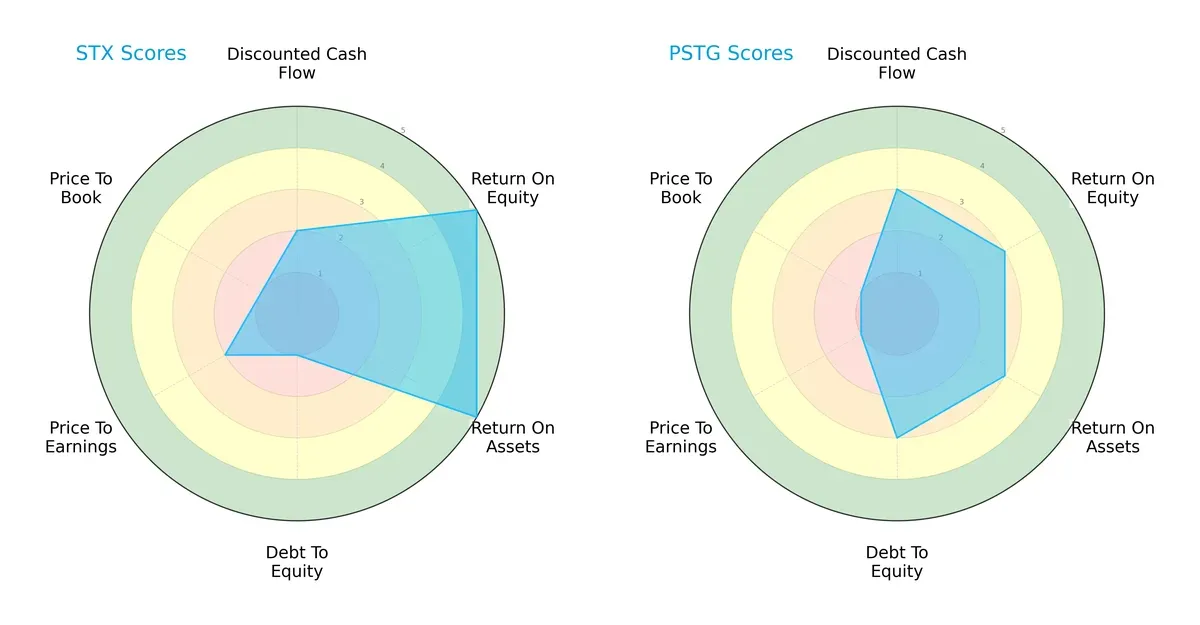
Seagate shows superior profitability with very favorable ROE and ROA scores (5 each), but it carries a significant leverage risk reflected in a very unfavorable debt-to-equity score (1). Pure Storage has a more balanced debt profile (score 3) but lags in profitability metrics (ROE and ROA at 3). Both firms face valuation challenges, scoring low on price-to-earnings and price-to-book ratios, indicating potential overvaluation or market skepticism. Seagate’s profile relies heavily on operational efficiency, whereas Pure Storage presents a moderate but less specialized stance.
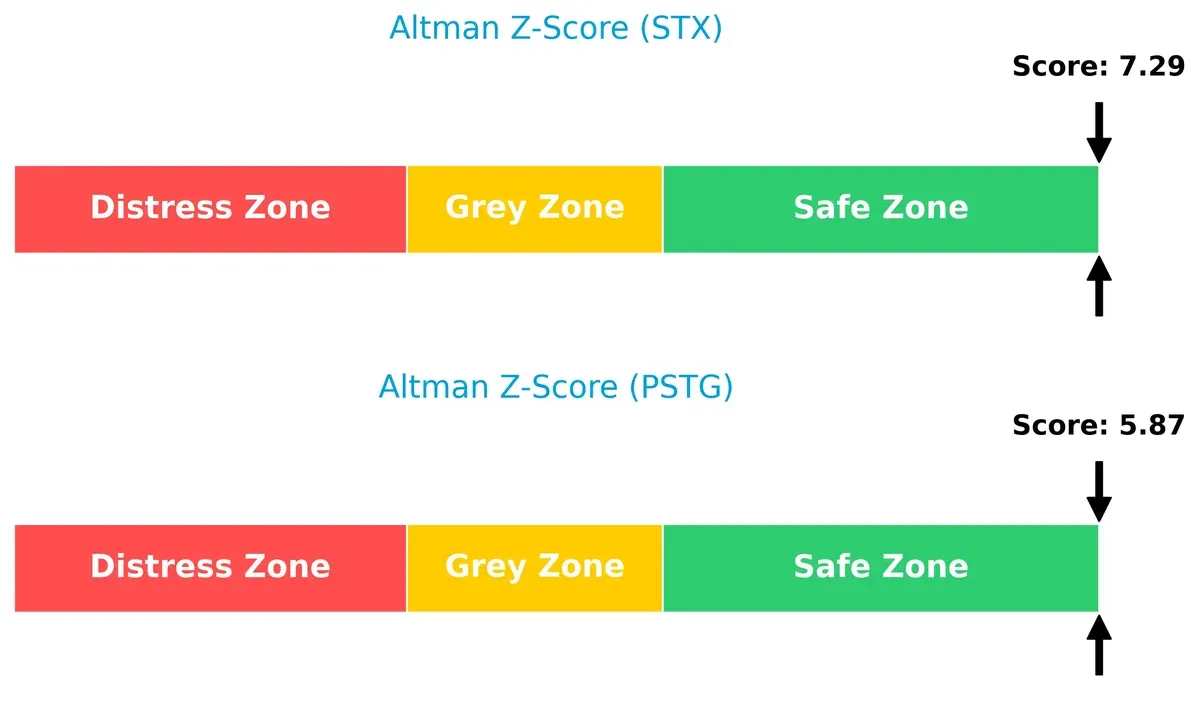
Bankruptcy Risk: Solvency Showdown
Seagate’s Altman Z-Score of 7.29 versus Pure Storage’s 5.87 signals both firms reside comfortably in the safe zone, with Seagate showing a stronger buffer against bankruptcy risk in this market cycle:
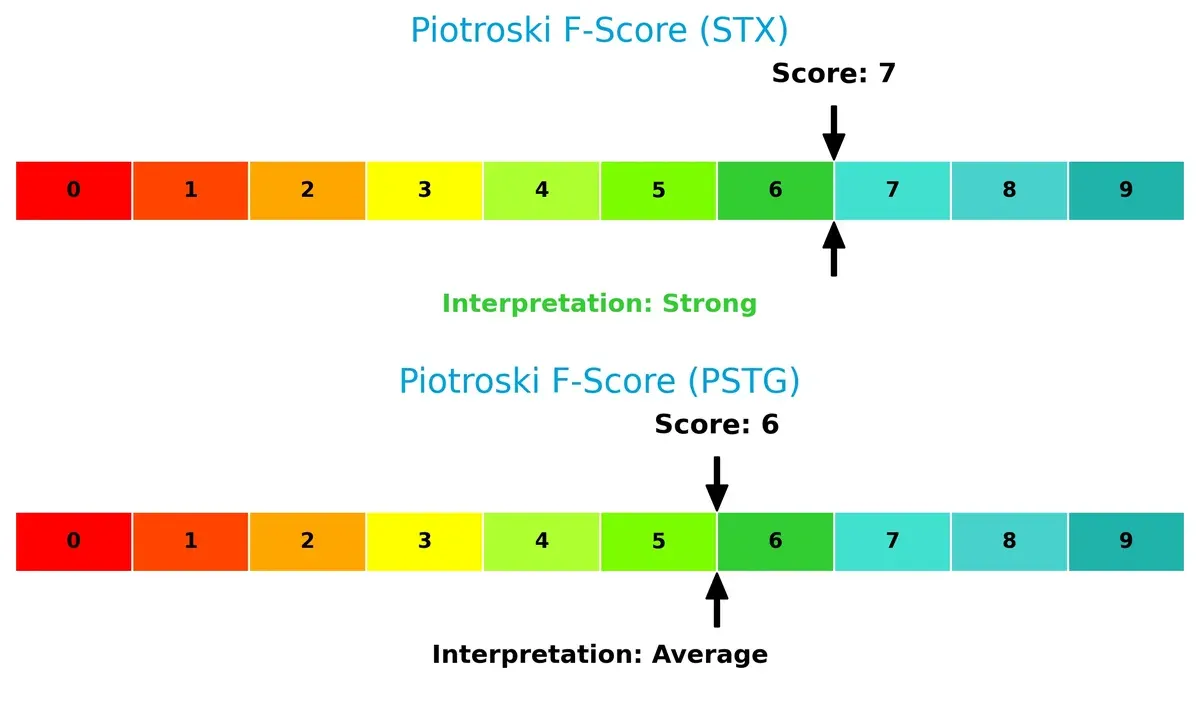
Financial Health: Quality of Operations
Seagate’s Piotroski F-Score of 7 suggests a robust financial condition, outperforming Pure Storage’s score of 6, which indicates a more average and potentially riskier operational quality:
How are the two companies positioned?
This section dissects STX and PSTG’s operational DNA by comparing their revenue distribution and internal strengths and weaknesses. The goal is to confront their economic moats and identify which model offers a more resilient, sustainable advantage today.
Revenue Segmentation: The Strategic Mix
The following visual comparison dissects how Seagate Technology Holdings plc and Pure Storage, Inc. diversify their income streams and where their primary sector bets lie:
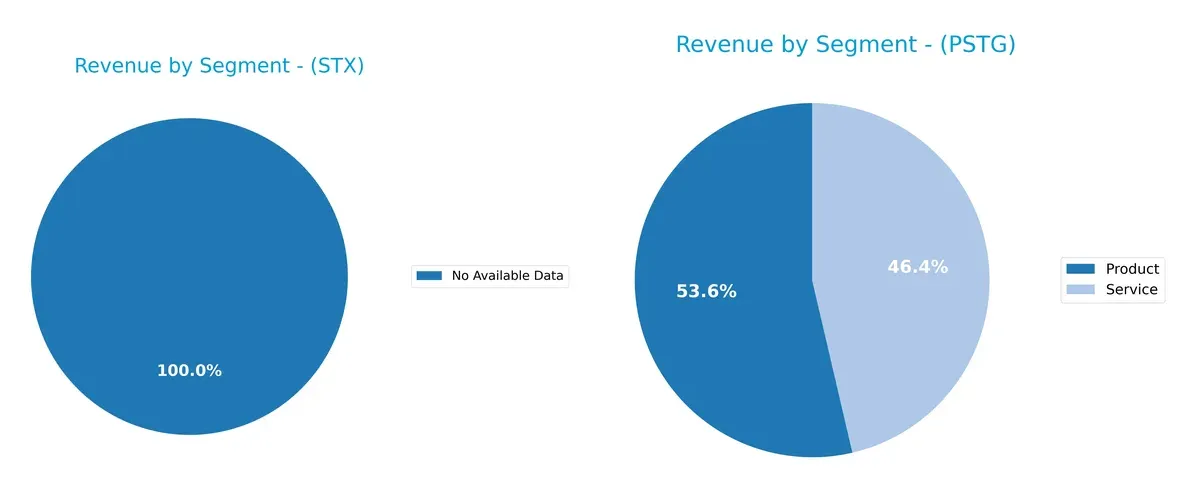
Pure Storage anchors its revenue in two nearly balanced streams: $1.7B from Products and $1.5B from Services in 2025. Seagate’s data is unavailable, preventing direct comparison. Pure Storage’s dual focus reduces concentration risk and fuels ecosystem lock-in, contrasting with many hardware peers relying heavily on product sales alone. This mix signals a strategic pivot to recurring service revenues, enhancing long-term stability and customer retention.
Strengths and Weaknesses Comparison
This table compares the strengths and weaknesses of Seagate Technology (STX) and Pure Storage (PSTG):
STX Strengths
- Strong net margin at 16.15%
- High ROIC at 33.76% surpasses WACC
- Favorable dividend yield of 2%
- Good interest coverage at 5.71x
- Global revenue diversity including US, Singapore, Netherlands
PSTG Strengths
- Higher current and quick ratios indicate strong liquidity
- Low debt-to-assets ratio at 7.09%
- Strong interest coverage at 19.92x
- Favorable fixed asset turnover at 5.21
- Balanced product and service revenue streams
STX Weaknesses
- Negative ROE at -324.28% signals shareholder returns issues
- High debt-to-assets at 66.97% increases financial risk
- WACC above ROIC
- Negative price-to-book ratio indicates valuation concerns
- Quick ratio below 1 suggests liquidity constraints
PSTG Weaknesses
- Low net margin at 3.37% limits profitability
- ROIC of 2.45% barely covers WACC of 9.76%
- High PE of 207 implies overvaluation risk
- No dividend yield reduces income appeal
- Moderate asset turnover at 0.8 limits efficiency
Seagate shows operational profitability and strong capital returns but carries significant leverage risk. Pure Storage maintains better liquidity and lower debt but struggles with profitability and valuation concerns. These factors critically impact each company’s financial resilience and strategic flexibility.
The Moat Duel: Analyzing Competitive Defensibility
A structural moat is the only shield protecting long-term profits from relentless competition and market disruption. Here’s how Seagate and Pure Storage compare:
Seagate Technology Holdings plc: Cost Advantage & Scale Moat
Seagate’s moat stems from its cost leadership in mass capacity storage, reflected in a strong 20% EBIT margin and 16% net margin in 2025. Its growing ROIC, 22.5% above WACC, signals efficient capital use. Expansion into edge-to-cloud storage platforms in 2026 could deepen this moat further.
Pure Storage, Inc.: Innovation & Software Ecosystem Moat
Pure Storage relies on its proprietary Purity software and subscription model, creating switching costs unlike Seagate’s hardware focus. Despite a slimmer 4.9% EBIT margin and ROIC below WACC, its rapidly improving profitability and 120% ROIC growth trend highlight rising competitive strength. Market expansion with AI-ready infrastructure may fuel future moat gains.
Cost Leadership vs. Software Ecosystem: Who Commands the Moat?
Seagate wields a wider moat with consistent value creation and strong margin stability. Pure Storage shows a promising moat trajectory but currently trails in capital efficiency. Seagate remains better positioned to defend its market share against competitive pressures in 2026.
Which stock offers better returns?
Both stocks exhibit distinct price movements over the past year, with Seagate showing strong acceleration and Pure Storage facing recent deceleration in trading dynamics.
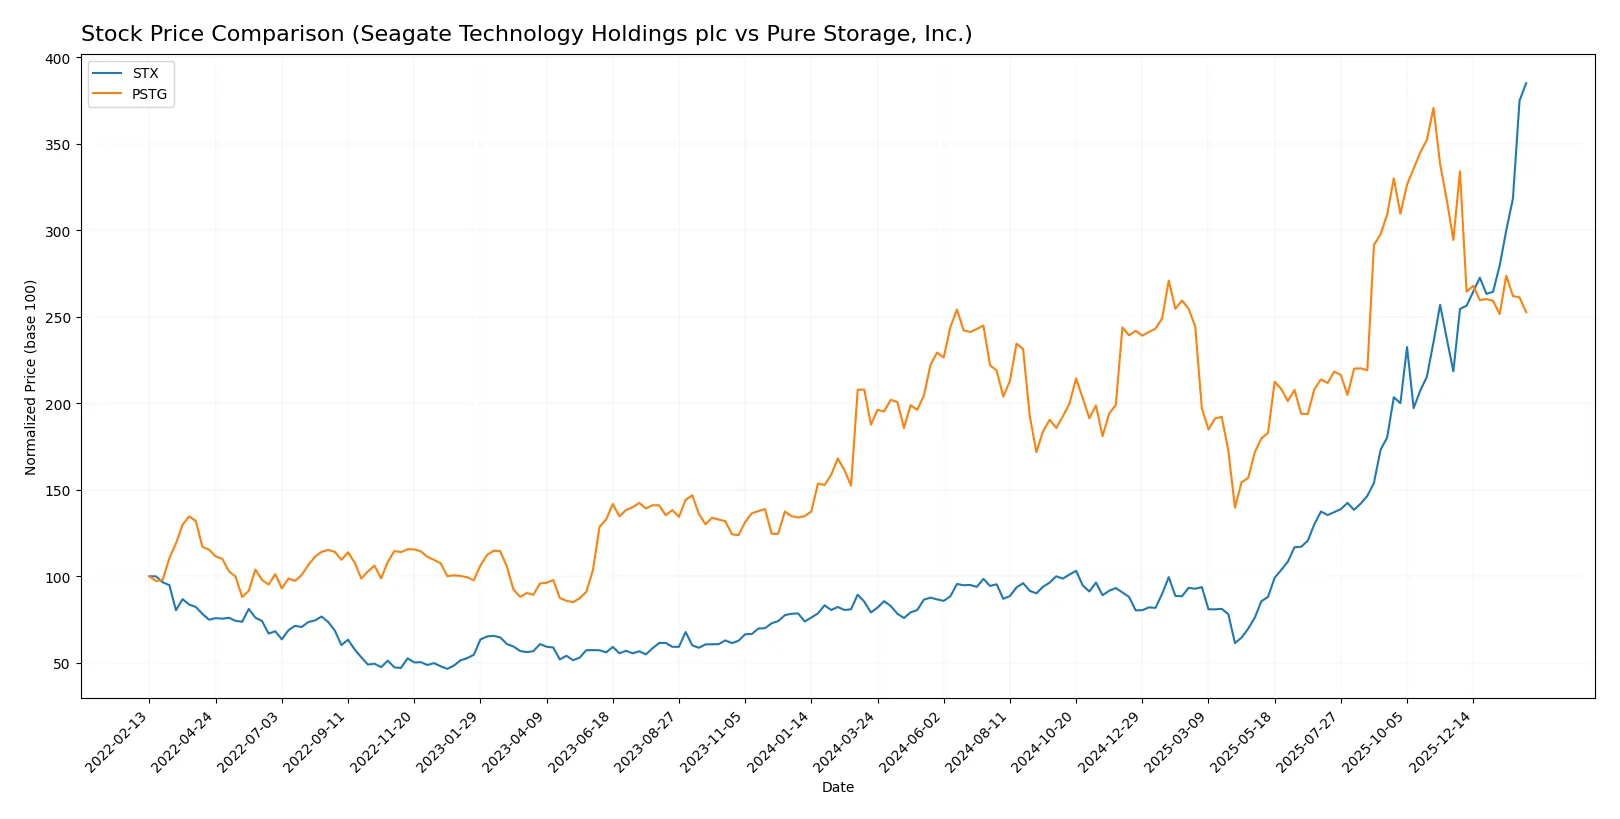
Trend Comparison
Seagate Technology’s stock rose 386.72% over the past 12 months, marking a bullish trend with accelerating momentum and a high volatility of 78.67. It hit a low of 66.73 and peaked at 418.63.
Pure Storage’s stock gained 34.65% over the same period, also bullish but with decelerating momentum. Volatility was lower at 12.68, with prices ranging from 37.18 to 98.7.
Seagate outperformed Pure Storage substantially, delivering the highest market return with strong acceleration, while Pure Storage showed weaker gains and recent negative price movement.
Target Prices
Analysts show a clear target price consensus for Seagate Technology and Pure Storage, reflecting moderate upside potential.
| Company | Target Low | Target High | Consensus |
|---|---|---|---|
| Seagate Technology Holdings plc | 270 | 505 | 407.2 |
| Pure Storage, Inc. | 60 | 105 | 91.15 |
Seagate’s consensus target sits slightly below its current price of 419, indicating cautious optimism. Pure Storage’s consensus of 91.15 suggests significant upside from its 67.24 price, reflecting growth expectations.

Don’t Let Luck Decide Your Entry Point
Optimize your entry points with our advanced ProRealTime indicators. You’ll get efficient buy signals with precise price targets for maximum performance. Start outperforming now!
How do institutions grade them?
The following tables summarize the latest grades assigned by financial institutions for each company:
Seagate Technology Holdings plc Grades
This table shows recent grades from reputable financial firms for Seagate Technology:
| Grading Company | Action | New Grade | Date |
|---|---|---|---|
| Cantor Fitzgerald | Maintain | Overweight | 2026-02-04 |
| Citigroup | Maintain | Buy | 2026-01-29 |
| Baird | Maintain | Outperform | 2026-01-29 |
| Rosenblatt | Maintain | Buy | 2026-01-28 |
| UBS | Maintain | Neutral | 2026-01-28 |
| Barclays | Maintain | Equal Weight | 2026-01-28 |
| Mizuho | Maintain | Outperform | 2026-01-28 |
| Goldman Sachs | Maintain | Buy | 2026-01-28 |
| Wells Fargo | Maintain | Equal Weight | 2026-01-28 |
| Cantor Fitzgerald | Maintain | Overweight | 2026-01-28 |
Pure Storage, Inc. Grades
This table presents recent grades from established financial institutions for Pure Storage:
| Grading Company | Action | New Grade | Date |
|---|---|---|---|
| Barclays | Maintain | Equal Weight | 2025-12-03 |
| Needham | Maintain | Buy | 2025-12-03 |
| Wedbush | Maintain | Outperform | 2025-12-03 |
| Susquehanna | Downgrade | Neutral | 2025-12-03 |
| UBS | Maintain | Sell | 2025-12-03 |
| Citigroup | Maintain | Buy | 2025-12-03 |
| JP Morgan | Maintain | Overweight | 2025-12-03 |
| Lake Street | Maintain | Buy | 2025-12-03 |
| JP Morgan | Maintain | Overweight | 2025-11-17 |
| Morgan Stanley | Maintain | Equal Weight | 2025-11-17 |
Which company has the best grades?
Seagate Technology consistently receives Buy and Outperform ratings from top firms, reflecting stronger institutional confidence. Pure Storage has a mixed profile, including Sell and Neutral grades, indicating higher uncertainty for investors.
Risks specific to each company
The following categories identify the critical pressure points and systemic threats facing both firms in the 2026 market environment:
1. Market & Competition
Seagate Technology Holdings plc (STX)
- Faces intense competition in legacy HDD and SSD markets with pressure from cloud and flash storage providers.
Pure Storage, Inc. (PSTG)
- Competes in a high-growth flash storage market but faces fierce rivalry from established tech giants and emerging startups.
2. Capital Structure & Debt
Seagate Technology Holdings plc (STX)
- High debt-to-assets ratio at 67%, indicating leveraged balance sheet risks despite favorable interest coverage.
Pure Storage, Inc. (PSTG)
- Low debt-to-assets at 7%, reflecting conservative leverage and strong liquidity positions.
3. Stock Volatility
Seagate Technology Holdings plc (STX)
- Beta of 1.635 signals higher volatility than the tech sector average, exposing investors to wider price swings.
Pure Storage, Inc. (PSTG)
- Lower beta at 1.273 suggests moderate volatility but still above market average, reflecting tech sector dynamics.
4. Regulatory & Legal
Seagate Technology Holdings plc (STX)
- Subject to international trade regulations and data storage compliance risks across multiple jurisdictions.
Pure Storage, Inc. (PSTG)
- Faces regulatory scrutiny primarily in the US, with potential exposure to data privacy laws impacting software services.
5. Supply Chain & Operations
Seagate Technology Holdings plc (STX)
- Relies on complex global supply chains vulnerable to geopolitical disruptions and component shortages.
Pure Storage, Inc. (PSTG)
- Operates a more software-centric model, reducing hardware supply chain risks but dependent on third-party manufacturers.
6. ESG & Climate Transition
Seagate Technology Holdings plc (STX)
- Faces pressure to reduce carbon footprint in manufacturing and electronic waste management.
Pure Storage, Inc. (PSTG)
- ESG risks focus on energy efficiency of data centers and sustainable software development practices.
7. Geopolitical Exposure
Seagate Technology Holdings plc (STX)
- Significant international operations expose it to trade tensions, tariffs, and currency fluctuations.
Pure Storage, Inc. (PSTG)
- Primarily US-based but with growing international sales, moderately exposed to geopolitical risks.
Which company shows a better risk-adjusted profile?
Seagate’s most impactful risk is its elevated leverage and exposure to volatile global supply chains. Pure Storage’s key risk lies in its high valuation multiples and competitive pressure in a fast-evolving market. I see Pure Storage offering a better risk-adjusted profile due to its stronger balance sheet and lower debt, despite thinner margins. The stark debt-to-assets contrast (67% vs. 7%) underlines my caution toward Seagate’s financial risk amid uncertain market cycles.
Final Verdict: Which stock to choose?
Seagate Technology Holdings plc (STX) stands out for its robust capital efficiency and value creation, as evidenced by its impressive ROIC well above cost of capital. This company’s ability to generate strong free cash flow despite a challenging debt profile is its superpower. A point of vigilance remains its high leverage, which could pressure financial flexibility. STX fits well in portfolios targeting aggressive growth with a tolerance for cyclical risks.
Pure Storage, Inc. (PSTG) leverages a strategic moat rooted in its innovative data storage solutions and recurring revenue model. Its solid balance sheet and superior liquidity metrics provide a safety cushion compared to STX. However, slower profitability and high valuation multiples temper upside potential. PSTG could suit investors seeking GARP (Growth at a Reasonable Price) exposure with an emphasis on stability and innovation.
If you prioritize sustainable value creation and can absorb leverage-driven volatility, Seagate outshines due to its proven ability to generate economic profits. However, if you seek better financial stability and a less cyclical growth profile, Pure Storage offers superior balance sheet strength and recurring revenue advantages, despite commanding a premium valuation. Both present compelling but distinct analytical scenarios aligned to different investor profiles.
Disclaimer: Investment carries a risk of loss of initial capital. The past performance is not a reliable indicator of future results. Be sure to understand risks before making an investment decision.
Go Further
I encourage you to read the complete analyses of Seagate Technology Holdings plc and Pure Storage, Inc. to enhance your investment decisions: