In the evolving landscape of regulated electric utilities, Xcel Energy Inc. (XEL) and Public Service Enterprise Group Incorporated (PEG) stand out as key players. Both companies serve millions of customers across different U.S. regions and emphasize innovation in renewable energy and infrastructure. By comparing their market positions, operational strategies, and growth potential, I aim to help you identify which utility stock could be the smarter addition to your investment portfolio.
Table of contents
Companies Overview
I will begin the comparison between Xcel Energy Inc. and Public Service Enterprise Group Incorporated by providing an overview of these two companies and their main differences.
Xcel Energy Inc. Overview
Xcel Energy Inc. operates in the regulated electric utility sector, generating and distributing electricity and natural gas primarily in the central United States. The company uses diverse energy sources, including coal, nuclear, natural gas, hydroelectric, solar, biomass, oil, wood/refuse, and wind. It serves approximately 3.7M electricity and 2.1M natural gas customers in eight states and has a market capitalization of about 44B USD.
Public Service Enterprise Group Incorporated Overview
Public Service Enterprise Group Incorporated functions mainly in the Northeastern and Mid-Atlantic US, providing electricity and gas distribution through its PSE&G and PSEG Power segments. It invests in solar projects and energy efficiency programs, managing extensive electric and gas infrastructure. The company employs over 13K people and holds a market cap near 39B USD, focusing on regulated energy services to residential, commercial, and industrial customers.
Key similarities and differences
Both companies are major players in the regulated electric utility industry, serving residential and commercial customers with electricity and natural gas. Xcel Energy has a broader geographic reach across multiple central states, while Public Service Enterprise Group concentrates on the Northeast and Mid-Atlantic regions. Additionally, Xcel has a wider mix of generation sources, whereas Public Service Enterprise Group emphasizes infrastructure scale and energy efficiency initiatives. Their market caps and employee counts are comparable, reflecting similar operational sizes.
Income Statement Comparison
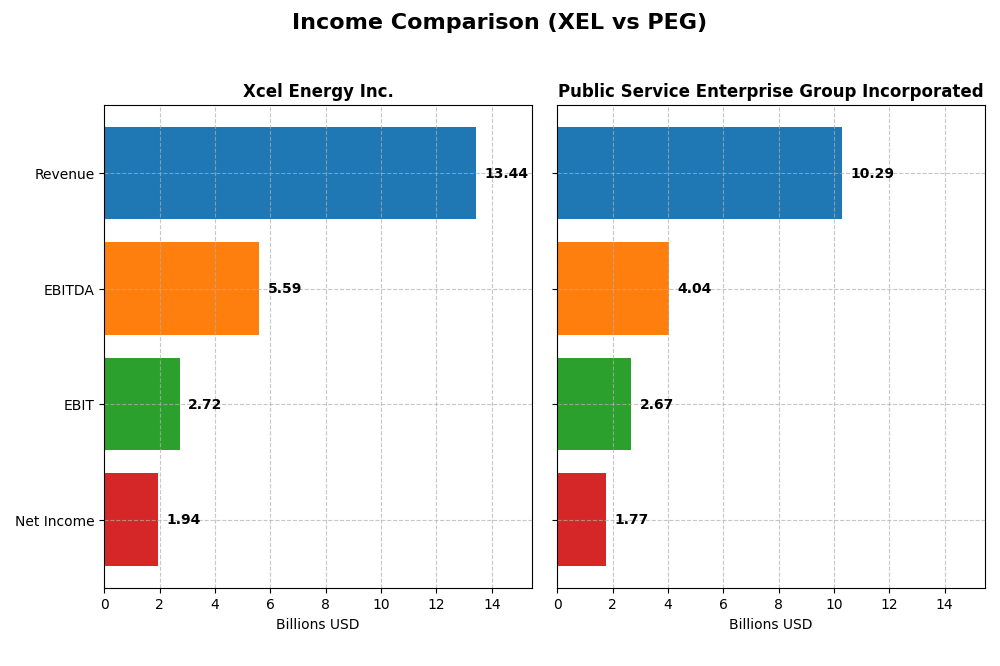
Below is a side-by-side comparison of key income statement metrics for Xcel Energy Inc. and Public Service Enterprise Group Incorporated for fiscal year 2024.
| Metric | Xcel Energy Inc. (XEL) | Public Service Enterprise Group (PEG) |
|---|---|---|
| Market Cap | 43.9B | 39.3B |
| Revenue | 13.44B | 10.29B |
| EBITDA | 5.59B | 4.04B |
| EBIT | 2.72B | 2.67B |
| Net Income | 1.94B | 1.77B |
| EPS | 3.44 | 3.56 |
| Fiscal Year | 2024 | 2024 |
Income Statement Interpretations
Xcel Energy Inc.
Xcel Energy Inc. showed a favorable growth trend in revenue and net income from 2020 to 2024, with revenue increasing by 16.61% overall and net income by 31.43%. Margins improved steadily, particularly net margin growth of 12.71%. In 2024, revenue declined by 5.39%, but net margin and EPS grew favorably, indicating improved profitability despite lower sales.
Public Service Enterprise Group Incorporated
Public Service Enterprise Group experienced mixed results, with revenue growing modestly by 7.15% over the period but net income declining by 6.98%. Margins deteriorated, with a notable 24.5% decrease in net margin in 2024 and negative EPS growth of 30.99%. The latest year showed a sharp contraction in profitability metrics alongside an 8.43% revenue decline.
Which one has the stronger fundamentals?
Xcel Energy demonstrates stronger fundamentals with predominantly favorable evaluations in revenue growth, margin improvements, and profitability expansion over the period. Public Service Enterprise Group shows unfavorable trends in profitability and margin performance, especially in the latest year. Overall, Xcel Energy’s income statement exhibits greater stability and positive momentum compared to Public Service Enterprise Group.
Financial Ratios Comparison
The table below presents a side-by-side comparison of key financial ratios for Xcel Energy Inc. and Public Service Enterprise Group Incorporated for the fiscal year ending 2024.
| Ratios | Xcel Energy Inc. (XEL) | Public Service Enterprise Group Inc. (PEG) |
|---|---|---|
| ROE | 9.92% | 10.99% |
| ROIC | 4.59% | 4.40% |
| P/E | 19.64 | 23.74 |
| P/B | 1.95 | 2.61 |
| Current Ratio | 0.67 | 0.65 |
| Quick Ratio | 0.57 | 0.48 |
| D/E (Debt-to-Equity) | 1.55 | 1.42 |
| Debt-to-Assets | 43.13% | 41.89% |
| Interest Coverage | 2.02 | 2.80 |
| Asset Turnover | 0.19 | 0.19 |
| Fixed Asset Turnover | 0.23 | 0.26 |
| Payout Ratio | 60.7% | 67.5% |
| Dividend Yield | 3.09% | 2.84% |
Interpretation of the Ratios
Xcel Energy Inc.
Xcel Energy shows a mixed ratio profile with a strong net margin of 14.4% but weaker returns on equity (9.92%) and invested capital (4.59%), both flagged as unfavorable. Liquidity ratios are below 1, indicating potential short-term solvency concerns. Its dividend yield is favorable at 3.09%, supported by payouts and shareholder returns, though debt levels and asset turnover remain cautionary.
Public Service Enterprise Group Incorporated
Public Service Enterprise Group has a higher net margin of 17.22%, with a neutral return on equity of 11.0%, but an unfavorable return on invested capital at 4.4%. Liquidity ratios are similarly low, reflecting tight current assets versus liabilities. The dividend yield is slightly lower at 2.84%, with stable shareholder returns, while leverage and asset efficiency ratios suggest moderate financial pressure.
Which one has the best ratios?
Both companies have a slightly unfavorable overall ratio assessment due to weaknesses in liquidity and asset turnover. Xcel Energy and Public Service Enterprise Group share a similar proportion of favorable ratios, but PEG’s higher net margin and neutral ROE slightly edge it ahead, despite both facing challenges in debt management and operational efficiency.
Strategic Positioning
This section compares the strategic positioning of Xcel Energy Inc. and Public Service Enterprise Group Incorporated, covering Market position, Key segments, and Exposure to technological disruption:
Xcel Energy Inc.
- Strong regulated electric utility with moderate beta, facing typical utility sector competition.
- Key drivers include regulated electric and natural gas utilities serving 3.7M electricity and 2.1M gas customers.
- Operates diverse energy sources including coal, nuclear, wind, solar, biomass, and hydro with renewable investments.
Public Service Enterprise Group Incorporated
- Leading regulated electric utility in Northeast and Mid-Atlantic with slightly higher beta and competitive pressure.
- Revenue driven by electric and gas distribution, transmission, and solar investment across multiple segments.
- Invests in solar generation and energy efficiency programs, balancing traditional and renewable energy exposure.
Xcel Energy Inc. vs Public Service Enterprise Group Incorporated Positioning
Xcel Energy has a diversified energy portfolio including multiple renewable sources, while Public Service Enterprise Group focuses on regulated electric and gas with solar investments. Both rely on regulated utilities but differ in geographic and segment concentration, affecting risk profiles.
Which has the best competitive advantage?
Both companies demonstrate slightly unfavorable MOAT status, shedding value yet showing growing ROIC trends, indicating improving profitability but currently limited competitive advantage based on return on invested capital versus cost of capital.
Stock Comparison
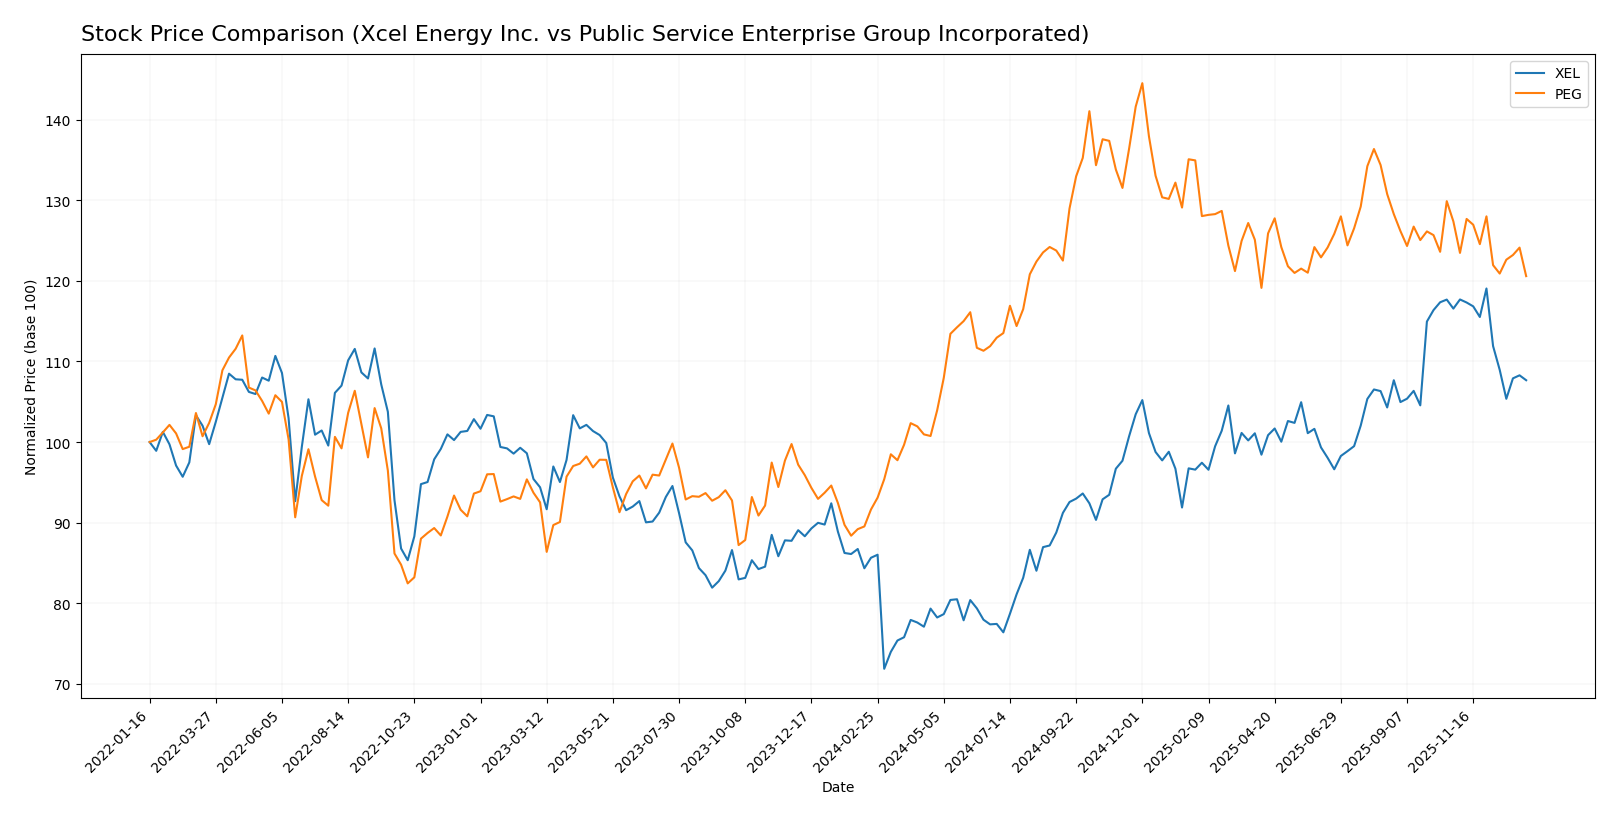
The stock prices of Xcel Energy Inc. (XEL) and Public Service Enterprise Group Incorporated (PEG) have shown significant bullish trends over the past 12 months, with recent declines indicating a shift in short-term trading dynamics.
Trend Analysis
Xcel Energy Inc. (XEL) experienced a 25.72% price increase over the past year, indicating a bullish trend with deceleration. The stock hit a high of 82.11 and a low of 49.57, showing moderate volatility with an 8.44 standard deviation.
Public Service Enterprise Group Incorporated (PEG) showed a 31.59% price rise over the same period, also bullish with deceleration. PEG’s high was 94.3 and low 59.79, with a slightly lower volatility at 7.17 standard deviation.
Comparing the two, PEG delivered higher market performance with a 31.59% gain versus XEL’s 25.72%, despite both showing recent short-term declines and seller dominance in trading volume.
Target Prices
The current analyst consensus indicates moderate upside potential for these utility companies.
| Company | Target High | Target Low | Consensus |
|---|---|---|---|
| Xcel Energy Inc. | 96 | 81 | 87 |
| Public Service Enterprise Group Incorporated | 98 | 83 | 89 |
Analysts expect Xcel Energy’s price to rise from $74.26 to around $87, while Public Service Enterprise Group’s stock could increase from $78.68 to approximately $89. Both show potential gains near 15%.
Analyst Opinions Comparison
This section compares analysts’ ratings and financial scores for Xcel Energy Inc. (XEL) and Public Service Enterprise Group Incorporated (PEG):
Rating Comparison
XEL Rating
- Rating: C+, considered very favorable overall.
- Discounted Cash Flow Score: 4, favorable, indicating good cash flow outlook.
- ROE Score: 3, moderate efficiency in generating profit from equity.
- ROA Score: 2, moderate asset utilization efficiency.
- Debt To Equity Score: 1, very unfavorable, high financial risk.
- Overall Score: 2, moderate financial standing.
PEG Rating
- Rating: B-, considered very favorable overall.
- Discounted Cash Flow Score: 1, very unfavorable, suggesting weak cash flow.
- ROE Score: 4, favorable, showing strong profit generation from equity.
- ROA Score: 4, favorable, indicating effective asset use.
- Debt To Equity Score: 2, moderate financial risk.
- Overall Score: 3, moderate financial standing.
Which one is the best rated?
PEG holds a higher overall rating (B-) and better scores in ROE and ROA, indicating stronger profitability and asset management. Conversely, XEL shows a stronger discounted cash flow score but weaker debt management, leading to a mixed comparative outlook based on available data.
Scores Comparison
Here is a comparison of the financial scores for Xcel Energy Inc. and Public Service Enterprise Group Incorporated:
XEL Scores
- Altman Z-Score: 0.89, indicating financial distress and high bankruptcy risk.
- Piotroski Score: 5, reflecting average financial strength.
PEG Scores
- Altman Z-Score: 1.32, also in distress zone but slightly higher than XEL.
- Piotroski Score: 7, showing strong financial health and value potential.
Which company has the best scores?
Based on the provided data, PEG has a higher Piotroski Score (7 vs. 5) and a slightly better Altman Z-Score (1.32 vs. 0.89), indicating relatively stronger financial health compared to XEL.
Grades Comparison
Here is the comparison of recent grades assigned to Xcel Energy Inc. and Public Service Enterprise Group Incorporated:
Xcel Energy Inc. Grades
The table below shows the latest grades from reputable financial institutions for Xcel Energy Inc.:
| Grading Company | Action | New Grade | Date |
|---|---|---|---|
| UBS | Maintain | Neutral | 2025-12-17 |
| Keybanc | Maintain | Overweight | 2025-12-12 |
| JP Morgan | Maintain | Overweight | 2025-12-11 |
| Barclays | Maintain | Overweight | 2025-11-05 |
| Citigroup | Maintain | Buy | 2025-11-03 |
| UBS | Maintain | Neutral | 2025-10-31 |
| Mizuho | Maintain | Outperform | 2025-10-27 |
| Jefferies | Maintain | Buy | 2025-10-16 |
| Keybanc | Maintain | Overweight | 2025-10-15 |
| BMO Capital | Maintain | Outperform | 2025-10-15 |
The grades for Xcel Energy Inc. show a stable pattern with predominantly positive ratings, including Overweight, Buy, and Outperform recommendations.
Public Service Enterprise Group Incorporated Grades
Below is a summary of recent grades from verified grading companies for Public Service Enterprise Group Incorporated:
| Grading Company | Action | New Grade | Date |
|---|---|---|---|
| Ladenburg Thalmann | Upgrade | Buy | 2026-01-07 |
| UBS | Maintain | Buy | 2025-12-17 |
| JP Morgan | Maintain | Overweight | 2025-12-12 |
| Jefferies | Upgrade | Buy | 2025-11-06 |
| TD Cowen | Maintain | Buy | 2025-11-05 |
| BMO Capital | Maintain | Market Perform | 2025-11-04 |
| Barclays | Maintain | Equal Weight | 2025-10-21 |
| BMO Capital | Maintain | Market Perform | 2025-10-20 |
| Morgan Stanley | Maintain | Overweight | 2025-09-25 |
| BMO Capital | Maintain | Market Perform | 2025-08-06 |
The consensus for Public Service Enterprise Group Incorporated is mostly Buy ratings, with some Market Perform and Equal Weight grades, indicating moderate positive sentiment.
Which company has the best grades?
Both companies hold a consensus Buy rating; however, Xcel Energy Inc. has a higher concentration of Overweight and Outperform grades, while Public Service Enterprise Group shows more Market Perform ratings. This suggests Xcel Energy may have stronger analyst conviction, potentially affecting investor confidence and portfolio positioning.
Strengths and Weaknesses
Below is a comparison of key strengths and weaknesses for Xcel Energy Inc. (XEL) and Public Service Enterprise Group Incorporated (PEG) based on recent financial and operational data.
| Criterion | Xcel Energy Inc. (XEL) | Public Service Enterprise Group (PEG) |
|---|---|---|
| Diversification | Focused on regulated electric (22.3B) and natural gas (4.5B); limited segments | More diversified with electric, gas distribution, transmission, and contracts |
| Profitability | Net margin 14.4% (favorable); ROIC 4.59% (unfavorable, below WACC 5.1%) | Net margin 17.2% (favorable); ROIC 4.4% (unfavorable, below WACC 5.37%) |
| Innovation | Moderate, with growing ROIC trend but overall value destruction | Similar to XEL, growing ROIC trend but still value shedding |
| Global presence | Primarily US-regulated markets, limited global footprint | Primarily US-regulated markets, limited global footprint |
| Market Share | Strong in regulated electric utility segment | Strong in electric and gas distribution markets |
In summary, both companies operate mainly in regulated US utility markets with solid profitability but face challenges in efficiently generating returns above their cost of capital. PEG shows greater diversification across energy segments, while XEL benefits from a higher net margin. Both have improving profitability trends but still present slight value destruction, suggesting cautious consideration for investors.
Risk Analysis
Below is a summary table of key risks for Xcel Energy Inc. (XEL) and Public Service Enterprise Group Incorporated (PEG) based on their latest 2024 financial and operational data:
| Metric | Xcel Energy Inc. (XEL) | Public Service Enterprise Group (PEG) |
|---|---|---|
| Market Risk | Moderate, beta 0.47 implies lower volatility | Moderate, beta 0.61 suggests moderate volatility |
| Debt Level | High, Debt-to-Equity 1.55, interest coverage moderate (2.3) | High, Debt-to-Equity 1.42, interest coverage moderate (3.17) |
| Regulatory Risk | Significant, regulated utility in multiple states | Significant, heavy regulation in Northeast/Mid-Atlantic |
| Operational Risk | Moderate, diverse energy sources but low asset turnover (0.19) | Moderate, large infrastructure with some efficiency concerns |
| Environmental Risk | Elevated, coal and natural gas reliance alongside renewables | Elevated, balancing fossil fuel and solar investments |
| Geopolitical Risk | Low to moderate, mainly US regional exposure | Low to moderate, mostly US regional exposure |
The most impactful risks are the high debt levels for both companies, which constrain financial flexibility, and regulatory risks due to the heavily regulated utility environment. XEL’s Altman Z-score of 0.89 and PEG’s 1.32 place them in distress zones, signaling financial vulnerability despite stable dividends. Operational inefficiencies and environmental transition challenges remain key concerns for investors.
Which Stock to Choose?
Xcel Energy Inc. (XEL) shows a favorable income statement with a 14.4% net margin and positive growth trends in earnings per share and net income over 2020-2024. However, financial ratios reveal several unfavorable metrics, including a low current ratio (0.67) and high debt-to-equity ratio (1.55), resulting in a slightly unfavorable global ratios evaluation. The company’s rating is moderate (C+), with a very favorable overall rating but weak scores in debt and valuation metrics. Its economic moat is slightly unfavorable as ROIC lags behind WACC, though ROIC is improving.
Public Service Enterprise Group Incorporated (PEG) presents a less favorable income statement, with a 17.22% net margin but overall negative growth in net income and EPS over the period, indicating an unfavorable income evaluation. Financial ratios are slightly better than XEL’s, with fewer unfavorable metrics and a slightly lower debt-to-equity ratio (1.42), but still a slightly unfavorable global ratios opinion. PEG holds a more favorable rating (B-) with stronger profitability scores, although its discounted cash flow score is very unfavorable. Its economic moat status mirrors XEL’s, with ROIC below WACC but showing growth.
For investors, the choice might depend on their profile: those seeking companies with more consistent income growth and improving profitability could find XEL’s favorable income statement and growing ROIC appealing, despite weaker financial ratios and moderate ratings. Conversely, investors valuing stronger profitability ratios and higher ratings, even amid unfavorable income trends, might view PEG as a viable option. Both companies face challenges with value creation relative to their capital costs but show improving profitability.
Disclaimer: Investment carries a risk of loss of initial capital. The past performance is not a reliable indicator of future results. Be sure to understand risks before making an investment decision.
Go Further
I encourage you to read the complete analyses of Xcel Energy Inc. and Public Service Enterprise Group Incorporated to enhance your investment decisions: