Public Service Enterprise Group Incorporated (PEG) and WEC Energy Group, Inc. (WEC) both operate in the regulated electric utilities sector, delivering essential energy services across different U.S. regions. Each pursues innovation through renewable energy investments and infrastructure expansion. Their overlapping markets and strategic focus make them prime candidates for comparison. In this article, I will help you identify which company offers the most compelling investment opportunity in today’s evolving energy landscape.
Table of contents
Companies Overview
I will begin the comparison between Public Service Enterprise Group Incorporated and WEC Energy Group, Inc. by providing an overview of these two companies and their main differences.
Public Service Enterprise Group Incorporated Overview
Public Service Enterprise Group Incorporated (PEG) operates as an energy company mainly in the Northeastern and Mid-Atlantic US. Its mission focuses on electricity transmission and distribution, natural gas services, and investments in solar generation and energy efficiency programs. PEG manages a vast infrastructure including 25,000 circuit miles of electric transmission and 18,000 miles of gas mains, positioning it as a key player in regulated electric utilities.
WEC Energy Group, Inc. Overview
WEC Energy Group, Inc. (WEC) provides regulated natural gas and electricity services across multiple US states, emphasizing both renewable and nonrenewable energy sources. The company operates through six segments covering electricity generation, transmission, and gas distribution. WEC’s extensive assets include over 35,800 miles of overhead distribution lines and 50,900 miles of natural gas mains, reflecting its diversified energy infrastructure and service footprint.
Key similarities and differences
Both PEG and WEC operate in the regulated electric utilities industry and serve diverse energy needs, including electricity and natural gas distribution. However, PEG concentrates on the Northeastern and Mid-Atlantic regions with a significant focus on solar and energy efficiency, while WEC has a broader geographic reach with diversified energy generation sources such as coal, wind, and biomass. WEC is smaller in workforce size but maintains a wider segment structure compared to PEG’s two main segments.
Income Statement Comparison
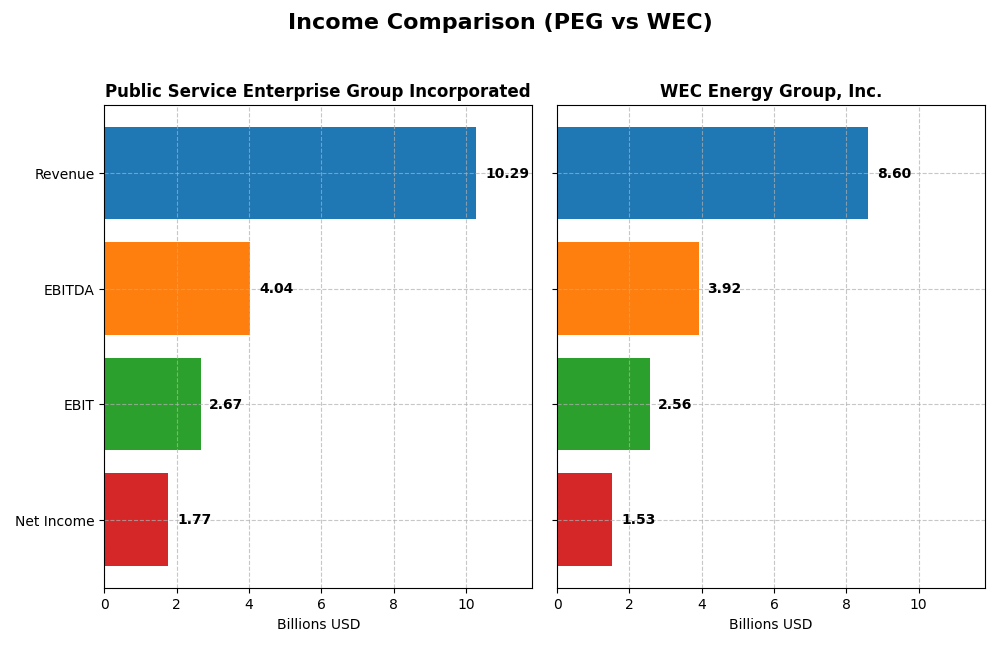
The following table compares the key income statement metrics for Public Service Enterprise Group Incorporated and WEC Energy Group, Inc. based on their most recent fiscal year data for 2024.
| Metric | Public Service Enterprise Group Incorporated | WEC Energy Group, Inc. |
|---|---|---|
| Market Cap | 39.3B | 33.5B |
| Revenue | 10.3B | 8.6B |
| EBITDA | 4.0B | 3.9B |
| EBIT | 2.7B | 2.6B |
| Net Income | 1.8B | 1.5B |
| EPS | 3.56 | 4.81 |
| Fiscal Year | 2024 | 2024 |
Income Statement Interpretations
Public Service Enterprise Group Incorporated
From 2020 to 2024, PEG’s revenue showed modest overall growth of 7.15% but declined by 8.43% in the last year. Net income decreased by 6.98% overall and dropped sharply by 30.99% in 2024. Margins revealed some stability with a favorable gross margin of 34.41% and net margin of 17.22%, though recent margin growth was unfavorable. The 2024 performance highlights slowed revenue and profit contraction despite historically favorable margins.
WEC Energy Group, Inc.
WEC experienced a 18.76% revenue increase from 2020 to 2024, with a 3.3% decline in 2024. Net income rose 27.25% overall and increased 14.45% in the last year. Margins improved, showing a strong gross margin of 44.02% and net margin of 17.77%, both favorable. The latest fiscal year showed margin expansion and profit growth, supported by positive trends in EBIT and EPS growth.
Which one has the stronger fundamentals?
WEC Energy Group demonstrates stronger fundamentals with predominantly favorable income statement metrics, including consistent margin improvements and solid growth in revenue, net income, and EPS. In contrast, PEG shows several unfavorable growth trends and margin contractions despite some stable margin levels. Overall, WEC’s income statement presents a more robust and positive financial trajectory.
Financial Ratios Comparison
The table below presents the most recent financial ratios for Public Service Enterprise Group Incorporated (PEG) and WEC Energy Group, Inc. (WEC) for the fiscal year 2024, showing key metrics relevant for investor analysis.
| Ratios | Public Service Enterprise Group Incorporated (PEG) | WEC Energy Group, Inc. (WEC) |
|---|---|---|
| ROE | 10.99% | 12.30% |
| ROIC | 4.40% | 4.14% |
| P/E | 23.74 | 19.46 |
| P/B | 2.61 | 2.39 |
| Current Ratio | 0.65 | 0.60 |
| Quick Ratio | 0.48 | 0.43 |
| D/E | 1.42 | 1.64 |
| Debt-to-Assets | 41.89% | 42.92% |
| Interest Coverage | 2.80 | 2.64 |
| Asset Turnover | 0.19 | 0.18 |
| Fixed Asset Turnover | 0.26 | 0.25 |
| Payout Ratio | 67.49% | 69.10% |
| Dividend Yield | 2.84% | 3.55% |
Interpretation of the Ratios
Public Service Enterprise Group Incorporated
Public Service Enterprise Group shows a mixed ratio profile in 2024, with a favorable net margin of 17.22% and dividend yield of 2.84%, indicating solid profitability and shareholder returns. However, concerns arise from low liquidity ratios (current ratio 0.65, quick ratio 0.48) and weak asset turnover metrics, suggesting operational inefficiencies. The payout appears sustainable given a stable dividend yield, but debt levels require attention.
WEC Energy Group, Inc.
WEC Energy Group also presents mixed financial ratios, with a slightly higher net margin of 17.77% and a dividend yield of 3.55%, reflecting decent profitability and attractive shareholder income. Liquidity ratios remain unfavorable (current ratio 0.6, quick ratio 0.43), and asset turnover is weak. Debt metrics are slightly higher than PEG’s, but dividend coverage seems supported by cash flows, with no immediate distribution risks visible.
Which one has the best ratios?
Both companies exhibit similar percentages of favorable and unfavorable ratios, with slightly unfavorable overall profiles. PEG and WEC share concerns over liquidity and asset efficiency, though WEC edges PEG slightly in dividend yield and net margin. Neither stands out decisively; investors should weigh specific financial strengths and weaknesses within their broader strategies.
Strategic Positioning
This section compares the strategic positioning of PEG and WEC, focusing on Market position, Key segments, and exposure to disruption:
Public Service Enterprise Group Incorporated (PEG)
- Market position and competitive pressure
- Key segments and business drivers
- Exposure to technological disruption
WEC Energy Group, Inc. (WEC)
- Operates primarily in Northeastern and Mid-Atlantic US with significant regulated electric presence.
- Two segments: PSE&G (electricity and gas distribution) and PSEG Power; strong focus on transmission and gas distribution.
- Invests in solar generation and energy efficiency programs amid regulated electric utilities.
PEG vs WEC Positioning
PEG’s strategy centers on a concentrated regional approach with two main segments emphasizing regulated electric and gas services. WEC adopts a more diversified multi-state model including broader renewable and non-utility infrastructure segments, spreading operational risks and opportunities.
Which has the best competitive advantage?
Both PEG and WEC are shedding value with ROIC below WACC, but each shows growing ROIC trends. Their competitive advantages are slightly unfavorable, reflecting challenges in value creation despite improving profitability.
Stock Comparison
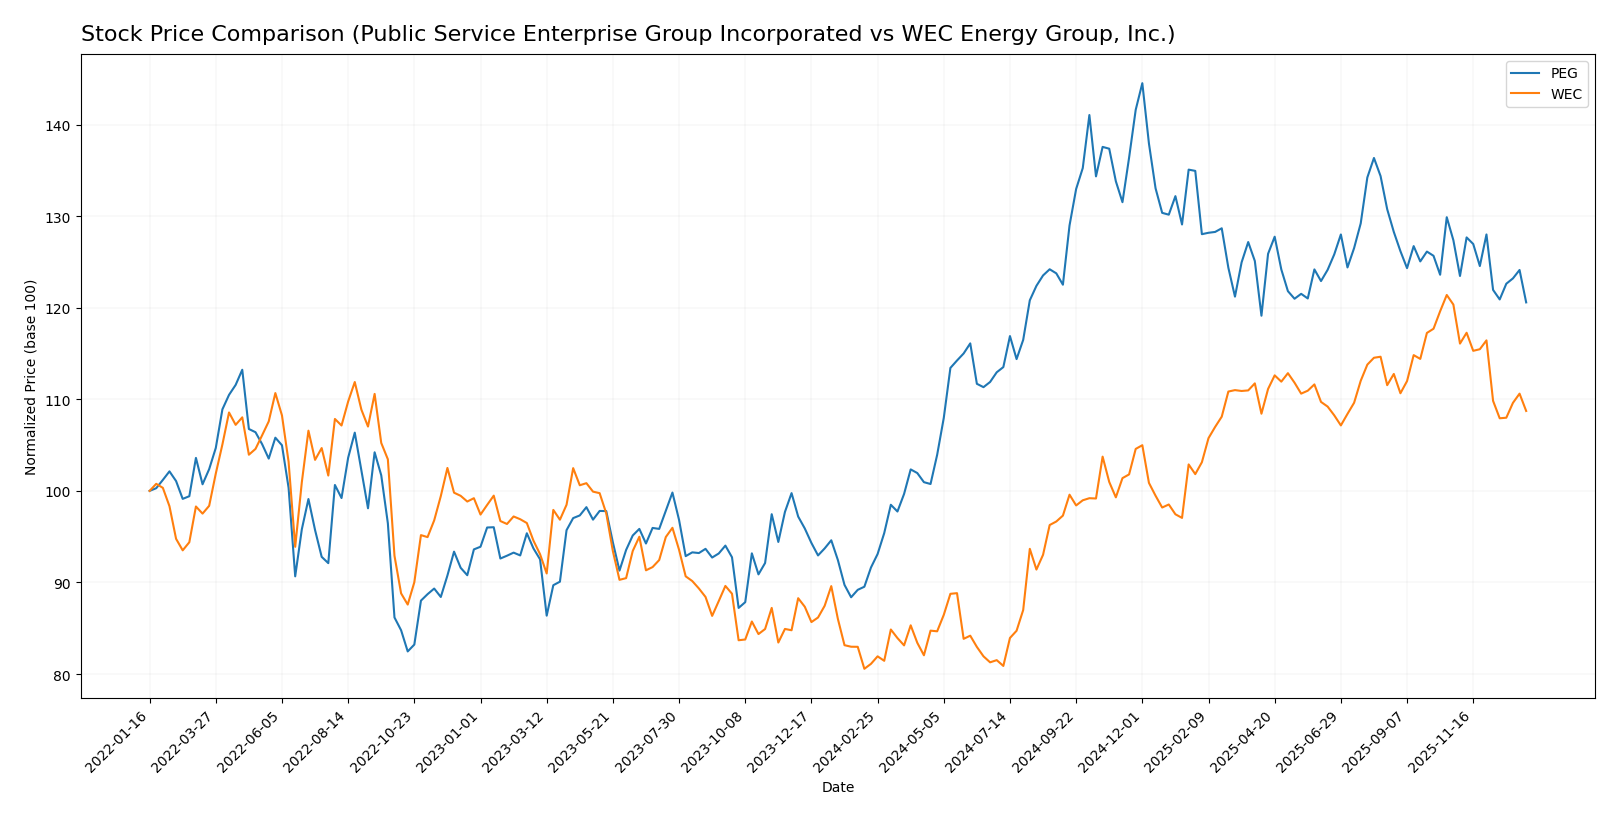
The stock prices of Public Service Enterprise Group Incorporated (PEG) and WEC Energy Group, Inc. (WEC) have shown significant bullish trends over the past 12 months, with both experiencing decelerating momentum and recent short-term declines.
Trend Analysis
Public Service Enterprise Group Incorporated (PEG) exhibited a bullish trend over the past 12 months with a 31.59% price increase, decelerating momentum, and a price range between 59.79 and 94.3. Recent weeks show a mild bearish correction of -5.33%.
WEC Energy Group, Inc. (WEC) demonstrated a bullish trend with a 34.05% gain over the last year, also with decelerating acceleration and a wider price range from 77.85 to 116.84. Its recent trend shows a sharper decline of -9.65%.
Comparing both stocks, WEC delivered the highest market performance with a 34.05% gain versus PEG’s 31.59%, despite both experiencing recent short-term downtrends.
Target Prices
The current analyst consensus for target prices indicates moderate upside potential for these utilities stocks.
| Company | Target High | Target Low | Consensus |
|---|---|---|---|
| Public Service Enterprise Group Incorporated | 98 | 83 | 89 |
| WEC Energy Group, Inc. | 136 | 105 | 122.67 |
Analysts expect Public Service Enterprise Group’s price to rise above its current 78.68 USD, while WEC Energy Group shows a notably higher upside from its current 104.65 USD price, signaling positive market sentiment for both.
Analyst Opinions Comparison
This section compares analysts’ ratings and grades for Public Service Enterprise Group Incorporated (PEG) and WEC Energy Group, Inc. (WEC):
Rating Comparison
PEG Rating
- Rating: B-, considered very favorable by analysts.
- Discounted Cash Flow Score: 1, indicating a very unfavorable valuation based on future cash flows.
- ROE Score: 4, showing favorable efficiency in generating profit from shareholders’ equity.
- ROA Score: 4, reflecting favorable effectiveness in asset utilization to generate earnings.
- Debt To Equity Score: 2, reflecting moderate financial risk and balance sheet strength.
- Overall Score: 3, indicating a moderate overall financial standing.
WEC Rating
- Rating: B-, considered very favorable by analysts.
- Discounted Cash Flow Score: 1, indicating a very unfavorable valuation based on future cash flows.
- ROE Score: 4, showing favorable efficiency in generating profit from shareholders’ equity.
- ROA Score: 4, reflecting favorable effectiveness in asset utilization to generate earnings.
- Debt To Equity Score: 2, reflecting moderate financial risk and balance sheet strength.
- Overall Score: 3, indicating a moderate overall financial standing.
Which one is the best rated?
Both PEG and WEC share identical ratings and score profiles, with B- ratings and moderate overall scores. Neither company is rated better; they are equally assessed by the provided data.
Scores Comparison
The scores comparison between Public Service Enterprise Group Incorporated (PEG) and WEC Energy Group, Inc. (WEC) is as follows:
PEG Scores
- Altman Z-Score: 1.32, in distress zone, indicating high bankruptcy risk.
- Piotroski Score: 7, classified as strong financial health.
WEC Scores
- Altman Z-Score: 1.14, in distress zone, indicating high bankruptcy risk.
- Piotroski Score: 6, classified as average financial health.
Which company has the best scores?
PEG and WEC both have Altman Z-Scores in the distress zone, suggesting high bankruptcy risk. However, PEG’s Piotroski Score is stronger at 7 compared to WEC’s 6, indicating PEG shows better financial health based on this metric.
Grades Comparison
Here is the grades comparison for Public Service Enterprise Group Incorporated and WEC Energy Group, Inc.:
Public Service Enterprise Group Incorporated Grades
This table summarizes recent grades and rating actions from recognized grading companies.
| Grading Company | Action | New Grade | Date |
|---|---|---|---|
| Ladenburg Thalmann | Buy | Buy | 2026-01-07 |
| UBS | Maintain | Buy | 2025-12-17 |
| JP Morgan | Maintain | Overweight | 2025-12-12 |
| Jefferies | Upgrade | Buy | 2025-11-06 |
| TD Cowen | Maintain | Buy | 2025-11-05 |
| BMO Capital | Maintain | Market Perform | 2025-11-04 |
| Barclays | Maintain | Equal Weight | 2025-10-21 |
| BMO Capital | Maintain | Market Perform | 2025-10-20 |
| Morgan Stanley | Maintain | Overweight | 2025-09-25 |
| BMO Capital | Maintain | Market Perform | 2025-08-06 |
Overall, Public Service Enterprise Group shows a generally positive trend with multiple buy and overweight ratings maintained or upgraded in the recent months.
WEC Energy Group, Inc. Grades
This table summarizes recent grades and rating actions from recognized grading companies.
| Grading Company | Action | New Grade | Date |
|---|---|---|---|
| B of A Securities | Maintain | Neutral | 2025-12-31 |
| UBS | Maintain | Neutral | 2025-12-17 |
| Barclays | Maintain | Underweight | 2025-12-16 |
| Keybanc | Maintain | Overweight | 2025-12-12 |
| JP Morgan | Maintain | Neutral | 2025-12-11 |
| Scotiabank | Maintain | Sector Outperform | 2025-10-31 |
| BMO Capital | Maintain | Market Perform | 2025-10-21 |
| Barclays | Maintain | Equal Weight | 2025-10-21 |
| Keybanc | Maintain | Overweight | 2025-10-15 |
| UBS | Maintain | Neutral | 2025-10-10 |
WEC Energy Group’s grades present a mixed picture, with a majority of neutral and hold-equivalent ratings alongside some overweight and sector outperform assessments.
Which company has the best grades?
Public Service Enterprise Group has received more favorable grades overall, with a consensus of “Buy” and several buy ratings and upgrades, indicating stronger analyst confidence. WEC Energy Group holds a “Hold” consensus with more neutral and mixed ratings, reflecting more cautious sentiment. This difference may influence investor perception of growth potential and risk profiles.
Strengths and Weaknesses
Below is a comparative overview of the strengths and weaknesses of Public Service Enterprise Group Incorporated (PEG) and WEC Energy Group, Inc. (WEC), based on recent financial and operational data.
| Criterion | Public Service Enterprise Group (PEG) | WEC Energy Group (WEC) |
|---|---|---|
| Diversification | Moderate diversification with strong segments in gas distribution and electric utilities; some revenue concentration risks. | Diversified across geographic regions with utility and non-utility energy infrastructure segments. |
| Profitability | Net margin at 17.22% (favorable); ROE neutral at 11%; ROIC unfavorable at 4.4%, below WACC. | Net margin at 17.77% (favorable); ROE neutral at 12.3%; ROIC unfavorable at 4.14%, below WACC. |
| Innovation | Limited innovation indicators; traditional utility focus with gradual improvements in efficiency. | Similar traditional utility profile with incremental innovation in infrastructure. |
| Global presence | Primarily regional in the US Northeast and Mid-Atlantic regions. | Primarily regional US presence, focused on Wisconsin and Illinois, with some expansion. |
| Market Share | Strong in its core service areas, especially electric and gas distribution contracts. | Strong market share in Wisconsin and Illinois utilities, stable infrastructure contracts. |
Both companies exhibit slightly unfavorable economic moats, as their ROIC remains below their WACC, indicating value destruction despite improving profitability trends. They maintain stable profitability but face challenges in efficiently deploying capital for growth. Investors should weigh these factors carefully and monitor improvements in operational efficiencies and capital returns.
Risk Analysis
Below is a comparative risk assessment table for Public Service Enterprise Group Incorporated (PEG) and WEC Energy Group, Inc. (WEC) based on the most recent 2024 data:
| Metric | Public Service Enterprise Group (PEG) | WEC Energy Group (WEC) |
|---|---|---|
| Market Risk | Moderate, beta 0.61 implies lower volatility than market | Moderate, beta 0.57 shows lower market sensitivity |
| Debt Level | DE ratio 1.42 (unfavorable), debt-to-assets 41.9% (neutral) | DE ratio 1.64 (unfavorable), debt-to-assets 42.9% (neutral) |
| Regulatory Risk | High, as a regulated electric utility in Northeastern US | High, regulated utility with broad Midwest and other states presence |
| Operational Risk | Moderate, extensive infrastructure but some unfavorable asset turnover ratios | Moderate, large asset base with unfavorable turnover ratios |
| Environmental Risk | Present, exposure to energy transition and renewable investments | Present, exposure to diversified generation sources including fossil fuels and renewables |
| Geopolitical Risk | Low, mainly US-focused operations | Low, US-focused but with multiple state jurisdictions |
In synthesis, both PEG and WEC face significant regulatory and environmental risks inherent to the regulated electric utilities sector. Their high debt levels and low liquidity ratios increase financial vulnerability, especially given their Altman Z-Scores falling in the distress zone, signaling elevated bankruptcy risk. PEG’s and WEC’s operational efficiencies are challenged by low asset turnover ratios. Investors should weigh these risks carefully, particularly the financial leverage and regulatory environment, when considering these stocks for their portfolio.
Which Stock to Choose?
Public Service Enterprise Group Incorporated (PEG) shows a mixed financial picture with unfavorable income growth and a slightly unfavorable global ratios evaluation. Its profitability is moderate, debt levels are high, and the company is rated B- with moderate overall financial scores but a very favorable rating status.
WEC Energy Group, Inc. (WEC) presents a more favorable income evolution, with positive growth across key metrics and a strong profitability profile. Its financial ratios also show a slightly unfavorable overall stance, with moderate debt and a B- rating, similarly reflecting moderate scores but very favorable rating status.
For investors focused on growth and improving profitability, WEC’s favorable income trends and solid ratings might appear more attractive. Conversely, more risk-tolerant investors considering value creation despite challenges could find PEG’s improving profitability and moderate financial standing of interest.
Disclaimer: Investment carries a risk of loss of initial capital. The past performance is not a reliable indicator of future results. Be sure to understand risks before making an investment decision.
Go Further
I encourage you to read the complete analyses of Public Service Enterprise Group Incorporated and WEC Energy Group, Inc. to enhance your investment decisions: