In the evolving landscape of regulated electric utilities, The Southern Company (SO) and Public Service Enterprise Group Incorporated (PEG) stand out as key players. Both companies serve millions of customers with electricity and natural gas, focusing on innovation through renewable energy and infrastructure investments. Their market overlap and commitment to sustainable energy make them ideal candidates for comparison. In this article, I will help you identify which company holds the most promise for your investment portfolio.
Table of contents
Companies Overview
I will begin the comparison between The Southern Company and Public Service Enterprise Group Incorporated by providing an overview of these two companies and their main differences.
The Southern Company Overview
The Southern Company is a leading utility firm engaged in electricity generation, transmission, and distribution, serving approximately 8.7M electric and gas utility customers. Its operations span renewable energy, natural gas pipelines, and digital communications. Headquartered in Atlanta, Georgia, Southern Company manages diverse power assets including hydroelectric, fossil fuel, nuclear, solar, wind, and battery storage facilities.
Public Service Enterprise Group Incorporated Overview
Public Service Enterprise Group Incorporated operates primarily in the Northeastern and Mid-Atlantic US, focusing on electric and gas transmission and distribution. It runs two main segments: PSE&G and PSEG Power, with extensive infrastructure including 25,000 circuit miles of electric transmission and 18,000 miles of gas mains. The Newark, New Jersey-based company also invests in solar projects and energy efficiency programs.
Key similarities and differences
Both companies operate in the regulated electric utility sector, providing electricity and gas services to residential, commercial, and industrial customers. Southern Company has a broader geographic footprint and a more diversified generation portfolio, including nuclear and battery storage, while Public Service Enterprise Group concentrates on transmission and distribution in a defined regional market. Each invests in renewable energy, but their operational scale and asset types differ significantly.
Income Statement Comparison
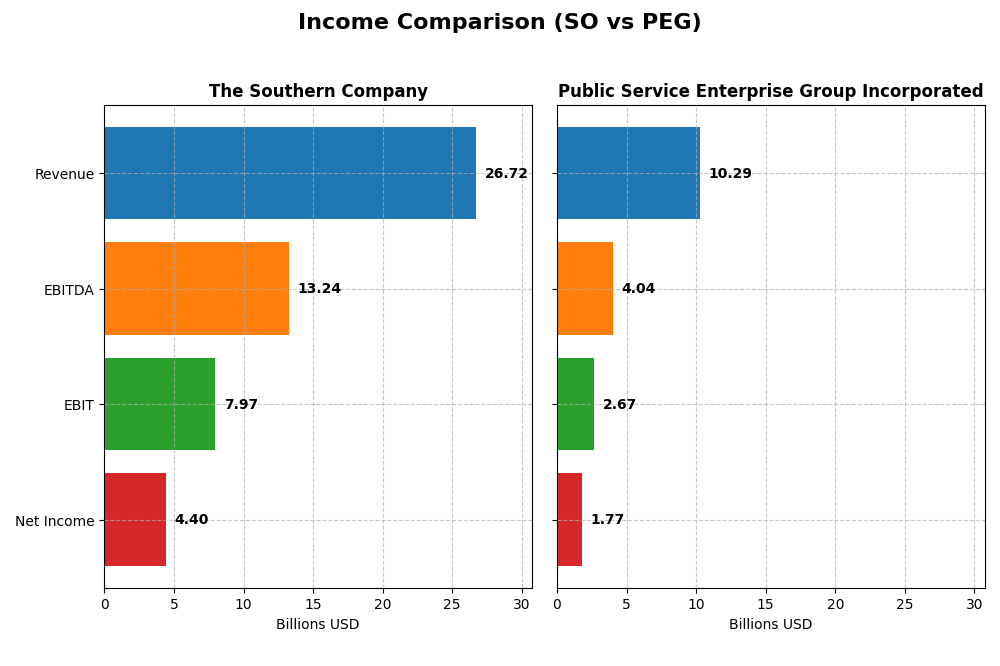
This table compares key income statement metrics for The Southern Company and Public Service Enterprise Group Incorporated for the fiscal year 2024.
| Metric | The Southern Company | Public Service Enterprise Group Incorporated |
|---|---|---|
| Market Cap | 95.7B | 39.3B |
| Revenue | 26.7B | 10.3B |
| EBITDA | 13.2B | 4.0B |
| EBIT | 7.97B | 2.67B |
| Net Income | 4.40B | 1.77B |
| EPS | 4.02 | 3.56 |
| Fiscal Year | 2024 | 2024 |
Income Statement Interpretations
The Southern Company
The Southern Company demonstrated steady revenue growth from 2020 to 2024, increasing from $20.4B to $26.7B, with net income rising from $3.1B to $4.4B. Gross and EBIT margins remained favorable at 49.9% and 29.8%, respectively, despite a somewhat unfavorable interest expense ratio. In 2024, revenue growth slowed to 5.8%, but EBIT and EPS growth remained robust, reflecting improving profitability.
Public Service Enterprise Group Incorporated
Public Service Enterprise Group’s revenue fluctuated modestly, ending at $10.3B in 2024, slightly up from $9.6B in 2020, while net income declined from $1.9B to $1.8B. Gross and EBIT margins stayed favorable but lower than Southern’s, at 34.4% and 25.9%. The latest year saw an 8.4% revenue drop and declines in EBIT, net margin, and EPS, marking a challenging performance period.
Which one has the stronger fundamentals?
The Southern Company presents stronger fundamentals with consistent revenue and net income growth, favorable margin improvements, and a positive overall income statement evaluation. Public Service Enterprise Group shows weaker trends, including declining profitability metrics and an unfavorable income growth profile over the period, indicating less stable financial performance compared to Southern.
Financial Ratios Comparison
The table below compares key financial ratios for The Southern Company (SO) and Public Service Enterprise Group Incorporated (PEG) based on their latest available fiscal year data (2024).
| Ratios | The Southern Company (SO) | Public Service Enterprise Group (PEG) |
|---|---|---|
| ROE | 13.25% | 10.99% |
| ROIC | 4.25% | 4.40% |
| P/E | 20.5 | 23.74 |
| P/B | 2.72 | 2.61 |
| Current Ratio | 0.67 | 0.65 |
| Quick Ratio | 0.46 | 0.48 |
| D/E (Debt-to-Equity) | 2.00 | 1.42 |
| Debt-to-Assets | 45.7% | 41.9% |
| Interest Coverage | 2.58 | 2.80 |
| Asset Turnover | 0.18 | 0.19 |
| Fixed Asset Turnover | 0.25 | 0.26 |
| Payout Ratio | 67.1% | 67.5% |
| Dividend Yield | 3.27% | 2.84% |
Interpretation of the Ratios
The Southern Company
The Southern Company shows a mixed ratio profile with favorable net margin (16.47%) and dividend yield (3.27%), but weak liquidity indicated by low current (0.67) and quick ratios (0.46). Leverage is high with debt-to-equity at 2.0, while returns on equity (13.25%) and invested capital (4.25%) raise concerns. The company maintains a steady dividend, supported by moderate payout ratios and consistent share buybacks, though free cash flow coverage appears tight.
Public Service Enterprise Group Incorporated
Public Service Enterprise Group presents similarly mixed ratios, with a slightly higher net margin (17.22%) but a lower dividend yield (2.84%). Liquidity ratios remain weak (current ratio 0.65, quick ratio 0.48), and debt levels are more moderate with debt-to-equity at 1.42. Returns on equity (11.0%) and invested capital (4.4%) are modest. The company pays dividends with regular payouts, balancing share repurchases and reinvestment needs amid constrained free cash flow.
Which one has the best ratios?
Both companies exhibit slightly unfavorable overall ratio profiles, reflecting challenges in liquidity and capital efficiency. Southern Company delivers a higher dividend yield and return on equity but carries heavier leverage and weaker asset turnover. Public Service Enterprise Group has lower leverage and comparable profitability but offers a smaller dividend yield. Neither stands out clearly as superior; both warrant careful consideration of their mixed strengths and risks.
Strategic Positioning
This section compares the strategic positioning of The Southern Company and Public Service Enterprise Group, focusing on Market position, Key segments, and Exposure to technological disruption:
The Southern Company (SO)
- Large market cap (~$95.7B) with broad geographic coverage in southeastern US; faces regulated electric industry pressures.
- Diverse segments including electric utilities, gas distribution, marketing, pipeline investments, and renewable energy.
- Operates multiple generation types including fossil fuel, nuclear, hydro, solar, wind, fuel cells, and battery storage.
Public Service Enterprise Group (PEG)
- Smaller market cap (~$39.3B) focused on Northeastern and Mid-Atlantic US; operates in regulated electric sector.
- Concentrated business in electric and gas distribution, transmission, and solar generation projects.
- Invests in solar generation and energy efficiency; traditional electric and gas transmission and distribution.
The Southern Company vs Public Service Enterprise Group Positioning
SO pursues a diversified strategy with multiple energy sources and broad utilities segments, providing varied revenue streams. PEG’s strategy is more concentrated on electric and gas distribution with selective renewable investments, implying focused but narrower exposure.
Which has the best competitive advantage?
Both SO and PEG are slightly unfavorable in MOAT evaluation, shedding value despite growing profitability. Neither shows a clear competitive advantage based on ROIC versus WACC metrics strictly from the provided data.
Stock Comparison
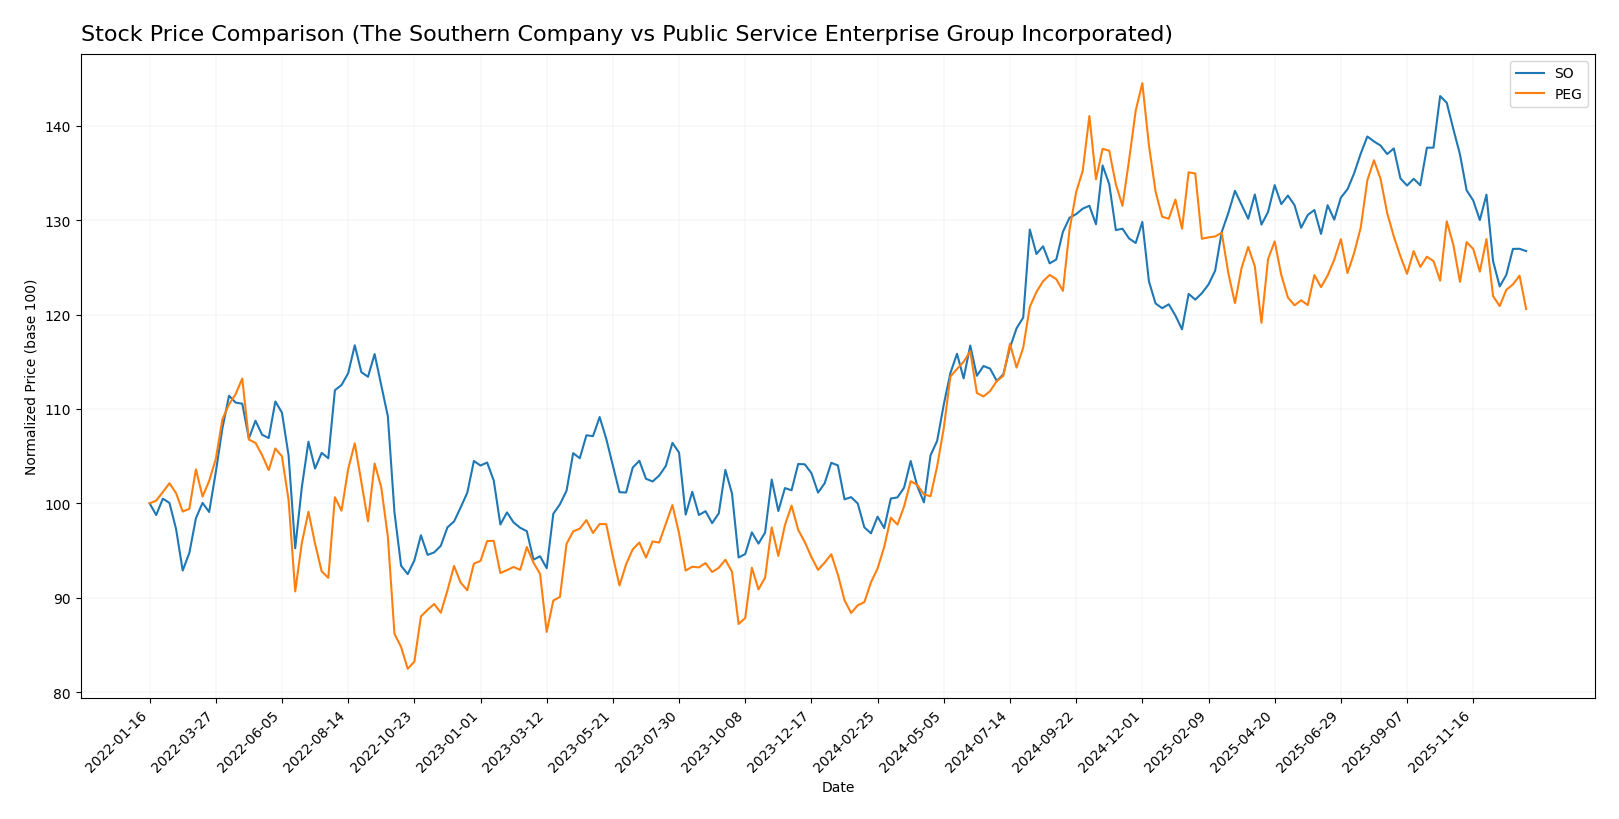
The stock price movements of The Southern Company (SO) and Public Service Enterprise Group Incorporated (PEG) over the past 12 months show significant bullish gains with recent deceleration and a short-term downward correction in both cases.
Trend Analysis
The Southern Company’s stock exhibited a bullish trend with a 30.88% increase over the past year, accompanied by decelerating momentum. Its price ranged from 66.48 to 98.29, with recent weeks showing a -9.25% correction.
Public Service Enterprise Group’s stock also showed a bullish trend with a 31.59% gain over 12 months, but with decelerating acceleration. The price fluctuated between 59.79 and 94.3, followed by a recent -5.33% decline.
Comparing both, PEG delivered a slightly higher overall market performance than SO over the year, despite both experiencing recent short-term downward trends.
Target Prices
Analysts present a positive target consensus for The Southern Company and Public Service Enterprise Group Incorporated, indicating potential upside.
| Company | Target High | Target Low | Consensus |
|---|---|---|---|
| The Southern Company | 103 | 76 | 93.1 |
| Public Service Enterprise Group Incorporated | 98 | 83 | 89 |
The Southern Company’s consensus target of 93.1 is above its current price of 87.01, suggesting moderate appreciation potential. Public Service Enterprise Group’s consensus target of 89 also exceeds its price of 78.68, reflecting bullish analyst expectations.
Analyst Opinions Comparison
This section compares analysts’ ratings and grades for The Southern Company and Public Service Enterprise Group Incorporated:
Rating Comparison
The Southern Company Rating
- Rating: B-; classified as Very Favorable by analysts.
- Discounted Cash Flow Score: Moderate at 3, indicating balanced valuation.
- ROE Score: Favorable at 4, showing efficient profit generation from equity.
- ROA Score: Moderate at 3, reflecting average asset utilization.
- Debt To Equity Score: Very Unfavorable at 1, suggesting higher financial risk.
- Overall Score: Moderate at 3, summarizing average financial standing.
Public Service Enterprise Group Incorporated Rating
- Rating: B-; classified as Very Favorable by analysts.
- Discounted Cash Flow Score: Very Unfavorable at 1, suggesting less favorable valuation.
- ROE Score: Favorable at 4, indicating strong equity profit efficiency.
- ROA Score: Favorable at 4, indicating better asset utilization.
- Debt To Equity Score: Moderate at 2, representing moderate financial risk.
- Overall Score: Moderate at 3, summarizing average financial standing.
Which one is the best rated?
Both companies share the same overall rating of B- and an overall score of 3, but The Southern Company scores better on discounted cash flow, while Public Service Enterprise Group has stronger ROA and a less risky debt-to-equity profile.
Scores Comparison
The following table compares the Altman Z-Score and Piotroski Score for The Southern Company and Public Service Enterprise Group Incorporated:
SO Scores
- Altman Z-Score: 0.98, in distress zone, high bankruptcy risk.
- Piotroski Score: 6, average financial strength.
PEG Scores
- Altman Z-Score: 1.32, also in distress zone, high bankruptcy risk.
- Piotroski Score: 7, strong financial strength.
Which company has the best scores?
Based on the provided data, PEG has a slightly higher Altman Z-Score but remains in the distress zone; however, its Piotroski Score is stronger than SO’s, indicating better overall financial strength.
Grades Comparison
Here is the grades comparison for The Southern Company and Public Service Enterprise Group Incorporated:
The Southern Company Grades
This table summarizes recent grades and actions from major grading firms for The Southern Company.
| Grading Company | Action | New Grade | Date |
|---|---|---|---|
| UBS | Maintain | Neutral | 2025-12-17 |
| JP Morgan | Maintain | Neutral | 2025-12-15 |
| Jefferies | Maintain | Neutral | 2025-12-15 |
| RBC Capital | Maintain | Sector Perform | 2025-12-12 |
| Keybanc | Maintain | Underweight | 2025-12-12 |
| Mizuho | Maintain | Neutral | 2025-12-11 |
| Barclays | Maintain | Equal Weight | 2025-11-20 |
| Jefferies | Downgrade | Neutral | 2025-11-05 |
| Ladenburg Thalmann | Downgrade | Neutral | 2025-10-17 |
| Keybanc | Maintain | Underweight | 2025-10-15 |
The Southern Company’s grades predominantly show a neutral to hold stance with some underweight ratings, reflecting a cautious market view.
Public Service Enterprise Group Incorporated Grades
Below is a summary of recent grades and actions from recognized grading companies for Public Service Enterprise Group Incorporated.
| Grading Company | Action | New Grade | Date |
|---|---|---|---|
| Ladenburg Thalmann | Upgrade | Buy | 2026-01-07 |
| UBS | Maintain | Buy | 2025-12-17 |
| JP Morgan | Maintain | Overweight | 2025-12-12 |
| Jefferies | Upgrade | Buy | 2025-11-06 |
| TD Cowen | Maintain | Buy | 2025-11-05 |
| BMO Capital | Maintain | Market Perform | 2025-11-04 |
| Barclays | Maintain | Equal Weight | 2025-10-21 |
| BMO Capital | Maintain | Market Perform | 2025-10-20 |
| Morgan Stanley | Maintain | Overweight | 2025-09-25 |
| BMO Capital | Maintain | Market Perform | 2025-08-06 |
Public Service Enterprise Group shows a generally positive consensus with multiple buy ratings and upgrades, indicating favorable analyst sentiment.
Which company has the best grades?
Public Service Enterprise Group has received stronger grades overall compared to The Southern Company, with more buy and overweight ratings. This may suggest greater analyst confidence and potential positive investor interest in PEG relative to SO.
Strengths and Weaknesses
Below is a comparison of key strengths and weaknesses for The Southern Company (SO) and Public Service Enterprise Group Incorporated (PEG) based on the latest financial and operational data.
| Criterion | The Southern Company (SO) | Public Service Enterprise Group (PEG) |
|---|---|---|
| Diversification | Moderate: Mix of Electric Utilities and Gas segments, with significant gas distribution revenues (~4.46B in 2024) | Moderate: Focused on electric and gas distribution with steady contract revenues (~3.98B in 2024) |
| Profitability | Net margin 16.47% (favorable); ROIC 4.25% (unfavorable vs WACC 4.96%) | Net margin 17.22% (favorable); ROIC 4.4% (unfavorable vs WACC 5.37%) |
| Innovation | Limited visible high innovation; steady ROIC growth but still value destructive | Similar pattern: growing ROIC but below WACC, indicating limited innovation impact on value |
| Global presence | Primarily U.S.-focused utilities; no significant global operations | Mostly regional U.S. operations, concentrated in New Jersey and surrounding areas |
| Market Share | Strong regional market share in southeastern U.S. electric and gas utilities | Strong market share in New Jersey electric and gas markets |
Key takeaways: Both SO and PEG show solid profitability but are currently shedding value as their ROIC remains below their cost of capital, despite improving trends. Their moderate diversification and regional focus offer stability but limit growth potential. Investors should watch for improved capital efficiency to confirm value creation.
Risk Analysis
Below is a summary table highlighting key risk factors for The Southern Company (SO) and Public Service Enterprise Group Incorporated (PEG) as of 2024.
| Metric | The Southern Company (SO) | Public Service Enterprise Group (PEG) |
|---|---|---|
| Market Risk | Beta 0.45 (low volatility) | Beta 0.61 (moderate volatility) |
| Debt level | D/E 2.0 (high, unfavorable) | D/E 1.42 (high, unfavorable) |
| Regulatory Risk | High; utilities face strict regulation | High; operates in regulated markets |
| Operational Risk | Aging infrastructure; multiple generation types | Large grid and gas operations; complexity risk |
| Environmental Risk | Transition to renewables ongoing | Investments in solar and energy efficiency |
| Geopolitical Risk | Moderate; US-focused with pipeline exposure | Moderate; primarily Northeastern US exposure |
The most significant risks for both SO and PEG are their elevated debt levels and regulatory exposure, common in utilities sectors. SO’s very low Altman Z-score indicates potential financial distress, warranting caution despite its stable dividend yield. PEG also shows financial strain but with a slightly stronger Piotroski score, suggesting better operational health. Market volatility is relatively low, but infrastructure and environmental transitions remain critical challenges.
Which Stock to Choose?
The Southern Company (SO) shows favorable income evolution with a 31.16% revenue growth over five years and strong profitability metrics, including a 16.47% net margin. Its financial ratios are slightly unfavorable, marked by high debt levels (debt-to-equity 2.0) and low liquidity, though dividend yield is favorable at 3.27%. The rating stands very favorable with a B- grade despite moderate overall scores. The company’s MOAT evaluation signals value destruction but improving profitability.
Public Service Enterprise Group Incorporated (PEG) presents an unfavorable income evolution with a 6.98% net income decline over five years and negative recent growth trends. Its financial ratios are also slightly unfavorable, with moderate debt (debt-to-equity 1.42) and weak liquidity measures, yet it maintains a favorable rating of B- overall. PEG’s MOAT assessment similarly indicates value destruction, but with a rising ROIC trend and a strong Piotroski score.
Investors focused on growth might find The Southern Company’s favorable income and improving profitability appealing, while those prioritizing financial strength and a stronger Piotroski score could view Public Service Enterprise Group as potentially suitable. Both stocks display slight value destruction in MOAT terms, suggesting cautious interpretation of their investment potential.
Disclaimer: Investment carries a risk of loss of initial capital. The past performance is not a reliable indicator of future results. Be sure to understand risks before making an investment decision.
Go Further
I encourage you to read the complete analyses of The Southern Company and Public Service Enterprise Group Incorporated to enhance your investment decisions: