In the dynamic world of software applications, Workday, Inc. (WDAY) and PTC Inc. (PTC) stand out as innovators shaping enterprise solutions. Both companies operate in overlapping markets, delivering cutting-edge software for business management and digital transformation. Workday focuses on cloud-based financial and human capital management, while PTC excels in product lifecycle and augmented reality platforms. This article will help you decide which company offers the most promising investment opportunity.
Table of contents
Companies Overview
I will begin the comparison between Workday, Inc. and PTC Inc. by providing an overview of these two companies and their main differences.
Workday, Inc. Overview
Workday, Inc. delivers enterprise cloud applications designed to help organizations plan, execute, analyze, and manage business operations. Its product suite includes financial management, human capital management, and analytics applications aimed at improving operational insights and efficiency. Headquartered in Pleasanton, California, Workday serves diverse industries like healthcare, education, financial services, and retail.
PTC Inc. Overview
PTC Inc. is a software and services company operating globally, offering platforms such as ThingWorx for digital transformation and Vuforia for augmented reality. Its portfolio includes product development and lifecycle management solutions like Onshape and Creo. Based in Boston, Massachusetts, PTC focuses on enabling digital innovation and collaboration across manufacturing and product teams.
Key similarities and differences
Both Workday and PTC operate in the software application industry, emphasizing cloud-based solutions and digital transformation. Workday primarily targets enterprise financial and human capital management, whereas PTC focuses on product lifecycle management and augmented reality technologies. Their business models converge on driving efficiency through software, but they serve distinct operational needs and industry segments.
Income Statement Comparison
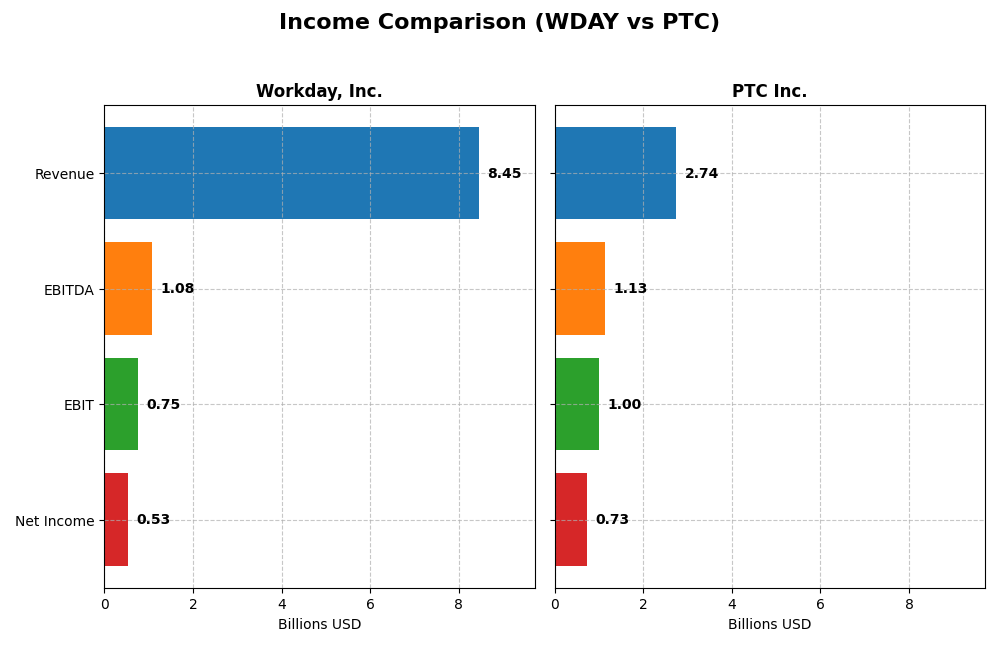
Below is a comparison of key income statement metrics for Workday, Inc. and PTC Inc. based on the most recent fiscal year data available.
| Metric | Workday, Inc. (WDAY) | PTC Inc. (PTC) |
|---|---|---|
| Market Cap | 49.9B | 19.9B |
| Revenue | 8.45B | 2.74B |
| EBITDA | 1.08B | 1.13B |
| EBIT | 752M | 997M |
| Net Income | 526M | 734M |
| EPS | 1.98 | 6.18 |
| Fiscal Year | 2025 | 2025 |
Income Statement Interpretations
Workday, Inc.
Workday’s revenue and net income showed strong overall growth from 2021 to 2025, with revenue nearly doubling and net income increasing over 280%. Margins were generally favorable, with a gross margin of 75.5% and net margin of 6.23% in 2025, although net margin and EPS declined sharply in the most recent year. The latest fiscal year featured robust revenue growth of 16.35% and a 60% increase in EBIT, but net margin contraction signals caution.
PTC Inc.
PTC demonstrated consistent revenue and net income growth between 2021 and 2025, with revenue up 51.6% and net income rising 53.9% overall. Margins improved notably, boasting a strong gross margin of 83.8%, EBIT margin of 36.4%, and net margin of 26.8% in 2025. The latest fiscal year saw favorable expansions in revenue (19.18%), gross profit (23.77%), EBIT (69.41%), and net margin (63.66%), reflecting solid operational efficiency gains.
Which one has the stronger fundamentals?
Both companies exhibit favorable income statement trends, but PTC presents stronger fundamentals with higher and improving margins, and all key growth metrics rated favorable in the recent year. Workday, while showing impressive long-term growth, experienced a notable decline in net margin and EPS last year, introducing some risk. PTC’s consistent margin expansion and balanced growth signal more stable profitability fundamentals.
Financial Ratios Comparison
Below is a comparison of key financial ratios for Workday, Inc. and PTC Inc. based on their most recent fiscal year data, providing a snapshot of their financial health and performance.
| Ratios | Workday, Inc. (WDAY) | PTC Inc. (PTC) |
|---|---|---|
| ROE | 5.82% | 19.18% |
| ROIC | 2.73% | 14.43% |
| P/E | 132.15 | 33.19 |
| P/B | 7.69 | 6.37 |
| Current Ratio | 1.85 | 1.12 |
| Quick Ratio | 1.85 | 1.12 |
| D/E (Debt-to-Equity) | 0.37 | 0.36 |
| Debt-to-Assets | 18.70% | 20.70% |
| Interest Coverage | 3.64 | 12.76 |
| Asset Turnover | 0.47 | 0.41 |
| Fixed Asset Turnover | 5.36 | 15.58 |
| Payout Ratio | 0% | 0% |
| Dividend Yield | 0% | 0% |
Interpretation of the Ratios
Workday, Inc.
Workday shows a mixed financial profile with a neutral net margin of 6.23% but unfavorable returns on equity (5.82%) and invested capital (2.73%). Its valuation multiples like PE (132.15) and PB (7.69) indicate a high premium. Liquidity and solvency ratios such as current ratio (1.85) and interest coverage (6.6) are favorable. The company does not pay dividends, reflecting a reinvestment strategy typical for growth-focused firms.
PTC Inc.
PTC displays strong profitability with a favorable net margin of 26.8%, ROE of 19.18%, and ROIC of 14.43%, supported by good interest coverage (12.95) and conservative leverage (debt-to-assets 20.7%). Although its PE (33.19) and PB (6.37) ratios are high, liquidity ratios are mostly favorable or neutral. PTC also does not distribute dividends, likely prioritizing growth and operational reinvestment.
Which one has the best ratios?
Comparing both, PTC holds a more favorable overall ratio profile with 57.14% favorable metrics versus Workday’s 42.86%. PTC’s superior profitability and coverage ratios contrast with Workday’s weaker returns and higher valuation multiples. However, both firms have no dividend payouts, focusing on reinvestment, aligning with their growth-oriented models.
Strategic Positioning
This section compares the strategic positioning of Workday, Inc. and PTC Inc., focusing on market position, key segments, and exposure to technological disruption:
Workday, Inc.
- Leading cloud applications provider with strong market cap of 50B and high competitive pressure.
- Key segments: Subscription services dominate revenue; professional services contribute significantly.
- Exposure to disruption via cloud-based financial, HCM, and analytics applications leveraging augmented analytics and machine learning.
PTC Inc.
- Mid-sized software and services firm with 20B market cap facing moderate competitive pressure.
- Operates Software Products and Professional Services segments, including platforms for digital transformation and PLM.
- Invested in digital transformation tools, AR visualization, SaaS product development, and lifecycle management software.
Workday, Inc. vs PTC Inc. Positioning
Workday pursues a concentrated cloud applications strategy focused on finance and HCM, relying heavily on subscription revenue. PTC adopts a diversified approach across software products and services, emphasizing digital transformation and product lifecycle management solutions.
Which has the best competitive advantage?
PTC demonstrates a very favorable moat with ROIC above WACC and growing profitability, indicating durable competitive advantage. Workday shows a slightly unfavorable moat, shedding value despite increasing ROIC, reflecting challenges in sustaining competitive advantage.
Stock Comparison
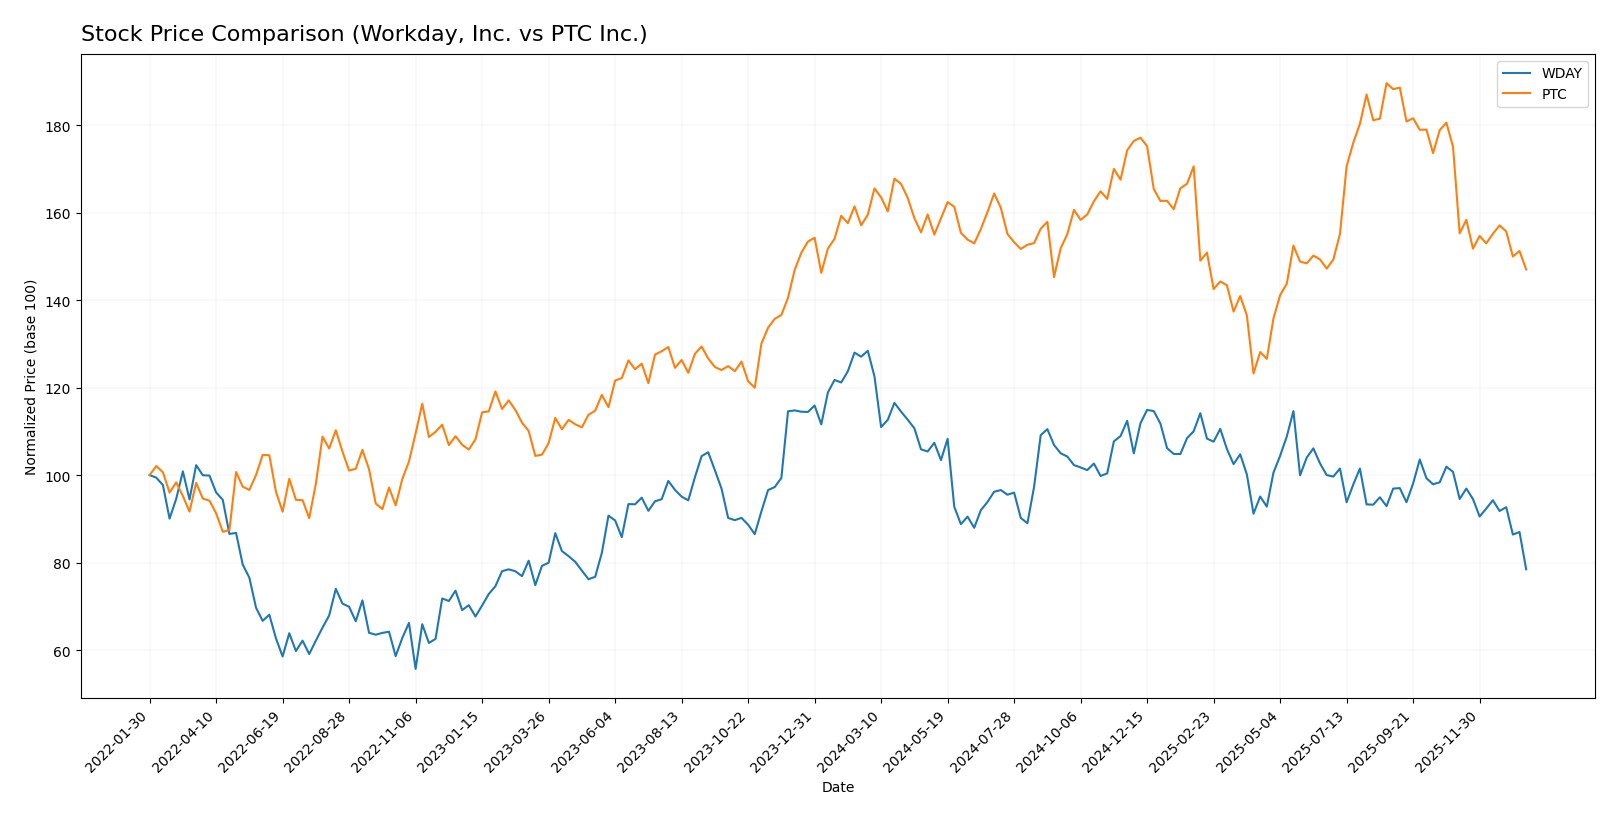
The stock prices of Workday, Inc. and PTC Inc. over the past year reveal notable declines with differing degrees of bearish momentum and trading volume dynamics, highlighting contrasting market responses and price stability.
Trend Analysis
Workday, Inc. (WDAY) experienced a bearish trend over the past 12 months with a -38.91% price change and deceleration in trend momentum. The stock showed high volatility with a 20.22 std deviation, hitting a high of 305.88 and a low of 186.86.
PTC Inc. (PTC) also showed a bearish trend with a -7.84% price change over the year and decelerating trend strength. Its volatility was lower at 15.47 std deviation, with prices ranging between 139.77 and 215.05.
Comparing both stocks, Workday delivered the lowest market performance with a deeper price decline than PTC, which maintained a relatively less severe bearish trend over the same period.
Target Prices
Analysts present a cautiously optimistic consensus for both Workday, Inc. and PTC Inc.
| Company | Target High | Target Low | Consensus |
|---|---|---|---|
| Workday, Inc. | 320 | 235 | 274.47 |
| PTC Inc. | 255 | 120 | 213.25 |
For Workday, the consensus target price of 274.47 USD is substantially above the current price of 186.86 USD, indicating potential upside. PTC’s consensus target of 213.25 USD also suggests room for growth compared to its current price of 166.75 USD.
Analyst Opinions Comparison
This section compares analysts’ ratings and grades for Workday, Inc. (WDAY) and PTC Inc. (PTC):
Rating Comparison
WDAY Rating
- Rating: B-, classified as Very Favorable.
- Discounted Cash Flow Score: 4, Favorable.
- ROE Score: 3, Moderate efficiency in profit generation.
- ROA Score: 3, Moderate asset utilization.
- Debt To Equity Score: 2, Moderate financial risk.
- Overall Score: 2, Moderate financial standing.
PTC Rating
- Rating: B+, classified as Very Favorable.
- Discounted Cash Flow Score: 4, Favorable.
- ROE Score: 4, Favorable efficiency in profit generation.
- ROA Score: 5, Very Favorable asset utilization.
- Debt To Equity Score: 2, Moderate financial risk.
- Overall Score: 3, Moderate financial standing.
Which one is the best rated?
PTC holds a higher overall rating (B+) compared to WDAY’s B-, reflecting better scores in ROE and ROA. Both share equal discounted cash flow and debt-to-equity scores, but PTC’s stronger profitability and asset utilization scores make it the better rated stock based on these metrics.
Scores Comparison
The following table compares the Altman Z-Score and Piotroski Score of Workday, Inc. and PTC Inc.:
WDAY Scores
- Altman Z-Score: 4.41, indicating safe zone, low bankruptcy risk.
- Piotroski Score: 6, indicating average financial strength.
PTC Scores
- Altman Z-Score: 5.67, indicating safe zone, very low bankruptcy risk.
- Piotroski Score: 8, indicating very strong financial strength.
Which company has the best scores?
PTC has higher scores in both the Altman Z-Score and Piotroski Score compared to Workday. This suggests PTC shows stronger financial stability and strength based on the provided data.
Grades Comparison
Here is a detailed comparison of the latest grades assigned to Workday, Inc. and PTC Inc.:
Workday, Inc. Grades
This table summarizes recent analyst grades for Workday, Inc. from prominent grading firms.
| Grading Company | Action | New Grade | Date |
|---|---|---|---|
| Barclays | Maintain | Overweight | 2026-01-12 |
| RBC Capital | Maintain | Outperform | 2026-01-05 |
| TD Cowen | Maintain | Buy | 2025-11-26 |
| DA Davidson | Maintain | Neutral | 2025-11-26 |
| Wells Fargo | Maintain | Overweight | 2025-11-26 |
| Barclays | Maintain | Overweight | 2025-11-26 |
| Keybanc | Maintain | Overweight | 2025-11-26 |
| Citigroup | Maintain | Neutral | 2025-11-26 |
| JP Morgan | Maintain | Overweight | 2025-11-26 |
| UBS | Maintain | Neutral | 2025-11-26 |
The grades for Workday, Inc. generally trend towards “Overweight” and “Buy” with several neutral ratings, indicating a positive outlook with moderate caution.
PTC Inc. Grades
This table presents recent analyst grades for PTC Inc. from verified grading companies.
| Grading Company | Action | New Grade | Date |
|---|---|---|---|
| Piper Sandler | Maintain | Neutral | 2025-11-07 |
| Rosenblatt | Maintain | Buy | 2025-11-06 |
| Rosenblatt | Maintain | Buy | 2025-10-30 |
| Oppenheimer | Maintain | Outperform | 2025-07-31 |
| Rosenblatt | Maintain | Buy | 2025-07-31 |
| Barclays | Maintain | Overweight | 2025-07-31 |
| Stifel | Maintain | Buy | 2025-07-31 |
| Keybanc | Maintain | Overweight | 2025-07-31 |
| RBC Capital | Maintain | Outperform | 2025-07-31 |
| Piper Sandler | Maintain | Neutral | 2025-07-31 |
PTC Inc. shows a consistent pattern of “Buy,” “Outperform,” and “Overweight” grades with fewer neutral opinions, suggesting favorable analyst sentiment.
Which company has the best grades?
Both Workday, Inc. and PTC Inc. have received predominantly positive grades, with “Buy” and “Overweight” prevailing. Workday’s grades are slightly more concentrated on “Overweight,” while PTC shows a broader range including multiple “Buy” and “Outperform” ratings. Investors may interpret these patterns as signals of strong analyst confidence in both stocks, potentially reflecting growth prospects and market positioning.
Strengths and Weaknesses
Below is a comparison of key strengths and weaknesses of Workday, Inc. (WDAY) and PTC Inc. (PTC) based on their latest financial and operational data.
| Criterion | Workday, Inc. (WDAY) | PTC Inc. (PTC) |
|---|---|---|
| Diversification | High reliance on Subscription Services (7.72B in 2025) with smaller Professional Services (728M); moderate product diversification | Balanced revenue mix with License (1.16B), Support & Cloud Services (1.47B), and Technology Services (107M); more diversified product lines |
| Profitability | Net margin 6.23% (neutral), ROIC 2.73% (unfavorable), currently shedding value but improving ROIC trend | Strong profitability: net margin 26.8%, ROIC 14.43%, creating value with a durable competitive advantage |
| Innovation | Moderate innovation reflected in growing ROIC trend but currently unfavorable ROIC vs WACC | High innovation leading to strong ROIC and growth, reflected in very favorable moat and profitability |
| Global presence | Established global presence with steady revenue growth in subscription services | Also global, with expanding cloud services and license revenue, supporting strong market position |
| Market Share | Significant in enterprise cloud HR software but facing strong competition; high PE ratio (132.15) implies growth expectations | Strong market share in industrial software with solid financials and moderate valuation (PE 33.19) |
Key takeaways: PTC demonstrates stronger profitability, value creation, and product diversification compared to Workday. Although Workday shows improving operational efficiency, it still faces challenges in profitability and valuation. Investors should weigh PTC’s proven durable competitive advantage against Workday’s growth potential and current value destruction risk.
Risk Analysis
Below is a comparison of key risks for Workday, Inc. (WDAY) and PTC Inc. (PTC) based on the most recent data from 2025.
| Metric | Workday, Inc. (WDAY) | PTC Inc. (PTC) |
|---|---|---|
| Market Risk | Beta 1.14, moderate market volatility impact | Beta 1.01, slightly lower market sensitivity |
| Debt level | Debt/Equity 0.37, low leverage, favorable | Debt/Equity 0.36, similarly low leverage, favorable |
| Regulatory Risk | Moderate, due to global SaaS operations | Moderate, exposed to international regulations |
| Operational Risk | Moderate, cloud infrastructure dependence | Moderate, software development and services complexity |
| Environmental Risk | Low, software sector with limited direct impact | Low, technology sector with minimal direct exposure |
| Geopolitical Risk | Moderate, global client base; sensitive to trade tensions | Moderate, global presence with exposure to geopolitical shifts |
Workday shows a slightly higher market risk due to its higher beta, while both companies maintain healthy debt levels. PTC’s stronger profitability and financial health reduce its operational and financial risks. Regulatory and geopolitical risks remain moderate for both, reflecting their international exposure.
Which Stock to Choose?
Workday, Inc. (WDAY) shows a favorable income evolution with 16.35% revenue growth in 2025 and strong overall income statement metrics. However, its profitability ratios such as ROE (5.82%) and ROIC (2.73%) are unfavorable, with a slightly unfavorable MOAT status indicating value destruction despite growing ROIC. Debt levels are moderate with favorable coverage ratios, and the overall rating is very favorable at B-.
PTC Inc. (PTC) exhibits robust income growth of 19.18% in 2025 with highly favorable profitability metrics, including a 19.18% ROE and 14.43% ROIC, supported by a very favorable MOAT status signaling durable competitive advantage. Its debt profile is similarly moderate but with stronger interest coverage, and the company holds a very favorable rating of B+.
For investors prioritizing high profitability and a durable competitive moat, PTC may appear more favorable due to its superior financial ratios and strong rating. Conversely, investors focused on companies with favorable income growth but caution on profitability might view Workday as a potential option, given its improving income but less efficient capital use.
Disclaimer: Investment carries a risk of loss of initial capital. The past performance is not a reliable indicator of future results. Be sure to understand risks before making an investment decision.
Go Further
I encourage you to read the complete analyses of Workday, Inc. and PTC Inc. to enhance your investment decisions: