In today’s dynamic tech landscape, Uber Technologies, Inc. and PTC Inc. stand out as innovators in the software application industry, yet they serve distinct markets. Uber revolutionizes mobility and delivery services globally, while PTC leads in industrial digital transformation and augmented reality solutions. Comparing these two companies offers valuable insights into different growth strategies and innovation models. Join me as we explore which presents the most compelling opportunity for your investment portfolio.
Table of contents
Companies Overview
I will begin the comparison between Uber Technologies, Inc. and PTC Inc. by providing an overview of these two companies and their main differences.
Uber Technologies, Inc. Overview
Uber Technologies, Inc. develops and operates proprietary technology applications across multiple regions including the US, Europe, Latin America, and Asia Pacific. Its mission is to connect consumers with independent providers for ridesharing, delivery, and freight services. Uber operates through three segments: Mobility, Delivery, and Freight, offering a diverse range of transportation and logistics solutions that leverage its platform.
PTC Inc. Overview
PTC Inc. is a software and services company focused on digital transformation for enterprises in the Americas, Europe, and Asia Pacific. The company offers platforms like ThingWorx for IoT, Vuforia for augmented reality, and Onshape for product development. Its products and services aim to enable innovation, collaboration, and lifecycle management, serving industries with advanced design and digital solutions.
Key similarities and differences
Both Uber and PTC operate in the technology sector, providing software-driven solutions globally. However, Uber’s business model centers on connecting consumers with service providers for mobility and delivery, emphasizing platform-based logistics. In contrast, PTC focuses on software products and professional services that facilitate enterprise digital transformation and product lifecycle management, targeting industrial and design applications. Their markets and customer bases differ significantly despite operating within tech.
Income Statement Comparison
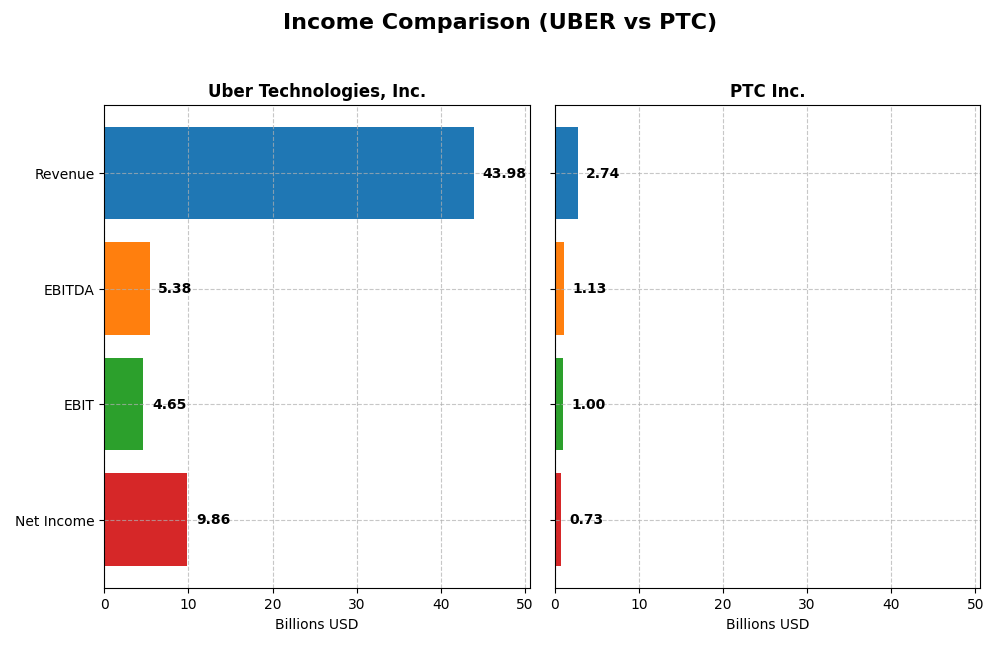
Below is a side-by-side comparison of the most recent fiscal year income statement metrics for Uber Technologies, Inc. and PTC Inc., highlighting key financial performance indicators.
| Metric | Uber Technologies, Inc. | PTC Inc. |
|---|---|---|
| Market Cap | 176.3B | 19.9B |
| Revenue | 43.98B | 2.74B |
| EBITDA | 5.39B | 1.13B |
| EBIT | 4.65B | 997M |
| Net Income | 9.86B | 734M |
| EPS | 4.71 | 6.18 |
| Fiscal Year | 2024 | 2025 |
Income Statement Interpretations
Uber Technologies, Inc.
Uber’s revenue demonstrated a strong upward trajectory from 2020 to 2024, growing from $11.1B to $44.0B. Net income shifted dramatically from a loss of $6.8B in 2020 to a profit of $9.9B in 2024, reflecting significant margin improvements. In 2024, Uber’s gross margin stood at 39.4% and net margin at 22.4%, supported by a 17.96% revenue growth and a remarkable 342.8% net margin increase, indicating robust operational leverage.
PTC Inc.
PTC’s revenue steadily increased from $1.8B in 2021 to $2.7B in 2025, with net income rising from $477M to $734M. The company maintained strong margins, including an 83.8% gross margin and a 26.8% net margin in 2025. Year-over-year growth was favorable across key metrics, including a 19.2% revenue increase and a 63.7% net margin improvement, while overall period net margin growth was neutral at 1.5%, suggesting stable profitability.
Which one has the stronger fundamentals?
Both companies exhibit favorable income statement fundamentals with consistent revenue and net income growth. Uber shows extraordinary margin recovery and expansion from losses to strong profitability, demonstrating high growth momentum. PTC maintains superior gross and EBIT margins with steady, less volatile growth. Uber’s rapid margin improvement contrasts with PTC’s stable profitability, reflecting different fundamental strengths.
Financial Ratios Comparison
The following table presents a side-by-side comparison of key financial ratios for Uber Technologies, Inc. and PTC Inc. based on their most recent fiscal year data.
| Ratios | Uber Technologies, Inc. (2024) | PTC Inc. (2025) |
|---|---|---|
| ROE | 45.7% | 19.2% |
| ROIC | 6.8% | 14.4% |
| P/E | 12.8 | 33.2 |
| P/B | 5.9 | 6.4 |
| Current Ratio | 1.07 | 1.12 |
| Quick Ratio | 1.07 | 1.12 |
| D/E | 0.53 | 0.36 |
| Debt-to-Assets | 22.3% | 20.7% |
| Interest Coverage | 5.35 | 12.76 |
| Asset Turnover | 0.86 | 0.41 |
| Fixed Asset Turnover | 14.1 | 15.6 |
| Payout ratio | 0 | 0 |
| Dividend yield | 0 | 0 |
Interpretation of the Ratios
Uber Technologies, Inc.
Uber shows a balanced mix of favorable and neutral ratios, including a strong net margin of 22.41% and an impressive ROE at 45.72%, highlighting efficient equity use. However, its high price-to-book ratio at 5.86 is unfavorable, indicating potential overvaluation concerns. The company does not pay dividends, reflecting a focus on reinvestment and growth rather than shareholder payouts.
PTC Inc.
PTC presents mostly favorable ratios, such as a high net margin of 26.8%, solid ROE at 19.18%, and a robust ROIC of 14.43%, suggesting effective capital allocation. Its elevated PE and PB ratios, 33.19 and 6.37 respectively, are less attractive, possibly indicating valuation risks. PTC also does not pay dividends, likely prioritizing innovation and growth investments over distributions.
Which one has the best ratios?
PTC exhibits a higher proportion of favorable ratios at 57.14% compared to Uber’s 50%, indicating stronger overall financial health. Uber benefits from superior profitability measures like ROE but faces valuation challenges similar to PTC. Both companies lack dividend payments, emphasizing growth, yet PTC’s higher ROIC and interest coverage suggest a more favorable risk-return profile.
Strategic Positioning
This section compares the strategic positioning of Uber and PTC, including market position, key segments, and exposure to technological disruption:
Uber Technologies, Inc.
- Large market cap of 176B, faces competitive pressure in global mobility and delivery sectors.
- Operates in Mobility, Delivery, and Freight segments, driving revenue from diverse transportation and delivery services.
- Exposure to disruption in mobility platforms and logistics technology, with growing technology programs and financial partnerships.
PTC Inc.
- Smaller market cap of 19.9B, competes in niche software and services markets globally.
- Focuses on Software Products and Professional Services, including CAD, PLM, AR, and lifecycle management solutions.
- Faces technological disruption through digital transformation platforms and AR, emphasizing scalable, innovative software solutions.
Uber vs PTC Positioning
Uber pursues a diversified approach with three broad segments in mobility and delivery services, offering scale advantages but facing high competition. PTC concentrates on specialized software and services, benefiting from focused innovation but with a narrower market scope.
Which has the best competitive advantage?
PTC demonstrates a very favorable economic moat with ROIC exceeding WACC and a growing profitability trend, indicating a durable competitive advantage. Uber shows a slightly unfavorable moat, shedding value despite improving profitability.
Stock Comparison
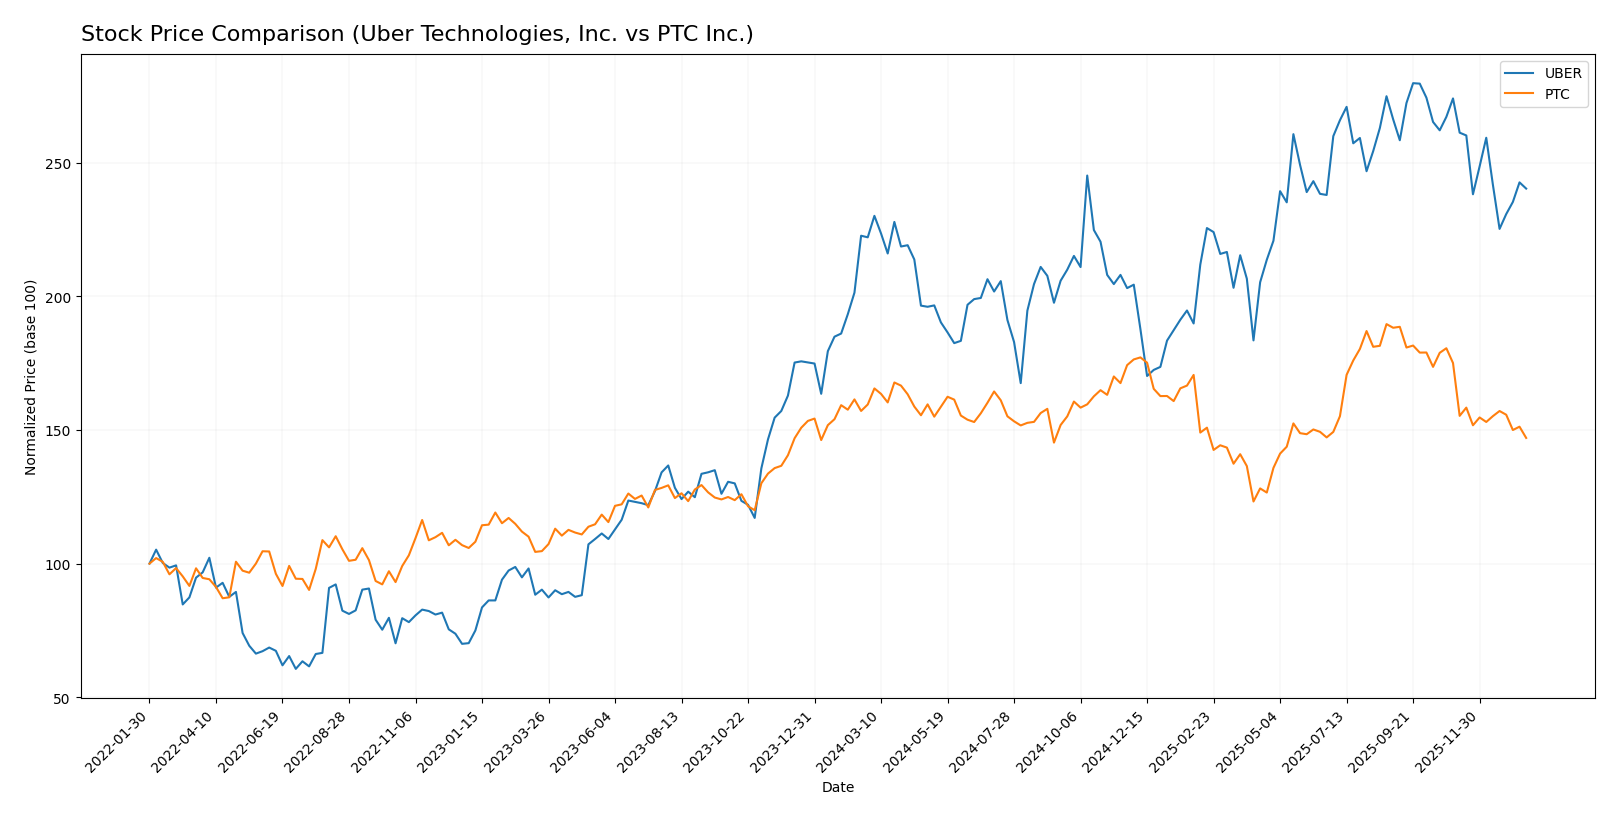
The stock prices of Uber Technologies, Inc. and PTC Inc. have shown distinct movements over the past 12 months, with Uber exhibiting a bullish trend amid decelerating gains, while PTC has faced a bearish trend with decelerating declines.
Trend Analysis
Uber Technologies, Inc. recorded an 8.21% price increase over the past year, reflecting a bullish trend with decelerating momentum. The stock ranged from a low of 58.99 to a high of 98.51, with volatility measured by a 10.29 standard deviation.
PTC Inc. experienced a -7.84% price decrease over the same period, indicating a bearish trend with decelerating losses. Its price fluctuated between 139.77 and 215.05, with a higher volatility standard deviation of 15.47.
Comparing both, Uber has delivered the highest market performance over the past year, outperforming PTC’s negative trend despite recent price declines for both stocks.
Target Prices
Analysts present a bullish consensus for both Uber Technologies, Inc. and PTC Inc., indicating potential upside from current prices.
| Company | Target High | Target Low | Consensus |
|---|---|---|---|
| Uber Technologies, Inc. | 140 | 73 | 111.26 |
| PTC Inc. | 255 | 120 | 213.25 |
The consensus target for Uber Technologies at 111.26 suggests approximately 31% upside versus the current price of 84.86 USD. PTC’s consensus target of 213.25 implies a significantly higher potential gain of about 28% from its current 166.75 USD price. Overall, analysts expect both stocks to appreciate in value.
Analyst Opinions Comparison
This section compares analysts’ ratings and grades for Uber Technologies, Inc. and PTC Inc.:
Rating Comparison
Uber Technologies, Inc. Rating
- Rating: B, evaluated as Very Favorable
- Discounted Cash Flow Score: 1, Very Unfavorable
- ROE Score: 5, Very Favorable
- ROA Score: 5, Very Favorable
- Debt To Equity Score: 2, Moderate
- Overall Score: 3, Moderate
PTC Inc. Rating
- Rating: B+, evaluated as Very Favorable
- Discounted Cash Flow Score: 4, Favorable
- ROE Score: 4, Favorable
- ROA Score: 5, Very Favorable
- Debt To Equity Score: 2, Moderate
- Overall Score: 3, Moderate
Which one is the best rated?
PTC holds a slightly better overall rating (B+ vs. B) with a stronger discounted cash flow score, while both companies share equal overall scores and similar debt to equity and ROA scores. Uber excels in ROE rating.
Scores Comparison
Here is a comparison of the Altman Z-Score and Piotroski Score for Uber and PTC:
Uber Scores
- Altman Z-Score: 4.44, in the safe zone indicating low bankruptcy risk.
- Piotroski Score: 6, considered average financial strength.
PTC Scores
- Altman Z-Score: 5.67, in the safe zone indicating low bankruptcy risk.
- Piotroski Score: 8, considered very strong financial strength.
Which company has the best scores?
PTC has higher scores on both the Altman Z-Score and Piotroski Score compared to Uber, indicating stronger financial stability and investment potential based strictly on these metrics.
Grades Comparison
Here is the detailed grades comparison for Uber Technologies, Inc. and PTC Inc.:
Uber Technologies, Inc. Grades
The following table shows the recent grades assigned by reputable grading companies for Uber Technologies, Inc.
| Grading Company | Action | New Grade | Date |
|---|---|---|---|
| BTIG | Maintain | Buy | 2026-01-15 |
| Wells Fargo | Maintain | Overweight | 2026-01-08 |
| Cantor Fitzgerald | Maintain | Overweight | 2026-01-08 |
| Wolfe Research | Maintain | Outperform | 2026-01-06 |
| Wedbush | Maintain | Neutral | 2025-12-19 |
| Morgan Stanley | Maintain | Overweight | 2025-12-08 |
| Arete Research | Upgrade | Buy | 2025-12-03 |
| Wells Fargo | Maintain | Overweight | 2025-11-05 |
| Guggenheim | Maintain | Buy | 2025-11-05 |
| DA Davidson | Maintain | Buy | 2025-11-05 |
Grades for Uber Technologies, Inc. mostly range from Buy to Overweight and Outperform, with a single Neutral rating, reflecting a generally positive rating trend.
PTC Inc. Grades
The table below summarizes recent grades by recognized grading firms for PTC Inc.
| Grading Company | Action | New Grade | Date |
|---|---|---|---|
| Piper Sandler | Maintain | Neutral | 2025-11-07 |
| Rosenblatt | Maintain | Buy | 2025-11-06 |
| Rosenblatt | Maintain | Buy | 2025-10-30 |
| Oppenheimer | Maintain | Outperform | 2025-07-31 |
| Rosenblatt | Maintain | Buy | 2025-07-31 |
| Barclays | Maintain | Overweight | 2025-07-31 |
| Stifel | Maintain | Buy | 2025-07-31 |
| Keybanc | Maintain | Overweight | 2025-07-31 |
| RBC Capital | Maintain | Outperform | 2025-07-31 |
| Piper Sandler | Maintain | Neutral | 2025-07-31 |
PTC Inc. grades show a strong presence of Buy, Overweight, and Outperform ratings, with some Neutral ratings, indicating a generally favorable consensus.
Which company has the best grades?
Both Uber and PTC have predominantly positive grades, but Uber shows more recent and consistent Buy and Overweight ratings from a wider range of firms, while PTC has some Neutral and Sell ratings. This suggests Uber may have slightly stronger analyst confidence, which could influence investor sentiment and portfolio decisions accordingly.
Strengths and Weaknesses
Below is a comparison of key strengths and weaknesses for Uber Technologies, Inc. and PTC Inc. based on the most recent data.
| Criterion | Uber Technologies, Inc. | PTC Inc. |
|---|---|---|
| Diversification | Strong with Mobility ($25B), Delivery ($13.75B), Freight ($5.14B) segments | Focused on software with License ($1.16B), Support & Cloud ($1.47B), and Technology Services ($0.11B) |
| Profitability | Moderate net margin (22.41%), ROIC (6.79%) below WACC (9.17%), value shedding but improving | Higher net margin (26.8%), ROIC (14.43%) well above WACC (8.35%), value creator with durable moat |
| Innovation | Growing ROIC trend suggests improving efficiency and innovation | Very favorable moat status with consistent ROIC growth, strong product development focus |
| Global presence | Significant global footprint in ride-sharing and delivery markets | Global software services presence but more niche compared to Uber |
| Market Share | Leading in mobility and delivery markets, but price-to-book ratio high (5.86) | Strong in industrial software, though higher P/E (33.19) and P/B (6.37) indicate premium valuation |
Key takeaways: Uber shows strong diversification and improving profitability but currently destroys value overall. PTC demonstrates a durable competitive advantage with higher profitability and more efficient capital use, though at a premium valuation. Investors should weigh Uber’s growth potential against PTC’s stable value creation.
Risk Analysis
Below is a comparative overview of key risks for Uber Technologies, Inc. and PTC Inc. based on the most recent data available for 2025-2026.
| Metric | Uber Technologies, Inc. | PTC Inc. |
|---|---|---|
| Market Risk | High beta (1.203), tech sector volatility | Moderate beta (1.014), niche software market |
| Debt level | Moderate debt-to-equity (0.53), manageable leverage | Low debt-to-equity (0.36), strong balance sheet |
| Regulatory Risk | Significant, due to global ridesharing and delivery regulations | Moderate, mainly software compliance and data privacy |
| Operational Risk | High, complex logistics and multi-segment operations | Moderate, focused on software development and services |
| Environmental Risk | Moderate, emissions and sustainability pressures in mobility | Low, limited direct environmental impact |
| Geopolitical Risk | Elevated, operates extensively worldwide including volatile regions | Moderate, global presence but less exposed to logistics disruptions |
Uber’s most impactful risks stem from regulatory challenges and geopolitical exposure given its global mobility and delivery operations. PTC faces lower operational and environmental risks but must navigate market competition and software innovation pressures. Both companies maintain solid financial health, with Uber’s moderate leverage and PTC’s strong balance sheet supporting risk resilience.
Which Stock to Choose?
Uber Technologies, Inc. has shown strong income growth with a favorable net margin of 22.41% and improving profitability metrics. Its financial ratios reveal a slightly favorable profile with a low debt-to-assets ratio of 22.32% and a strong return on equity of 45.72%, though the price-to-book ratio appears unfavorable. The company carries moderate debt and holds a very favorable rating of B.
PTC Inc. exhibits favorable income growth and robust profitability, with a net margin of 26.8% and a return on invested capital of 14.43%. Its financial ratios are largely favorable, including a low debt-to-assets ratio of 20.7% and strong interest coverage, despite higher price multiples. Debt levels are moderate, and the company is rated very favorably with a B+ score.
Investors seeking durable value creation and a strong economic moat might see PTC as more favorable due to its very favorable moat status and growing ROIC above WACC. Conversely, those focused on rapid profitability improvement and growth might interpret Uber’s increasing income and favorable margins as attractive, despite its slightly unfavorable moat. The choice could depend on an investor’s preference for value stability versus high growth potential.
Disclaimer: Investment carries a risk of loss of initial capital. The past performance is not a reliable indicator of future results. Be sure to understand risks before making an investment decision.
Go Further
I encourage you to read the complete analyses of Uber Technologies, Inc. and PTC Inc. to enhance your investment decisions: