In the dynamic world of software application providers, PTC Inc. and Tyler Technologies, Inc. stand out as influential players with distinct yet overlapping market focuses. PTC drives innovation through digital transformation and product lifecycle solutions, while Tyler specializes in integrated public sector software. Both companies emphasize scalable technology and cloud integration, appealing to investors seeking growth in tech-driven markets. This article will help you decide which company aligns best with your investment goals.
Table of contents
Companies Overview
I will begin the comparison between PTC Inc. and Tyler Technologies by providing an overview of these two companies and their main differences.
PTC Inc. Overview
PTC Inc. is a software and services company focused on enabling digital transformation across industries through its innovative platforms and products. Operating globally, it offers solutions like ThingWorx for IoT, Vuforia for augmented reality, and Onshape for product development, targeting enterprises seeking scalable technology to accelerate time to value. Headquartered in Boston, PTC emphasizes integration of design, lifecycle management, and service solutions within the technology sector.
Tyler Technologies Overview
Tyler Technologies provides integrated information management software and services tailored for the public sector, including government agencies and schools. Its offerings range from financial management and utility billing to judicial and public safety solutions. Based in Plano, Texas, Tyler operates three main segments and collaborates with Amazon Web Services for cloud hosting, focusing on automating and enhancing public sector operations through technology.
Key similarities and differences
Both companies operate in the software application industry with a focus on technology solutions but serve distinct markets: PTC targets industrial enterprises with digital transformation and product lifecycle tools, whereas Tyler specializes in public sector management software. While PTC’s portfolio emphasizes IoT, AR, and SaaS platforms for product development, Tyler concentrates on government and educational software with integrated management systems and cloud services. Their business models differ in customer base and product scope despite both emphasizing innovation and service delivery.
Income Statement Comparison
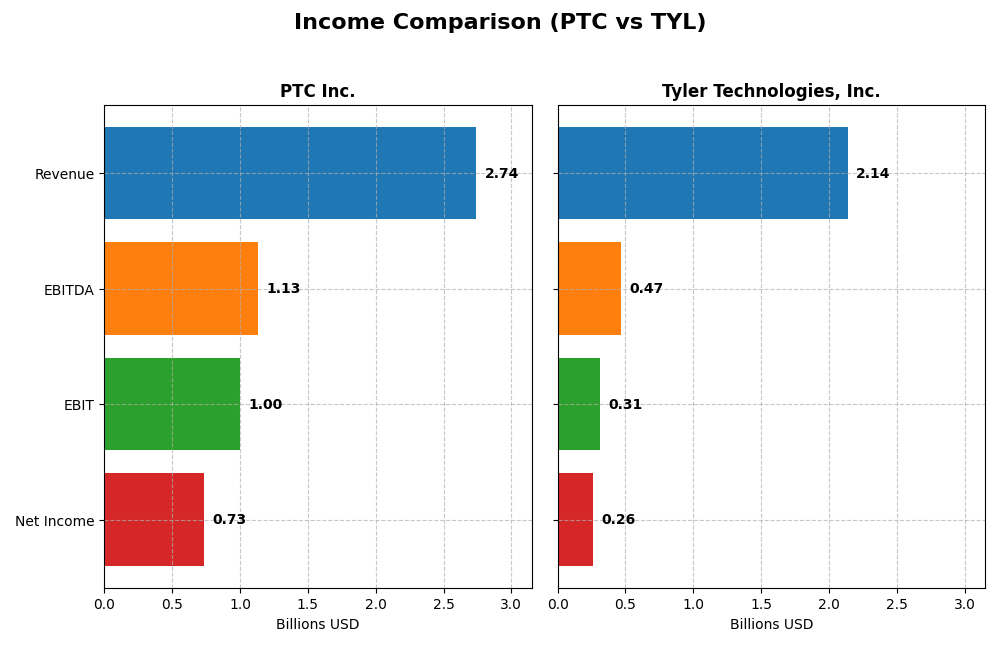
The table below presents a side-by-side comparison of key income statement metrics for PTC Inc. and Tyler Technologies, Inc. for their most recent fiscal years.
| Metric | PTC Inc. | Tyler Technologies, Inc. |
|---|---|---|
| Market Cap | 19.9B USD | 18.9B USD |
| Revenue | 2.74B USD | 2.14B USD |
| EBITDA | 1.13B USD | 466M USD |
| EBIT | 997M USD | 314M USD |
| Net Income | 734M USD | 263M USD |
| EPS | 6.18 USD | 6.17 USD |
| Fiscal Year | 2025 | 2024 |
Income Statement Interpretations
PTC Inc.
PTC Inc. showed strong revenue growth from $1.81B in 2021 to $2.74B in 2025, with net income rising from $477M to $734M over the same period. Margins remained robust, with a gross margin around 83.8% and a net margin near 27% in 2025. The latest year saw significant margin improvement and a 19.2% revenue increase, highlighting accelerating profitability.
Tyler Technologies, Inc.
Tyler Technologies grew revenue from $1.59B in 2021 to $2.14B in 2024, with net income increasing from $161M to $263M. Margins are stable but notably lower than PTC’s, with a gross margin near 41% and net margin at 12.3% in 2024. The most recent year reflected solid revenue growth of 9.5% and a 44.7% net margin increase, despite some margin contraction over the overall period.
Which one has the stronger fundamentals?
PTC’s fundamentals are marked by higher margins and stronger net income growth, with consistent margin expansion and near doubling of EPS over five years. Tyler also shows favorable growth but with lower margins and an unfavorable net margin trend overall. Both companies have positive income evaluations, yet PTC’s more pronounced profitability and margin strength suggest comparatively stronger fundamentals.
Financial Ratios Comparison
The following table compares key financial ratios for PTC Inc. and Tyler Technologies, Inc. based on their most recent fiscal year data.
| Ratios | PTC Inc. (2025) | Tyler Technologies, Inc. (2024) |
|---|---|---|
| ROE | 19.2% | 7.8% |
| ROIC | 14.4% | 6.2% |
| P/E | 33.2 | 93.4 |
| P/B | 6.37 | 7.25 |
| Current Ratio | 1.12 | 1.35 |
| Quick Ratio | 1.12 | 1.35 |
| D/E (Debt-to-Equity) | 0.36 | 0.19 |
| Debt-to-Assets | 20.7% | 12.3% |
| Interest Coverage | 12.8 | 50.5 |
| Asset Turnover | 0.41 | 0.41 |
| Fixed Asset Turnover | 15.6 | 11.0 |
| Payout Ratio | 0 | 0 |
| Dividend Yield | 0 | 0 |
Interpretation of the Ratios
PTC Inc.
PTC presents mostly favorable financial ratios, with strong net margin at 26.8% and return on equity at 19.18%, indicating efficient profitability and shareholder value creation. However, the high price-to-earnings ratio of 33.19 and price-to-book of 6.37 are less favorable, suggesting potential overvaluation. The company does not pay dividends, likely prioritizing reinvestment and growth.
Tyler Technologies, Inc.
Tyler Technologies shows mixed ratio results: a favorable net margin of 12.3% and excellent interest coverage at 52.96, but lower return on equity at 7.76% and a high price-to-earnings ratio of 93.42 raise concerns. Like PTC, Tyler does not distribute dividends, reflecting a focus on growth or reinvestment instead of shareholder payouts.
Which one has the best ratios?
PTC holds a more favorable overall ratio profile with 57.14% favorable metrics versus Tyler’s 50%, supported by stronger profitability and returns despite valuation concerns. Tyler’s lower returns and higher valuation ratios weigh on its profile, making PTC’s ratios comparatively stronger based on the latest fiscal data.
Strategic Positioning
This section compares the strategic positioning of PTC and Tyler Technologies, including market position, key segments, and exposure to technological disruption:
PTC
- Large software company with $19.9B market cap, operating globally in Americas, Europe, Asia Pacific.
- Key segments include Software Products and Professional Services, strong in digital transformation platforms and product lifecycle management.
- Offers innovative platforms like ThingWorx and Vuforia for AR, with cloud services and SaaS products.
Tyler Technologies
- $18.9B market cap focused on public sector software, primarily US-based with NYSE listing.
- Key segments cover Enterprise Software, Appraisal and Tax, and NIC, focused on public sector and government solutions.
- Collaborates with AWS for cloud hosting; offers integrated management and SaaS solutions for public agencies.
PTC vs Tyler Technologies Positioning
PTC has a diversified global software portfolio targeting digital transformation and product lifecycle management, while Tyler Technologies concentrates on US public sector software with integrated management systems. PTC’s international scope contrasts with Tyler’s specialized government focus.
Which has the best competitive advantage?
PTC demonstrates a very favorable moat with growing ROIC above WACC, indicating durable competitive advantage and increasing profitability. Tyler Technologies shows a very unfavorable moat with declining ROIC below WACC, signaling value destruction and decreasing profitability.
Stock Comparison
The stock prices of PTC Inc. and Tyler Technologies, Inc. have shown contrasting dynamics over the past year, with PTC experiencing a clear bearish trend and Tyler Technologies maintaining a slightly bullish yet decelerating trajectory.
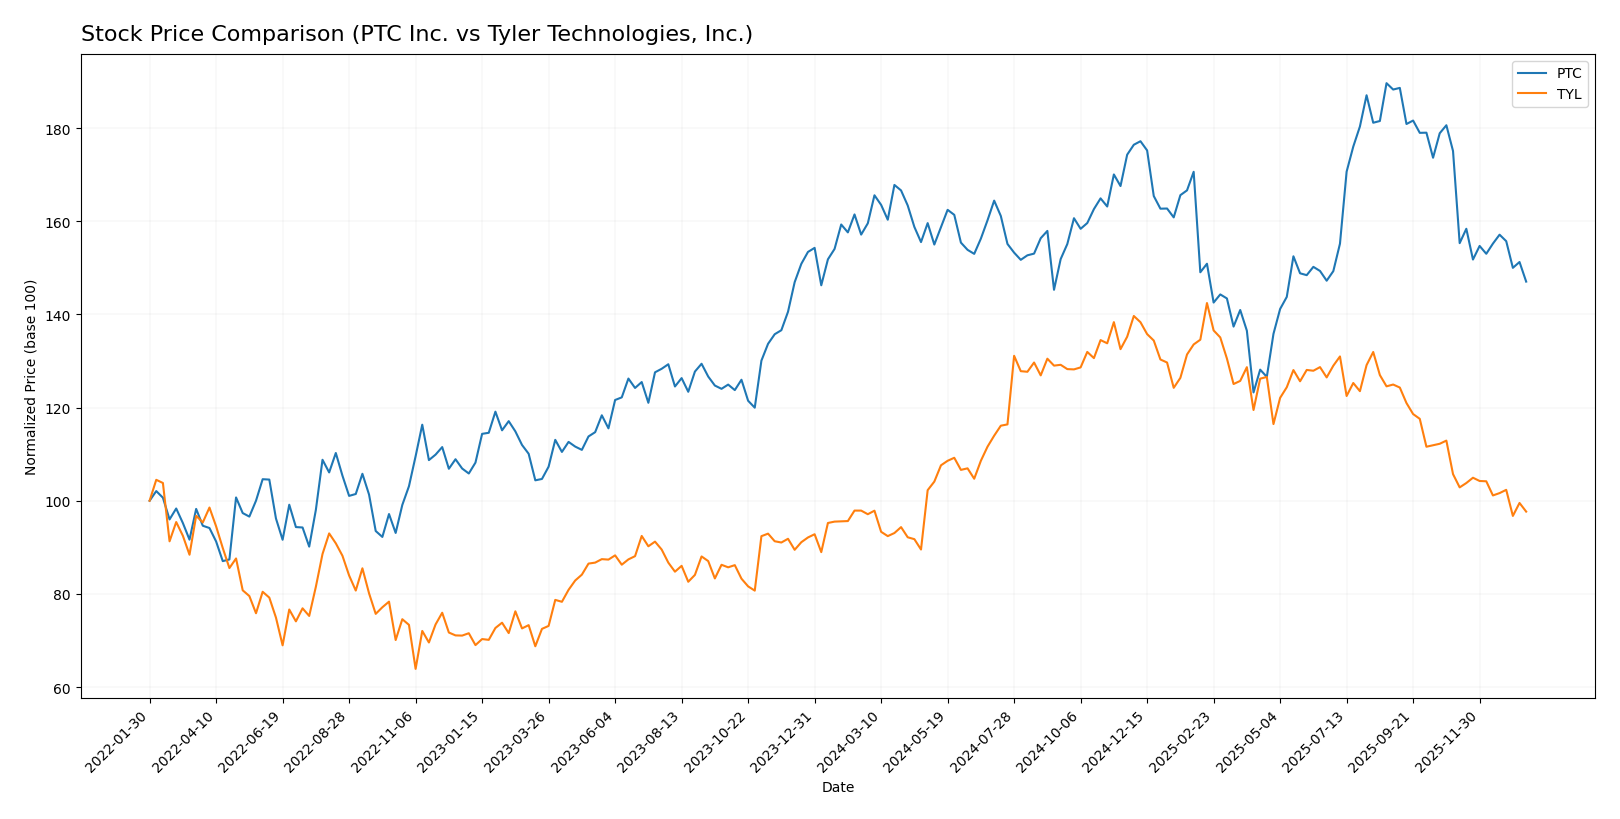
Trend Analysis
PTC Inc. recorded a -7.84% price change over the past 12 months, reflecting a bearish trend with deceleration. The stock ranged between a high of 215.05 and a low of 139.77, with notable volatility (std. dev. 15.47).
Tyler Technologies, Inc. posted a modest 0.58% increase over the same period, indicating a bullish but decelerating trend. Its price fluctuated between 641.7 and 403.35, with higher volatility (std. dev. 61.82).
Comparing the two, Tyler Technologies delivered the highest market performance with a slight positive return, while PTC showed a notable negative price change during the past year.
Target Prices
Analysts present a positive outlook for PTC Inc. and Tyler Technologies, Inc., with target consensus prices significantly above current trading levels.
| Company | Target High | Target Low | Consensus |
|---|---|---|---|
| PTC Inc. | 255 | 120 | 213.25 |
| Tyler Technologies, Inc. | 675 | 470 | 584 |
The consensus target price for PTC Inc. at 213.25 USD suggests upside potential from the current price of 166.75 USD, while Tyler Technologies, Inc.’s consensus of 584 USD also indicates substantial room for growth compared to its current price of 440.01 USD. Overall, analysts expect both stocks to appreciate notably.
Analyst Opinions Comparison
This section compares analysts’ ratings and grades for PTC Inc. and Tyler Technologies, Inc.:
Rating Comparison
PTC Rating
- Rating: B+ with a Very Favorable status, indicating strong overall analyst sentiment.
- Discounted Cash Flow Score: 4, Favorable, suggesting fair valuation based on future cash flows.
- ROE Score: 4, Favorable, showing efficient profit generation from shareholders’ equity.
- ROA Score: 5, Very Favorable, demonstrating excellent asset utilization to generate earnings.
- Debt To Equity Score: 2, Moderate, reflecting moderate financial risk from leverage.
- Overall Score: 3, Moderate, summarizing a balanced financial standing.
TYL Rating
- Rating: B with a Very Favorable status, reflecting positive but slightly lower sentiment.
- Discounted Cash Flow Score: 4, Favorable, indicating similarly fair valuation prospects.
- ROE Score: 3, Moderate, indicating average efficiency in profit generation.
- ROA Score: 4, Favorable, showing good but lower asset efficiency than PTC.
- Debt To Equity Score: 3, Moderate, indicating slightly higher leverage risk.
- Overall Score: 3, Moderate, reflecting a comparable overall financial assessment.
Which one is the best rated?
PTC holds a stronger rating at B+ compared to TYL’s B, with superior ROE and ROA scores and a slightly lower debt risk. Both have the same overall score, but PTC demonstrates better asset use and profitability metrics.
Scores Comparison
Here is a comparison of the key financial scores for PTC and Tyler Technologies, Inc.:
PTC Scores
- Altman Z-Score: 5.67, indicating a safe zone with low bankruptcy risk.
- Piotroski Score: 8, classified as very strong financial health.
TYL Scores
- Altman Z-Score: 7.42, indicating a safe zone with very low bankruptcy risk.
- Piotroski Score: 6, classified as average financial health.
Which company has the best scores?
TYL has a higher Altman Z-Score, suggesting stronger financial stability, while PTC has a higher Piotroski Score, indicating better overall financial strength. Each company excels in different score categories.
Grades Comparison
The following presents a comparison of the recent grades assigned to PTC Inc. and Tyler Technologies, Inc.:
PTC Inc. Grades
This table displays recent analyst grades for PTC Inc. from recognized grading companies.
| Grading Company | Action | New Grade | Date |
|---|---|---|---|
| Piper Sandler | Maintain | Neutral | 2025-11-07 |
| Rosenblatt | Maintain | Buy | 2025-11-06 |
| Rosenblatt | Maintain | Buy | 2025-10-30 |
| Oppenheimer | Maintain | Outperform | 2025-07-31 |
| Rosenblatt | Maintain | Buy | 2025-07-31 |
| Barclays | Maintain | Overweight | 2025-07-31 |
| Stifel | Maintain | Buy | 2025-07-31 |
| Keybanc | Maintain | Overweight | 2025-07-31 |
| RBC Capital | Maintain | Outperform | 2025-07-31 |
| Piper Sandler | Maintain | Neutral | 2025-07-31 |
Overall, PTC’s grades predominantly reflect positive analyst sentiment with consistent “Buy,” “Outperform,” and “Overweight” ratings, supported by a few “Neutral” opinions.
Tyler Technologies, Inc. Grades
Below is a summary of recent analyst grades for Tyler Technologies, Inc. from verified grading companies.
| Grading Company | Action | New Grade | Date |
|---|---|---|---|
| Piper Sandler | Maintain | Overweight | 2026-01-13 |
| Wells Fargo | Maintain | Equal Weight | 2026-01-08 |
| DA Davidson | Maintain | Neutral | 2025-12-09 |
| Evercore ISI Group | Maintain | In Line | 2025-10-31 |
| DA Davidson | Maintain | Neutral | 2025-10-31 |
| DA Davidson | Maintain | Neutral | 2025-10-10 |
| DA Davidson | Maintain | Neutral | 2025-08-05 |
| Barclays | Maintain | Overweight | 2025-07-31 |
| Needham | Maintain | Buy | 2025-05-13 |
| Barclays | Maintain | Overweight | 2025-04-25 |
Tyler Technologies’ grades show a mixed but generally positive outlook, centered around “Neutral,” “Overweight,” and “Buy” ratings, with some “Equal Weight” and “In Line” assessments.
Which company has the best grades?
Both PTC Inc. and Tyler Technologies, Inc. have received predominantly positive ratings, but PTC shows a stronger concentration of “Buy” and “Outperform” grades compared to Tyler’s more varied neutral and overweight ratings. This difference may influence investor confidence in PTC’s growth potential relative to Tyler.
Strengths and Weaknesses
Below is a comparison table summarizing the strengths and weaknesses of PTC Inc. (PTC) and Tyler Technologies, Inc. (TYL) based on their latest financial and strategic metrics.
| Criterion | PTC Inc. (PTC) | Tyler Technologies, Inc. (TYL) |
|---|---|---|
| Diversification | Strong diversification with License, Technology Service, and Support & Cloud Services segments contributing significantly | Moderate diversification across SaaS, Maintenance, Transaction Fees, Professional Services, and Hardware |
| Profitability | High net margin (26.8%) and strong ROE (19.18%), indicating solid profitability | Moderate net margin (12.3%) but lower ROE (7.76%), showing less efficient capital use |
| Innovation | Very favorable moat with growing ROIC (+42% trend), reflecting durable competitive advantage and innovation | Very unfavorable moat with declining ROIC (-26.5%), indicating challenges in maintaining innovation edge |
| Global presence | Well-established global footprint leveraging cloud and technology services | Primarily focused on the U.S. public sector, limiting global reach |
| Market Share | Strong market position with expanding cloud services and software licenses | Niche market leader in public sector software but limited expansion beyond core markets |
The key takeaway is that PTC demonstrates a very favorable competitive moat with strong profitability and global diversification, making it a compelling choice for investors seeking growth and innovation. In contrast, Tyler Technologies faces challenges with declining returns and a more concentrated market, which increases risk despite moderate profitability.
Risk Analysis
Below is a comparison of key risks for PTC Inc. and Tyler Technologies, Inc. based on the most recent data available in 2026.
| Metric | PTC Inc. | Tyler Technologies, Inc. |
|---|---|---|
| Market Risk | Beta 1.01, moderate market volatility exposure | Beta 0.92, slightly lower market sensitivity |
| Debt Level | Debt-to-Equity 0.36, moderate debt, manageable | Debt-to-Equity 0.19, low debt level, strong balance sheet |
| Regulatory Risk | Moderate, technology sector with evolving data/privacy laws | Moderate, public sector software with compliance demands |
| Operational Risk | Medium, reliance on innovation and SaaS platforms | Medium, integration complexity in public sector systems |
| Environmental Risk | Low, software company with limited direct impact | Low, similar low environmental footprint |
| Geopolitical Risk | Moderate, global operations exposed to international trade policies | Moderate, US-focused but impacted by federal IT budgets |
The most likely and impactful risks for these companies stem from market volatility and regulatory changes in technology and public sector software. PTC faces higher market sensitivity and moderate debt, while Tyler benefits from a stronger balance sheet but contends with a high P/E ratio indicating possible valuation risk. Both operate in dynamic regulatory environments requiring cautious monitoring.
Which Stock to Choose?
PTC Inc. shows a favorable income evolution with strong revenue and net income growth from 2021 to 2025. Its financial ratios are mostly favorable, including a 19.18% ROE and 14.43% ROIC, supported by low debt levels and a very favorable B+ rating. The company demonstrates high profitability and a very favorable economic moat with growing ROIC above WACC.
Tyler Technologies, Inc. has favorable income growth but with a less robust profitability profile, including a 7.76% ROE and 6.2% ROIC, and moderate debt levels. Its financial ratios are slightly favorable overall, with some unfavorable valuation metrics and a B rating. The company exhibits a very unfavorable moat due to declining ROIC below WACC, indicating value destruction.
Considering ratings and overall financial evaluations, PTC might appear more favorable for investors prioritizing durable profitability and quality investing, while Tyler Technologies could be more aligned with investors accepting moderate risk and seeking growth despite valuation concerns. This interpretation depends on individual risk tolerance and investment objectives.
Disclaimer: Investment carries a risk of loss of initial capital. The past performance is not a reliable indicator of future results. Be sure to understand risks before making an investment decision.
Go Further
I encourage you to read the complete analyses of PTC Inc. and Tyler Technologies, Inc. to enhance your investment decisions: