In the fast-evolving software industry, Strategy Inc and PTC Inc. stand out for their innovative approaches and market influence. Strategy Inc focuses on AI-powered analytics and Bitcoin exposure, while PTC Inc. excels in digital transformation and augmented reality solutions. Both cater to enterprise clients but with distinct technological strengths. This article will help you decide which company holds the most promise for your investment portfolio.
Table of contents
Companies Overview
I will begin the comparison between Strategy Inc and PTC Inc. by providing an overview of these two companies and their main differences.
Strategy Inc Overview
Strategy Inc, formerly MicroStrategy Incorporated until August 2025, operates as a bitcoin treasury company and software provider headquartered in Tysons Corner, Virginia. It offers investors exposure to Bitcoin through various securities and provides AI-powered enterprise analytics software like Strategy One and Strategy Mosaic. Founded in 1989, the company has 1,546 employees and a market cap of approximately 50B USD.
PTC Inc. Overview
PTC Inc., based in Boston, Massachusetts, is a software and services company operating globally with 7,512 employees. Founded in 1985, it provides a range of digital transformation solutions including the ThingWorx platform, Vuforia for augmented reality, and Onshape for product development. With a market cap near 20B USD, PTC focuses on product lifecycle management and application lifecycle management software.
Key similarities and differences
Both companies operate in the software application industry and are listed on the NASDAQ Global Select market. Strategy Inc emphasizes bitcoin treasury services combined with AI analytics, whereas PTC Inc. centers on digital transformation and product lifecycle management solutions. Strategy has a higher market capitalization and fewer employees, while PTC maintains a broader workforce and diversified software offerings in industrial and product design sectors.
Income Statement Comparison
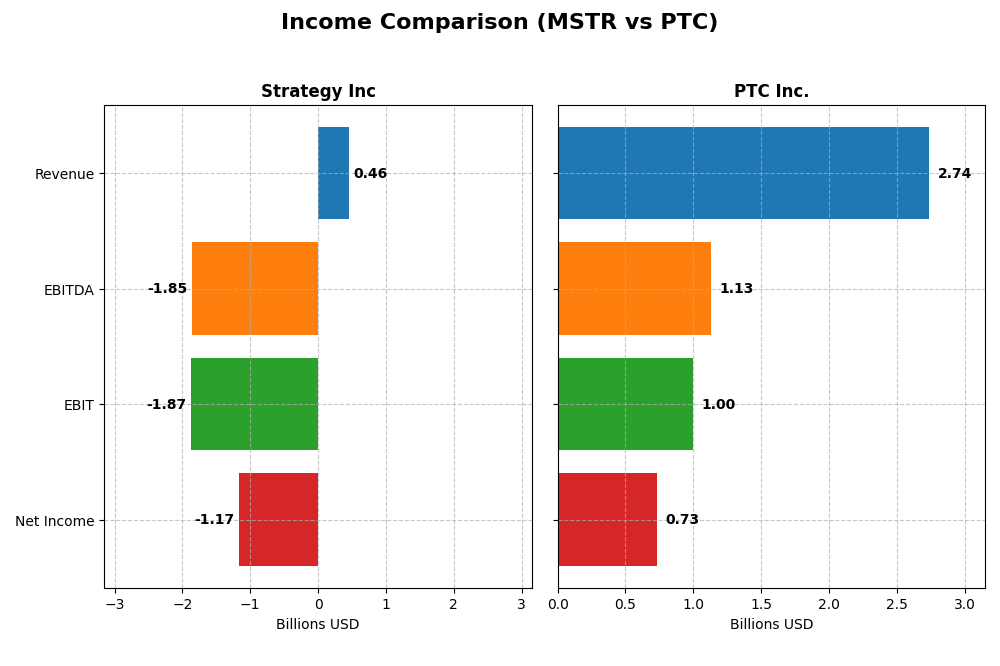
This table presents a side-by-side comparison of the latest annual income statement figures for Strategy Inc and PTC Inc., highlighting key financial metrics for the fiscal year 2024 and 2025 respectively.
| Metric | Strategy Inc (2024) | PTC Inc. (2025) |
|---|---|---|
| Market Cap | 50B | 19.9B |
| Revenue | 463M | 2.74B |
| EBITDA | -1.85B | 1.13B |
| EBIT | -1.87B | 997M |
| Net Income | -1.17B | 734M |
| EPS | -6.06 | 6.18 |
| Fiscal Year | 2024 | 2025 |
Income Statement Interpretations
Strategy Inc
Strategy Inc’s revenue showed a slight overall decline of 3.6% from 2020 to 2024, with a notable 6.6% drop in 2024 alone. Net income deteriorated sharply, turning negative in recent years with a net margin of -252% in 2024. Despite a stable gross margin around 72%, operating and net margins worsened significantly in 2024, reflecting increased costs and expenses.
PTC Inc.
PTC Inc. experienced consistent revenue growth, up 51.6% over 2021-2025, with a strong 19.2% increase in 2025. Net income followed suit, growing 53.9% overall and reaching a net margin of 26.8% in 2025. Margins improved steadily, supported by an 83.8% gross margin and enhanced EBIT margin at 36.4% in the latest year, signaling operational efficiency gains.
Which one has the stronger fundamentals?
PTC Inc. exhibits stronger fundamentals with consistent revenue and net income growth, alongside favorable margins and controlled interest expenses. In contrast, Strategy Inc. faces unfavorable trends, including declining revenue and substantial net losses, despite maintaining gross margin. The contrast highlights PTC’s more robust profitability and margin expansion compared to Strategy Inc.’s deteriorating financial performance.
Financial Ratios Comparison
The following table compares the key financial ratios for Strategy Inc and PTC Inc. based on their most recent fiscal year data, providing a snapshot of their operational efficiency, profitability, liquidity, and leverage.
| Ratios | Strategy Inc (2024) | PTC Inc. (2025) |
|---|---|---|
| ROE | -6.40% | 19.18% |
| ROIC | -4.38% | 14.43% |
| P/E | -47.80 | 33.19 |
| P/B | 3.06 | 6.37 |
| Current Ratio | 0.71 | 1.12 |
| Quick Ratio | 0.71 | 1.12 |
| D/E (Debt-to-Equity) | 0.40 | 0.36 |
| Debt-to-Assets | 28.09% | 20.70% |
| Interest Coverage | -29.92 | 12.76 |
| Asset Turnover | 0.018 | 0.414 |
| Fixed Asset Turnover | 5.73 | 15.58 |
| Payout Ratio | 0 | 0 |
| Dividend Yield | 0 | 0 |
Interpretation of the Ratios
Strategy Inc
Strategy Inc shows predominantly unfavorable financial ratios in 2024, including negative net margin (-251.73%) and return on equity (-6.4%), indicating profitability and efficiency challenges. The low current ratio (0.71) and negative interest coverage (-30.23) raise liquidity and solvency concerns. The company does not pay dividends, likely reflecting its ongoing investment in growth or bitcoin treasury operations.
PTC Inc.
PTC Inc. presents mostly favorable ratios for 2025, with a strong net margin of 26.8% and return on equity at 19.18%, signaling good profitability and capital management. Its liquidity appears sound with a current ratio of 1.12 and favorable interest coverage (12.95). Like Strategy Inc, PTC Inc. does not pay dividends, possibly prioritizing reinvestment and R&D initiatives.
Which one has the best ratios?
PTC Inc. demonstrates a more favorable overall ratio profile, with 57.14% favorable metrics compared to Strategy Inc’s 28.57%. PTC shows stronger profitability, liquidity, and coverage ratios, while Strategy Inc struggles with negative returns and liquidity constraints. This indicates PTC has comparatively better financial health based on provided ratios.
Strategic Positioning
This section compares the strategic positioning of Strategy Inc and PTC Inc., focusing on Market position, Key segments, and Exposure to technological disruption:
Strategy Inc
- Operates as bitcoin treasury and AI analytics software provider with high beta.
- Key segments include License, Maintenance, Subscription, and Technology Service.
- Exposure to disruption from bitcoin market volatility and evolving AI analytics.
PTC Inc.
- Software and services company with diverse global presence and moderate beta.
- Key segments include License, Support and Cloud Services, and Technology Service.
- Exposure through advanced AR, SaaS, PLM, CAD, and lifecycle management software innovations.
Strategy Inc vs PTC Inc. Positioning
Strategy Inc focuses on bitcoin exposure and AI-driven analytics, showing a more concentrated business model. PTC Inc. has a diversified software portfolio with broad enterprise solutions, supporting scalability and global reach but facing competitive software market pressures.
Which has the best competitive advantage?
PTC Inc. exhibits a very favorable moat with growing ROIC and value creation, indicating durable competitive advantage. Strategy Inc shows a very unfavorable moat with declining ROIC, suggesting value destruction and weaker competitive positioning.
Stock Comparison
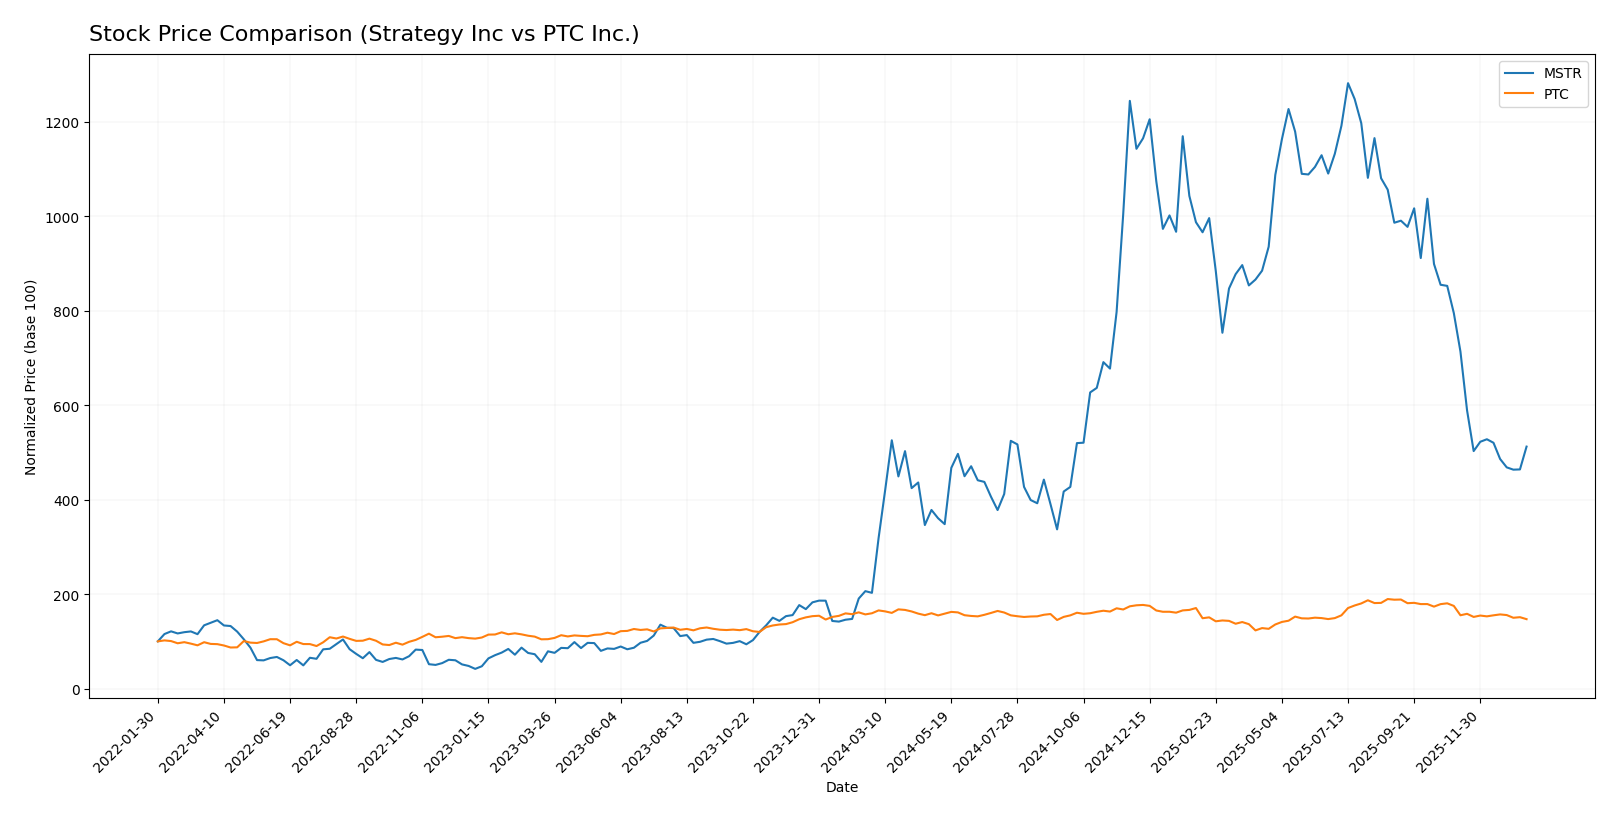
The stock price movements over the past 12 months reveal contrasting dynamics, with Strategy Inc exhibiting a strong overall bullish trend despite recent deceleration, while PTC Inc. shows a sustained bearish trajectory with moderate volatility.
Trend Analysis
Strategy Inc’s stock posted a 152.71% gain over the past year, indicating a bullish trend with decelerating momentum. The price ranged from 68.74 to 434.58, showing high volatility with a standard deviation of 103.09.
PTC Inc.’s stock declined by 7.84% over the same period, reflecting a bearish trend with deceleration. Price fluctuations were more contained, varying between 139.77 and 215.05, with a standard deviation of 15.47.
Comparing the two, Strategy Inc. delivered the highest market performance with a significant bullish trend, while PTC Inc. experienced a moderate bearish trend and lower volatility.
Target Prices
Analysts present a diverse but optimistic target consensus for Strategy Inc and PTC Inc.
| Company | Target High | Target Low | Consensus |
|---|---|---|---|
| Strategy Inc | 705 | 175 | 433.57 |
| PTC Inc. | 255 | 120 | 213.25 |
The consensus targets for both companies significantly exceed their current market prices, indicating overall analyst expectations for substantial appreciation potential in these technology stocks.
Analyst Opinions Comparison
This section compares analysts’ ratings and grades for Strategy Inc and PTC Inc.:
Rating Comparison
Strategy Inc Rating
- Rating: A- indicating a very favorable overall assessment.
- Discounted Cash Flow Score: 1, rated very unfavorable, suggesting potential overvaluation.
- ROE Score: 4, favorable, showing efficient profit generation from equity.
- ROA Score: 5, very favorable, reflecting excellent asset utilization.
- Debt To Equity Score: 3, moderate, indicating moderate financial risk.
- Overall Score: 4, favorable overall financial standing.
PTC Inc. Rating
- Rating: B+ also indicating a very favorable overall assessment.
- Discounted Cash Flow Score: 4, rated favorable, indicating better valuation prospects.
- ROE Score: 4, favorable, similarly efficient in generating equity profits.
- ROA Score: 5, very favorable, also demonstrating excellent asset utilization.
- Debt To Equity Score: 2, moderate but lower than Strategy Inc, suggesting slightly stronger balance sheet.
- Overall Score: 3, moderate overall financial standing.
Which one is the best rated?
Strategy Inc holds a higher overall score of 4 compared to PTC Inc’s 3 and has a superior rating of A- versus B+. However, PTC Inc. outperforms Strategy Inc. in discounted cash flow and debt-to-equity scores, indicating differences in valuation and financial risk profiles.
Scores Comparison
Here is a comparison of the financial health scores for Strategy Inc and PTC Inc.:
Strategy Inc Scores
- Altman Z-Score: 2.78, indicating moderate bankruptcy risk in the grey zone.
- Piotroski Score: 4, showing average financial strength.
PTC Inc. Scores
- Altman Z-Score: 5.67, indicating very low bankruptcy risk in the safe zone.
- Piotroski Score: 8, showing very strong financial strength.
Which company has the best scores?
Based on the provided data, PTC Inc. has superior scores with a higher Altman Z-Score in the safe zone and a very strong Piotroski score, compared to Strategy Inc’s moderate and average scores.
Grades Comparison
The grades assigned by reputable firms for Strategy Inc and PTC Inc. are as follows:
Strategy Inc Grades
The table below presents recent grades assigned to Strategy Inc by major grading companies.
| Grading Company | Action | New Grade | Date |
|---|---|---|---|
| Citigroup | Maintain | Buy | 2025-12-22 |
| Bernstein | Maintain | Outperform | 2025-12-08 |
| Monness, Crespi, Hardt | Upgrade | Neutral | 2025-11-10 |
| HC Wainwright & Co. | Maintain | Buy | 2025-11-03 |
| Canaccord Genuity | Maintain | Buy | 2025-11-03 |
| BTIG | Maintain | Buy | 2025-10-31 |
| TD Cowen | Maintain | Buy | 2025-10-31 |
| Cantor Fitzgerald | Maintain | Overweight | 2025-10-31 |
| Wells Fargo | Downgrade | Equal Weight | 2025-09-30 |
| TD Cowen | Maintain | Buy | 2025-09-16 |
Overall, Strategy Inc’s grades primarily indicate a Buy consensus with consistent support from multiple firms, though there is a noted downgrade to Equal Weight by Wells Fargo.
PTC Inc. Grades
Below is the recent grading data for PTC Inc. from recognized grading companies.
| Grading Company | Action | New Grade | Date |
|---|---|---|---|
| Piper Sandler | Maintain | Neutral | 2025-11-07 |
| Rosenblatt | Maintain | Buy | 2025-11-06 |
| Rosenblatt | Maintain | Buy | 2025-10-30 |
| Oppenheimer | Maintain | Outperform | 2025-07-31 |
| Rosenblatt | Maintain | Buy | 2025-07-31 |
| Barclays | Maintain | Overweight | 2025-07-31 |
| Stifel | Maintain | Buy | 2025-07-31 |
| Keybanc | Maintain | Overweight | 2025-07-31 |
| RBC Capital | Maintain | Outperform | 2025-07-31 |
| Piper Sandler | Maintain | Neutral | 2025-07-31 |
PTC Inc.’s grades consistently reflect a Buy or Outperform consensus, with some Neutral ratings, indicating stable analyst confidence.
Which company has the best grades?
Both Strategy Inc and PTC Inc. have predominantly Buy or Outperform grades from reputable firms, with no strong sell recommendations. PTC Inc. shows a slightly higher proportion of Outperform and Overweight ratings, potentially suggesting marginally stronger analyst confidence, which may influence investor sentiment towards growth expectations and risk assessment.
Strengths and Weaknesses
Below is a comparison of key strengths and weaknesses for Strategy Inc (MSTR) and PTC Inc. (PTC) based on recent financial data and competitive positioning.
| Criterion | Strategy Inc (MSTR) | PTC Inc. (PTC) |
|---|---|---|
| Diversification | Moderate; revenue spread across License (48.6M), Maintenance (244M), Subscription (107M), Tech Service (64M) | High; strong segments in License (1.16B), Support & Cloud Services (1.47B), and Tech Service (107M) |
| Profitability | Very weak; negative net margin (-251.7%), negative ROIC (-4.38%), shedding value | Strong; net margin 26.8%, ROIC 14.43%, creating value with growing profitability |
| Innovation | Limited recent growth; declining ROIC trend, value destroying | Robust innovation; growing ROIC (+42%), durable competitive advantage |
| Global presence | Smaller scale, less diversified geographically and product-wise | Large global footprint with diversified cloud and software offerings |
| Market Share | Declining; shrinking profitability and operational efficiency | Expanding market share supported by favorable financial ratios and segment growth |
Key takeaways: Strategy Inc is currently facing significant financial and operational challenges, reflected in its negative profitability and declining competitive moat. In contrast, PTC Inc shows strong financial health, diversified revenue streams, and a durable competitive advantage, making it a more attractive option for investors focused on sustainable growth and value creation.
Risk Analysis
Below is a comparison table of key risk metrics for Strategy Inc (MSTR) and PTC Inc. (PTC) based on the most recent financial data:
| Metric | Strategy Inc (MSTR) | PTC Inc. (PTC) |
|---|---|---|
| Market Risk | High beta 3.43, volatile price range (149.75-457.22) | Moderate beta 1.01, narrower price range (133.38-219.69) |
| Debt level | Moderate debt-to-assets 28.09%, debt/equity 0.4, interest coverage negative (-30.23) | Lower debt-to-assets 20.7%, debt/equity 0.36, strong interest coverage 12.95 |
| Regulatory Risk | Exposure to Bitcoin assets may invite regulatory scrutiny globally | Software industry regulatory risk moderate, focused on enterprise solutions |
| Operational Risk | Negative net margin (-251.73%), low asset turnover (0.02), liquidity concerns (current ratio 0.71) | Positive net margin (26.8%), decent asset turnover (0.41), better liquidity (current ratio 1.12) |
| Environmental Risk | Moderate, as software company with limited direct impact | Moderate, similar profile with software and services focus |
| Geopolitical Risk | Global bitcoin exposure increases sensitivity to geopolitical events | Global operations but less exposed to volatile asset classes |
The most impactful risks for Strategy Inc are its high market volatility due to Bitcoin exposure and weak operational metrics including negative profitability and poor liquidity, which may signal financial distress despite a favorable overall rating. PTC Inc. shows healthier financial stability with moderate debt levels, solid profitability, and strong bankruptcy risk scores, making its risks more manageable for investors.
Which Stock to Choose?
Strategy Inc (MSTR) shows a declining income trend with unfavorable profitability and negative returns on equity and invested capital. Its financial ratios are mostly unfavorable, though debt levels remain moderate, and it holds a very favorable overall rating.
PTC Inc. (PTC) demonstrates strong income growth and profitability with favorable net margin and ROE. Financial ratios are largely favorable, supported by efficient capital use and moderate debt. Its rating is also very favorable, reflecting solid financial health.
For risk-tolerant investors seeking growth, PTC may appear more attractive given its favorable income and ratio trends alongside a durable competitive advantage. Conversely, more cautious investors might view Strategy Inc’s very favorable rating despite income challenges as a different profile consideration.
Disclaimer: Investment carries a risk of loss of initial capital. The past performance is not a reliable indicator of future results. Be sure to understand risks before making an investment decision.
Go Further
I encourage you to read the complete analyses of Strategy Inc and PTC Inc. to enhance your investment decisions: