Snowflake Inc. and PTC Inc. are two prominent players in the software application industry, each driving innovation in cloud data platforms and digital transformation tools, respectively. While Snowflake specializes in cloud-based data consolidation and analytics, PTC focuses on product lifecycle management and augmented reality solutions. This comparison highlights their market positioning and growth strategies to help you decide which company stands out as a compelling investment opportunity in 2026.
Table of contents
Companies Overview
I will begin the comparison between Snowflake Inc. and PTC Inc. by providing an overview of these two companies and their main differences.
Snowflake Inc. Overview
Snowflake Inc. provides a cloud-based data platform designed to consolidate data into a single source of truth. Its Data Cloud platform enables customers to generate business insights, build data-driven applications, and share data across industries. Incorporated in 2012 and headquartered in Bozeman, Montana, Snowflake has positioned itself as a key player in the software application sector with a market cap of approximately 70.4B USD.
PTC Inc. Overview
PTC Inc. operates as a software and services provider focused on digital transformation solutions. Its offerings include platforms such as ThingWorx for IoT, Vuforia for augmented reality, and Onshape for SaaS product development. Founded in 1985 and based in Boston, Massachusetts, PTC serves global markets with a range of product lifecycle management and application lifecycle management tools, holding a market cap near 19.9B USD.
Key similarities and differences
Both Snowflake and PTC operate within the software application industry, emphasizing innovative technology solutions. Snowflake focuses on cloud data consolidation for analytics, while PTC emphasizes digital transformation through IoT, AR, and product development platforms. Snowflake’s business centers on data cloud services, whereas PTC’s model includes software products combined with professional services, reflecting a broader service scope.
Income Statement Comparison
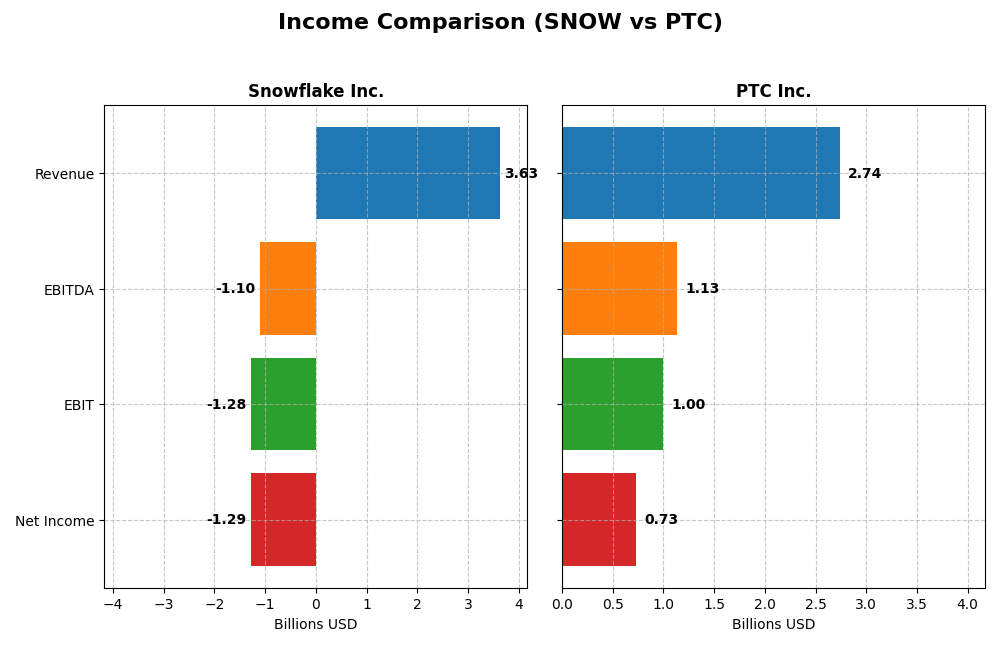
The following table compares key income statement metrics for Snowflake Inc. and PTC Inc. for their most recent fiscal years, highlighting differences in scale and profitability.
| Metric | Snowflake Inc. (SNOW) | PTC Inc. (PTC) |
|---|---|---|
| Market Cap | 70.4B | 19.9B |
| Revenue | 3.63B | 2.74B |
| EBITDA | -1.10B | 1.13B |
| EBIT | -1.28B | 997M |
| Net Income | -1.29B | 734M |
| EPS | -3.86 | 6.18 |
| Fiscal Year | 2025 | 2025 |
Income Statement Interpretations
Snowflake Inc.
Snowflake’s revenue surged from $592M in 2021 to $3.63B in 2025, reflecting strong growth, while net income remained negative, widening from -$539M to -$1.29B. Gross margins stayed favorable at 66.5%, but EBIT and net margins were negative, indicating operating losses. The 2025 year showed a significant revenue increase of 29.2%, yet EBIT declined by 51%, signaling profitability challenges despite top-line growth.
PTC Inc.
PTC’s revenue increased from $1.81B in 2021 to $2.74B in 2025, with net income rising from $477M to $734M. Margins improved consistently: gross margin was 83.8%, EBIT margin 36.4%, and net margin 26.8% in 2025. The latest year showed solid revenue growth of 19.2%, with EBIT up 69.4% and net margin growth of 63.7%, indicating enhanced operational efficiency and profitability.
Which one has the stronger fundamentals?
PTC demonstrates stronger fundamentals with consistently positive and improving margins, substantial net income growth, and favorable profitability metrics. Snowflake, despite robust revenue expansion, struggles with persistent operating losses and negative net margins, reflecting ongoing challenges in achieving profitability. Overall, PTC’s financials suggest more stable and favorable income statement performance.
Financial Ratios Comparison
The table below presents the most recent financial ratios for Snowflake Inc. and PTC Inc., reflecting their fiscal year 2025 performance to facilitate a direct comparison.
| Ratios | Snowflake Inc. (SNOW) | PTC Inc. (PTC) |
|---|---|---|
| ROE | -42.9% | 19.2% |
| ROIC | -25.2% | 14.4% |
| P/E | -47.0 | 33.2 |
| P/B | 20.1 | 6.37 |
| Current Ratio | 1.75 | 1.12 |
| Quick Ratio | 1.75 | 1.12 |
| D/E | 0.90 | 0.36 |
| Debt-to-Assets | 29.7% | 20.7% |
| Interest Coverage | -527.7 | 12.8 |
| Asset Turnover | 0.40 | 0.41 |
| Fixed Asset Turnover | 5.53 | 15.6 |
| Payout ratio | 0 | 0 |
| Dividend yield | 0 | 0 |
Interpretation of the Ratios
Snowflake Inc.
Snowflake’s financial ratios reveal significant weaknesses, with unfavorable net margin (-35.45%), return on equity (-42.86%), and return on invested capital (-25.24%). The company’s liquidity ratios, such as current and quick ratios at 1.75, are favorable, but high price-to-book (20.13) and poor interest coverage raise concerns. Snowflake does not pay dividends, reflecting a reinvestment strategy typical for high-growth companies prioritizing R&D and platform expansion.
PTC Inc.
PTC shows mostly strong ratios, including favorable net margin (26.8%), return on equity (19.18%), and return on invested capital (14.43%). Liquidity is stable with a quick ratio of 1.12, and low debt levels enhance financial health. The downside includes an unfavorable price-to-earnings ratio (33.19) and price-to-book (6.37). Like Snowflake, PTC does not pay dividends, likely investing in innovation and growth initiatives instead.
Which one has the best ratios?
PTC exhibits a more favorable overall ratio profile, with 57.14% favorable metrics compared to Snowflake’s 35.71%. PTC’s stronger profitability, solid interest coverage, and better leverage metrics outweigh its valuation concerns. Snowflake’s higher liquidity is positive but overshadowed by its negative returns and weak profitability, making PTC’s ratios comparatively better.
Strategic Positioning
This section compares the strategic positioning of Snowflake Inc. and PTC Inc., focusing on market position, key segments, and exposure to technological disruption:
Snowflake Inc.
- Leading cloud-based data platform provider with significant market cap and global use.
- Revenue driven mainly by cloud data platform products and professional services.
- Operates in cloud data management, with no explicit mention of disruption threats.
PTC Inc.
- Established software and services company with diversified solutions across multiple regions.
- Revenue diversified across licenses, technology services, and cloud support services.
- Offers innovative platforms including AR and SaaS, indicating active adaptation to technology trends.
Snowflake Inc. vs PTC Inc. Positioning
Snowflake focuses on a concentrated cloud data platform strategy, while PTC adopts a diversified approach across software products and services. Snowflake benefits from a clear market niche; PTC offers broad enterprise solutions, balancing innovation and service variety.
Which has the best competitive advantage?
PTC exhibits a very favorable moat with growing ROIC and value creation, indicating durable competitive advantage. Snowflake shows a very unfavorable moat with declining ROIC, reflecting value destruction and weaker competitive positioning.
Stock Comparison
The past year has seen both Snowflake Inc. and PTC Inc. experience bearish stock trends with notable price declines and decelerating momentum, reflecting challenges in maintaining upward price movement amid varying trading volumes.

Trend Analysis
Snowflake Inc. shows a bearish trend over the last 12 months with a price decline of -8.27% and deceleration, hitting a high of 274.88 and a low of 108.56, with significant volatility (42.6 std deviation).
PTC Inc. also follows a bearish trend, with a -7.84% price decrease and deceleration over the same period, peaking at 215.05 and bottoming at 139.77, but with lower volatility (15.47 std deviation).
Comparing the two, Snowflake’s stock delivered a slightly larger negative return than PTC, indicating PTC had the relatively better market performance over the analyzed year.
Target Prices
Analysts provide a positive outlook with clear target price ranges for Snowflake Inc. and PTC Inc.
| Company | Target High | Target Low | Consensus |
|---|---|---|---|
| Snowflake Inc. | 325 | 237 | 281.86 |
| PTC Inc. | 255 | 120 | 213.25 |
Snowflake’s consensus target price at 281.86 USD exceeds its current price of 210.38 USD, indicating upside potential. PTC’s target consensus of 213.25 USD similarly suggests room for growth from its current 166.75 USD.
Analyst Opinions Comparison
This section compares analysts’ ratings and financial grades for Snowflake Inc. and PTC Inc.:
Rating Comparison
Snowflake Inc. Rating
- Rating: C- (Very Favorable)
- Discounted Cash Flow Score: 3 (Moderate)
- ROE Score: 1 (Very Unfavorable)
- ROA Score: 1 (Very Unfavorable)
- Debt To Equity Score: 1 (Very Unfavorable)
- Overall Score: 1 (Very Unfavorable)
PTC Inc. Rating
- Rating: B+ (Very Favorable)
- Discounted Cash Flow Score: 4 (Favorable)
- ROE Score: 4 (Favorable)
- ROA Score: 5 (Very Favorable)
- Debt To Equity Score: 2 (Moderate)
- Overall Score: 3 (Moderate)
Which one is the best rated?
Based strictly on the provided data, PTC Inc. has higher ratings across all key financial metrics compared to Snowflake Inc., resulting in a better overall score and more favorable analyst evaluations.
Scores Comparison
The scores comparison between Snowflake Inc. and PTC Inc. highlights their financial health and bankruptcy risk:
Snowflake Inc. Scores
- Altman Z-Score: 5.36, indicating a safe zone with low bankruptcy risk.
- Piotroski Score: 4, reflecting average financial strength.
PTC Inc. Scores
- Altman Z-Score: 5.67, indicating a safe zone with low bankruptcy risk.
- Piotroski Score: 8, reflecting very strong financial strength.
Which company has the best scores?
PTC Inc. shows marginally better Altman Z-Score, both in the safe zone, and significantly higher Piotroski Score, indicating stronger financial health compared to Snowflake Inc.
Grades Comparison
Here is a detailed comparison of recent grades assigned to Snowflake Inc. and PTC Inc.:
Snowflake Inc. Grades
The following table summarizes recent official analyst grades for Snowflake Inc.:
| Grading Company | Action | New Grade | Date |
|---|---|---|---|
| Barclays | Downgrade | Equal Weight | 2026-01-12 |
| Argus Research | Upgrade | Buy | 2026-01-08 |
| Citigroup | Maintain | Buy | 2025-12-08 |
| Wells Fargo | Maintain | Overweight | 2025-12-04 |
| Keybanc | Maintain | Overweight | 2025-12-04 |
| Piper Sandler | Maintain | Overweight | 2025-12-04 |
| Morgan Stanley | Maintain | Overweight | 2025-12-04 |
| Wedbush | Maintain | Outperform | 2025-12-04 |
| Deutsche Bank | Maintain | Buy | 2025-12-04 |
| Cantor Fitzgerald | Maintain | Overweight | 2025-12-04 |
Snowflake’s grades mostly reflect a positive outlook, with a majority rated as Overweight or Buy, though Barclays recently downgraded it to Equal Weight.
PTC Inc. Grades
The following table contains recent official analyst grades for PTC Inc.:
| Grading Company | Action | New Grade | Date |
|---|---|---|---|
| Piper Sandler | Maintain | Neutral | 2025-11-07 |
| Rosenblatt | Maintain | Buy | 2025-11-06 |
| Rosenblatt | Maintain | Buy | 2025-10-30 |
| Oppenheimer | Maintain | Outperform | 2025-07-31 |
| Rosenblatt | Maintain | Buy | 2025-07-31 |
| Barclays | Maintain | Overweight | 2025-07-31 |
| Stifel | Maintain | Buy | 2025-07-31 |
| Keybanc | Maintain | Overweight | 2025-07-31 |
| RBC Capital | Maintain | Outperform | 2025-07-31 |
| Piper Sandler | Maintain | Neutral | 2025-07-31 |
PTC’s grades indicate a generally favorable rating, dominated by Buy and Outperform recommendations, with some Neutral positions.
Which company has the best grades?
Both Snowflake Inc. and PTC Inc. hold a consensus “Buy” rating with a strong representation of Buy and Overweight grades. Snowflake shows a more recent downgrade by Barclays but maintains a majority of Overweight and Buy ratings. PTC’s ratings are stable with multiple Outperform and Buy grades but also include Neutral ratings. Investors may view Snowflake as slightly more positively graded overall, reflecting potentially higher confidence among analysts.
Strengths and Weaknesses
Below is a comparison table highlighting key strengths and weaknesses of Snowflake Inc. (SNOW) and PTC Inc. (PTC) based on the latest financial and strategic data from 2025.
| Criterion | Snowflake Inc. (SNOW) | PTC Inc. (PTC) |
|---|---|---|
| Diversification | Moderate, focused on product and professional services with rapid revenue growth in products (3.46B USD) | Well diversified across License, Technology Service, and Support & Cloud Services (total ~2.7B USD) |
| Profitability | Negative net margin (-35.45%), negative ROE (-42.86%), and ROIC (-25.24%), value destroying | Positive net margin (26.8%), ROE (19.18%), and ROIC (14.43%), value creating with growing profitability |
| Innovation | Strong product innovation but struggling to convert into profits | Consistent investment in innovation supporting license and cloud services growth |
| Global presence | Strong cloud data platform presence globally but facing margin pressures | Established global footprint with expanding cloud services and license base |
| Market Share | Rapidly growing but challenged by profitability and competitive pressure | Stable market share with durable competitive advantage reflected in positive ROIC vs WACC |
Key takeaways: PTC stands out as a financially healthier and value-creating company with solid profitability and diversification. Snowflake shows strong growth and innovation but currently suffers from declining profitability and value destruction, warranting cautious risk management for investors.
Risk Analysis
Below is a comparative table outlining key risks for Snowflake Inc. and PTC Inc. based on the most recent 2025 data.
| Metric | Snowflake Inc. (SNOW) | PTC Inc. (PTC) |
|---|---|---|
| Market Risk | Beta 1.144, moderate volatility | Beta 1.014, lower volatility |
| Debt level | Debt/Equity 0.9 (neutral) | Debt/Equity 0.36 (favorable) |
| Regulatory Risk | Moderate, US-centric cloud regulations | Moderate, global software regulations |
| Operational Risk | High, negative net margin and ROE | Moderate, positive profitability and ROE |
| Environmental Risk | Low, primarily software sector | Low, primarily software sector |
| Geopolitical Risk | Moderate, international presence | Moderate, international presence |
The most significant risks for Snowflake lie in its operational performance, indicated by negative profitability and returns, which could impact cash flow stability. PTC shows stronger financial health and lower leverage, mitigating debt risks. Market volatility is slightly higher for Snowflake, which investors should monitor closely.
Which Stock to Choose?
Snowflake Inc. (SNOW) shows strong revenue growth of 29.2% in 2025 but suffers from significant profitability challenges, with negative net margin (-35.45%) and declining ROIC (-25.24%). Its debt level is moderate with a 0.9 debt-to-equity ratio, and its rating is very favorable overall despite some unfavorable financial ratios.
PTC Inc. (PTC) demonstrates solid income growth at 19.2% in 2025 and favorable profitability metrics, including a positive net margin of 26.8% and improving ROIC at 14.43%. The company maintains low financial leverage with a 0.36 debt-to-equity ratio and holds a very favorable rating supported by strong financial ratios and credit scores.
For investors, PTC may appear more favorable due to its consistent value creation, positive ROIC trend, and stronger profitability ratios. Conversely, SNOW’s rapid revenue expansion but unfavorable profitability and declining capital efficiency might suggest it suits investors prioritizing growth with higher risk tolerance.
Disclaimer: Investment carries a risk of loss of initial capital. The past performance is not a reliable indicator of future results. Be sure to understand risks before making an investment decision.
Go Further
I encourage you to read the complete analyses of Snowflake Inc. and PTC Inc. to enhance your investment decisions: