In today’s competitive technology landscape, Salesforce, Inc. (CRM) and PTC Inc. (PTC) stand out as leaders in the software application industry, each driving innovation in customer engagement and digital transformation. Salesforce excels in customer relationship management and cloud-based platforms, while PTC focuses on product lifecycle and augmented reality solutions. This article will explore their strengths and challenges to help you decide which company fits best in your investment portfolio.
Table of contents
Companies Overview
I will begin the comparison between Salesforce, Inc. and PTC Inc. by providing an overview of these two companies and their main differences.
Salesforce Overview
Salesforce, Inc. is a leading provider of customer relationship management technology, aiming to connect companies and customers globally. Its Customer 360 platform offers tools for sales, service, marketing, commerce, and analytics, enhancing customer experiences across various industries. Headquartered in San Francisco, Salesforce employs over 76K people and operates through direct sales and partner networks.
PTC Overview
PTC Inc. is a software and services company focused on digital transformation solutions, including platforms for product development, lifecycle management, and augmented reality. Its offerings such as ThingWorx, Onshape, and Creo target enterprises seeking innovation and efficiency. Based in Boston, PTC has about 7.5K employees and serves customers worldwide through software products and professional services.
Key similarities and differences
Both Salesforce and PTC operate in the software application industry within the technology sector in the US, focusing on enterprise solutions. Salesforce emphasizes customer relationship management and engagement platforms, while PTC specializes in product development, lifecycle management, and augmented reality technologies. Salesforce is notably larger with a market cap exceeding $218B compared to PTC’s $19.7B, reflecting differing scales and market focuses.
Income Statement Comparison
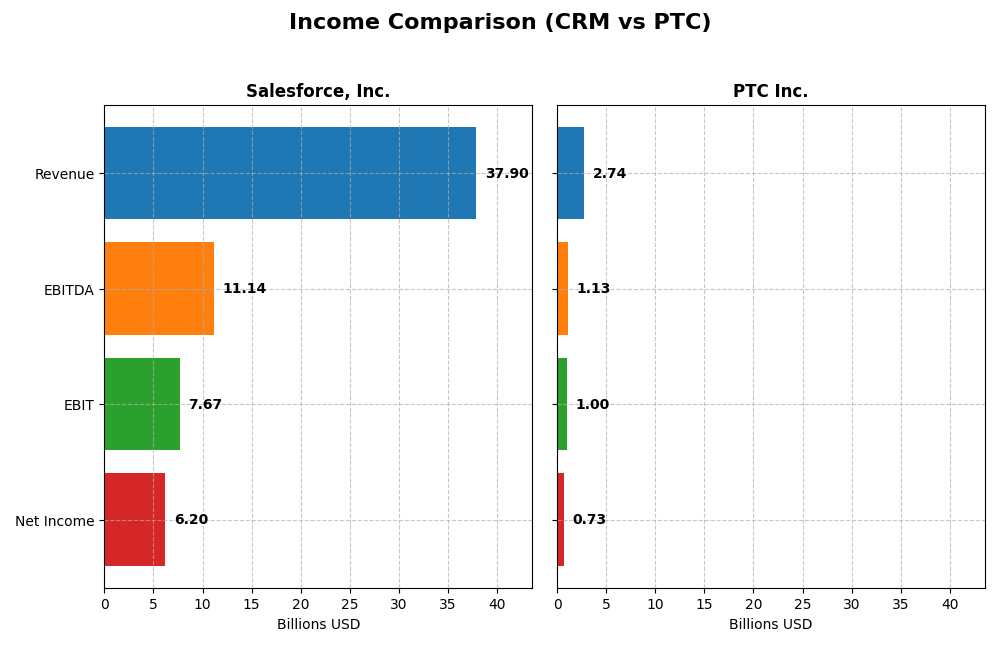
The table below presents a side-by-side comparison of the key income statement metrics for Salesforce, Inc. and PTC Inc. for their most recent fiscal year, providing a clear snapshot of their financial performance.
| Metric | Salesforce, Inc. (CRM) | PTC Inc. (PTC) |
|---|---|---|
| Market Cap | 218.5B | 19.7B |
| Revenue | 37.9B | 2.74B |
| EBITDA | 11.1B | 1.13B |
| EBIT | 7.67B | 997M |
| Net Income | 6.20B | 734M |
| EPS | 6.44 | 6.18 |
| Fiscal Year | 2025 | 2025 |
Income Statement Interpretations
Salesforce, Inc.
Salesforce’s revenue and net income have shown strong upward trends from 2021 to 2025, with revenue rising from 21.3B to 37.9B and net income increasing from 4.07B to 6.2B. Margins generally remained favorable, though net margin declined slightly over the period. The latest year showed solid growth with revenue up 8.7%, net income up 37.8%, and improved EBIT margin at 20.2%.
PTC Inc.
PTC demonstrated consistent growth in revenue and net income, with revenues increasing from 1.81B in 2021 to 2.74B in 2025 and net income rising from 477M to 734M. Margins remained robust, notably a high gross margin near 83.8% and a strong EBIT margin of 36.4%. The most recent year saw an impressive 19.2% revenue growth and a 63.7% increase in net margin.
Which one has the stronger fundamentals?
Both companies exhibit favorable income statement fundamentals, with Salesforce showing higher absolute revenue and net income growth but a slight net margin compression. PTC presents stronger margin profiles and faster margin expansion, along with solid revenue and net income growth. Salesforce’s scale contrasts with PTC’s margin efficiency, making each strong in different financial aspects.
Financial Ratios Comparison
This table compares key financial ratios for Salesforce, Inc. (CRM) and PTC Inc. (PTC) based on their most recent fiscal year data, providing a snapshot of their financial performance and stability.
| Ratios | Salesforce, Inc. (CRM) FY 2025 | PTC Inc. (PTC) FY 2025 |
|---|---|---|
| ROE | 10.1% | 19.2% |
| ROIC | 7.95% | 14.4% |
| P/E | 53.0 | 33.2 |
| P/B | 5.37 | 6.37 |
| Current Ratio | 1.06 | 1.12 |
| Quick Ratio | 1.06 | 1.12 |
| D/E (Debt-to-Equity) | 0.19 | 0.36 |
| Debt-to-Assets | 11.1% | 20.7% |
| Interest Coverage | 26.5 | 12.8 |
| Asset Turnover | 0.37 | 0.41 |
| Fixed Asset Turnover | 7.03 | 15.6 |
| Payout ratio | 24.8% | 0% |
| Dividend yield | 0.47% | 0% |
Interpretation of the Ratios
Salesforce, Inc.
Salesforce shows a slightly favorable ratio profile with strong net margin and solid debt management metrics, including a low debt-to-equity of 0.19 and high interest coverage of 28.18. However, its price-to-earnings and price-to-book ratios remain high, indicating valuation concerns. The company pays dividends with a low 0.47% yield, suggesting modest shareholder returns supported by free cash flow.
PTC Inc.
PTC presents a favorable ratio set highlighted by superior profitability ratios such as a 26.8% net margin and a 19.18% return on equity. Debt levels are higher than Salesforce but remain manageable, with favorable interest coverage and a debt-to-equity of 0.36. PTC does not pay dividends, likely reflecting reinvestment into growth and R&D, consistent with its high return metrics and cash flow usage.
Which one has the best ratios?
PTC’s ratios are generally stronger, particularly in profitability and return on capital measures, with fewer neutral ratings. Salesforce, while financially stable and slightly favorable, exhibits higher valuation multiples and lower returns. Both companies face some valuation and asset turnover challenges, but PTC’s overall financial metrics suggest a more robust performance profile.
Strategic Positioning
This section compares the strategic positioning of Salesforce, Inc. and PTC Inc., focusing on market position, key segments, and exposure to technological disruption:
Salesforce, Inc.
- Leading market cap at $218B with significant competitive pressure in global CRM and cloud software.
- Diverse key segments including Sales, Service, Marketing Clouds, Integration, Analytics, and Platform.
- Faces disruption through cloud innovation, analytics, and integration; adapts via acquisitions like Slack.
PTC Inc.
- Market cap of $19.7B, competing in niche software and services with moderate competitive pressure.
- Concentrated segments in product lifecycle, CAD software, AR, and digital transformation platforms.
- Exposure to disruption via IoT, AR, SaaS platforms, focusing on digital transformation solutions.
Salesforce, Inc. vs PTC Inc. Positioning
Salesforce exhibits a diversified portfolio across multiple cloud solutions and analytics, offering broad market exposure. PTC focuses on specialized digital transformation and product development software, concentrating on industrial and AR applications, which may limit its market breadth.
Which has the best competitive advantage?
PTC shows a very favorable moat with ROIC exceeding WACC by 6.13% and growing profitability, indicating a durable competitive advantage. Salesforce’s slightly unfavorable moat suggests value erosion despite improving ROIC trends.
Stock Comparison
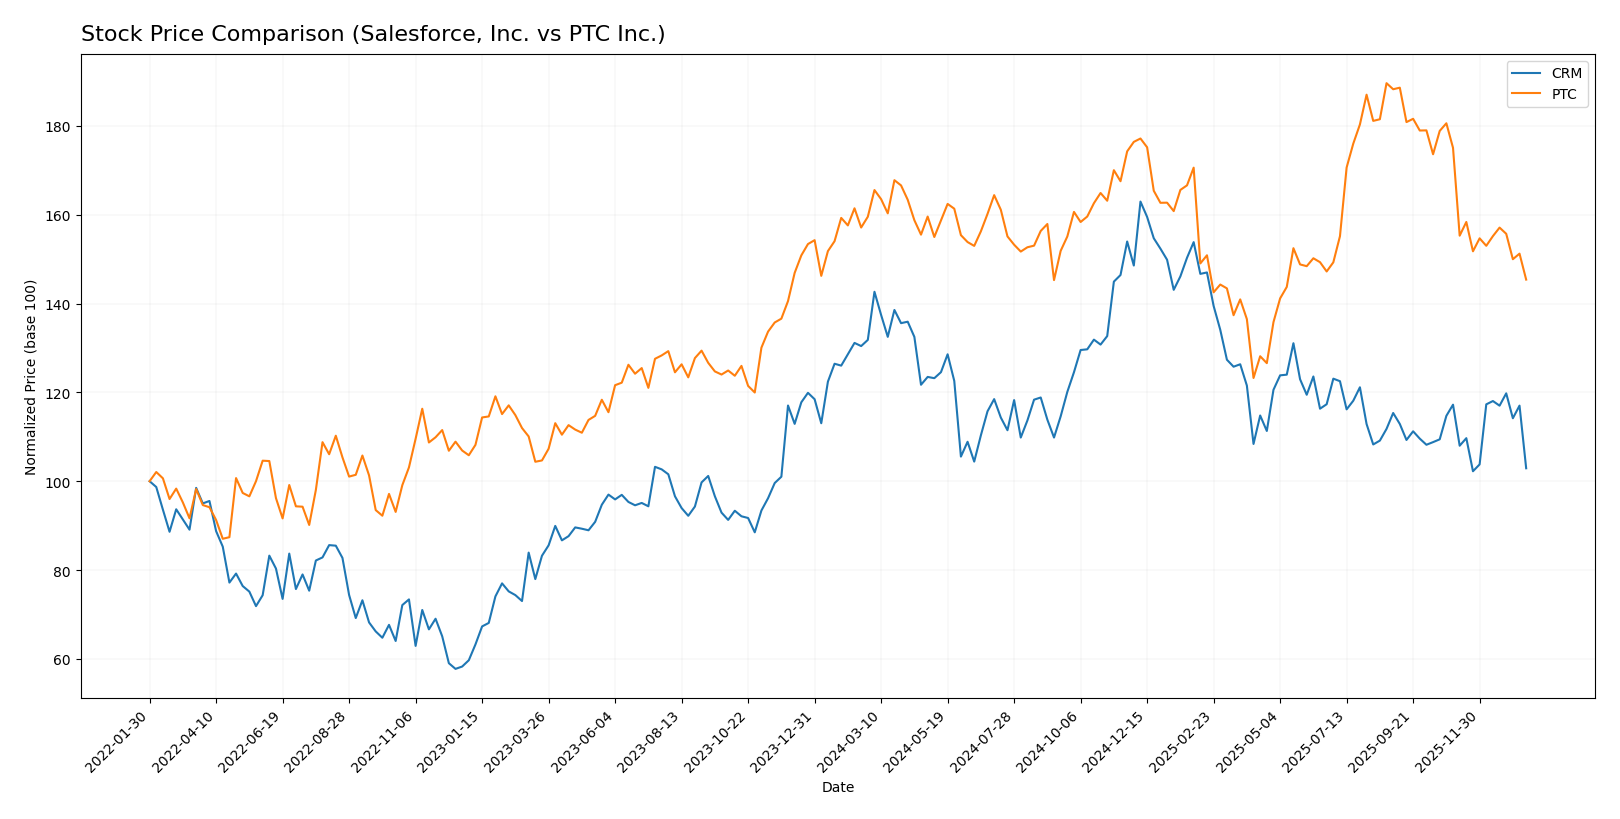
The stock price dynamics of Salesforce, Inc. (CRM) and PTC Inc. (PTC) over the past year show notable bearish trends, with differing degrees of acceleration and volume behavior impacting their market performance.
Trend Analysis
Salesforce, Inc. (CRM) experienced a bearish trend over the past 12 months with a price decline of -21.93%, showing acceleration and high volatility with a standard deviation of 31.8. The stock reached a high of 361.99 and a low of 227.11 during this period.
PTC Inc. (PTC) also showed a bearish trend with a price decline of -8.87% over the same span, but with deceleration and lower volatility (std deviation 15.49). The stock’s highest price was 215.05 and the lowest 139.77, indicating a less severe drop compared to CRM.
Comparing both, Salesforce’s stock delivered the lowest market performance with a larger negative price change and higher volatility, whereas PTC’s decline was milder but still bearish.
Target Prices
The consensus target prices for Salesforce, Inc. and PTC Inc. indicate positive analyst expectations.
| Company | Target High | Target Low | Consensus |
|---|---|---|---|
| Salesforce, Inc. | 400 | 250 | 324.17 |
| PTC Inc. | 255 | 120 | 213.25 |
Analysts expect Salesforce’s stock to appreciate from its current price of 228.55 USD to around 324.17 USD, while PTC’s consensus target of 213.25 USD suggests notable upside from its present 164.84 USD.
Analyst Opinions Comparison
This section compares analysts’ ratings and grades for Salesforce, Inc. and PTC Inc.:
Rating Comparison
Salesforce, Inc. Rating
- Rating: B+, classified as Very Favorable by analysts.
- Discounted Cash Flow Score: 4, indicating favorable valuation based on future cash flows.
- ROE Score: 4, showing efficient generation of profit from shareholders’ equity.
- ROA Score: 4, demonstrating good asset utilization for earnings.
- Debt To Equity Score: 3, reflecting moderate financial risk exposure.
- Overall Score: 3, assessed as moderate overall financial standing.
PTC Inc. Rating
- Rating: B+, classified as Very Favorable by analysts.
- Discounted Cash Flow Score: 4, indicating favorable valuation based on future cash flows.
- ROE Score: 4, showing efficient generation of profit from shareholders’ equity.
- ROA Score: 5, indicating very favorable asset utilization efficiency.
- Debt To Equity Score: 2, reflecting moderate but lower financial risk exposure.
- Overall Score: 3, assessed as moderate overall financial standing.
Which one is the best rated?
Based on the provided data, both companies share the same overall rating (B+) and overall score (3). However, PTC has a higher ROA score (5 vs 4) and a lower Debt to Equity score (2 vs 3), suggesting it is slightly better rated in asset utilization and financial risk metrics.
Scores Comparison
Here is a comparison of the Altman Z-Score and Piotroski Score for each company:
Salesforce Scores
- Altman Z-Score: 5.26, indicating a safe zone with low bankruptcy risk.
- Piotroski Score: 7, classified as strong financial health.
PTC Scores
- Altman Z-Score: 5.67, indicating a safe zone with low bankruptcy risk.
- Piotroski Score: 8, classified as very strong financial health.
Which company has the best scores?
PTC holds a slightly higher Altman Z-Score and a better Piotroski Score than Salesforce, indicating stronger financial health based on these metrics.
Grades Comparison
Here is a comparison of the most recent grades assigned by reputable grading companies for both Salesforce, Inc. and PTC Inc.:
Salesforce, Inc. Grades
This table lists recent grades from established financial institutions for Salesforce, Inc.:
| Grading Company | Action | New Grade | Date |
|---|---|---|---|
| Barclays | Maintain | Overweight | 2026-01-12 |
| RBC Capital | Maintain | Sector Perform | 2026-01-05 |
| Morgan Stanley | Maintain | Overweight | 2025-12-09 |
| Citigroup | Maintain | Neutral | 2025-12-08 |
| DA Davidson | Maintain | Neutral | 2025-12-05 |
| Citizens | Maintain | Market Outperform | 2025-12-04 |
| Deutsche Bank | Maintain | Buy | 2025-12-04 |
| Wedbush | Maintain | Outperform | 2025-12-04 |
| Northland Capital Markets | Maintain | Market Perform | 2025-12-04 |
| Canaccord Genuity | Maintain | Buy | 2025-12-04 |
Salesforce’s grades predominantly indicate a positive outlook with multiple “Buy” and “Overweight” ratings, reflecting consistent confidence across major institutions.
PTC Inc. Grades
Below are recent ratings given by recognized grading firms for PTC Inc.:
| Grading Company | Action | New Grade | Date |
|---|---|---|---|
| Piper Sandler | Maintain | Neutral | 2025-11-07 |
| Rosenblatt | Maintain | Buy | 2025-11-06 |
| Rosenblatt | Maintain | Buy | 2025-10-30 |
| Oppenheimer | Maintain | Outperform | 2025-07-31 |
| Rosenblatt | Maintain | Buy | 2025-07-31 |
| Barclays | Maintain | Overweight | 2025-07-31 |
| Stifel | Maintain | Buy | 2025-07-31 |
| Keybanc | Maintain | Overweight | 2025-07-31 |
| RBC Capital | Maintain | Outperform | 2025-07-31 |
| Piper Sandler | Maintain | Neutral | 2025-07-31 |
PTC’s grades also show a broadly favorable sentiment, with a majority of “Buy,” “Outperform,” and “Overweight” ratings, indicating sustained analyst support.
Which company has the best grades?
Salesforce, Inc. has received a higher quantity of positive grades, including several “Buy” and “Overweight” ratings from top-tier banks, compared to PTC Inc.’s mix of “Buy” and “Neutral” grades. This trend may reflect stronger analyst confidence in Salesforce’s near-term prospects, potentially impacting investor sentiment more favorably.
Strengths and Weaknesses
Below is a comparative overview of key strengths and weaknesses for Salesforce, Inc. (CRM) and PTC Inc. (PTC) based on the most recent financial and operational data.
| Criterion | Salesforce, Inc. (CRM) | PTC Inc. (PTC) |
|---|---|---|
| Diversification | Highly diversified product portfolio across multiple clouds and services, generating over $43B in revenue segments. | Moderate diversification with focus on License, Support and Cloud Services, totaling approx. $2.9B revenue. |
| Profitability | Moderate net margin (16.35%) but ROIC below WACC, indicating slight value destruction despite growth. | Strong profitability with 26.8% net margin and ROIC well above WACC, showing durable value creation. |
| Innovation | Strong ongoing innovation reflected in growing ROIC trend and expanding analytics and platform offerings. | Consistent innovation in technology services, evidenced by steady ROIC growth and increased cloud offerings. |
| Global presence | Extensive global footprint with broad enterprise customer base and cloud infrastructure worldwide. | Solid global presence but more concentrated in specific industry verticals and geographic markets. |
| Market Share | Market leader in CRM and cloud software with significant competitive advantages but facing margin pressures. | Smaller market share but carving niche in digital transformation and IoT segments with growing competitive moat. |
Key takeaways: PTC exhibits a more favorable profitability and value creation profile with a durable competitive advantage. Salesforce remains a dominant diversified player with strong innovation, but its current value destruction signals cautious monitoring is warranted.
Risk Analysis
The following table summarizes key risks for Salesforce, Inc. (CRM) and PTC Inc. (PTC) based on their 2025 financial and market data.
| Metric | Salesforce, Inc. (CRM) | PTC Inc. (PTC) |
|---|---|---|
| Market Risk | Beta 1.27, high valuation (PE 53) increases sensitivity to market swings | Beta 1.01, still exposed but less volatile than CRM |
| Debt level | Low debt-to-equity 0.19, strong interest coverage (28.18x) | Moderate debt-to-equity 0.36, interest coverage 12.95x |
| Regulatory Risk | Exposure to global data/privacy laws due to SaaS model | Moderate, with global operations but less extensive than CRM |
| Operational Risk | Large scale and complexity with 76K employees; integration risks | Smaller scale (7.5K employees), focus on industrial software |
| Environmental Risk | Moderate, tech sector generally less exposed but increasing scrutiny on data centers | Moderate, with some exposure to manufacturing sector sustainability demands |
| Geopolitical Risk | Global presence, sensitive to US-China tensions affecting tech supply chains | Also global, but smaller footprint may reduce exposure |
Salesforce’s high market beta and valuation pose the most impactful risks, amplifying market downturn effects. PTC’s higher leverage and lower interest coverage increase financial risk but its strong profitability and lower volatility offer some cushion. Both have moderate regulatory and environmental risks given global operations and industry trends.
Which Stock to Choose?
Salesforce, Inc. (CRM) shows a favorable income evolution with strong revenue and profit growth, neutral profitability ratios, low debt levels, and a very favorable B+ rating. However, its economic moat is slightly unfavorable due to ROIC falling below WACC despite improving profitability.
PTC Inc. (PTC) displays robust income growth and highly favorable profitability ratios, moderate debt, and a very favorable B+ rating. Its economic moat is very favorable with ROIC exceeding WACC and demonstrating durable competitive advantage and growing profitability.
For investors prioritizing growth potential and improving profitability, Salesforce might appear attractive given its solid income growth and low debt. Conversely, investors inclined toward strong value creation and durable competitive advantage could see PTC as more favorable due to its higher profitability ratios and very favorable moat status.
Disclaimer: Investment carries a risk of loss of initial capital. The past performance is not a reliable indicator of future results. Be sure to understand risks before making an investment decision.
Go Further
I encourage you to read the complete analyses of Salesforce, Inc. and PTC Inc. to enhance your investment decisions: