Investors seeking growth in the technology sector often face the challenge of choosing between established giants and innovative newcomers. PTC Inc., a leader in digital transformation and industrial software, competes with Perfect Corp., a rising star specializing in AI-driven beauty and fashion tech solutions. Both operate in software applications with strong AR and AI components, making their comparison relevant. This article will guide you in identifying the most promising investment opportunity between these two distinct yet overlapping players.
Table of contents
Companies Overview
I will begin the comparison between PTC Inc. and Perfect Corp. by providing an overview of these two companies and their main differences.
PTC Inc. Overview
PTC Inc. is a technology company specializing in software and services across the Americas, Europe, and Asia Pacific. Its mission focuses on enabling digital transformation through platforms like ThingWorx and solutions including AR visualization with Vuforia, SaaS product development via Onshape, and product lifecycle management tools such as Windchill and Arena. Headquartered in Boston, PTC operates with over 7,500 employees and targets enterprise clients seeking scalable innovation.
Perfect Corp. Overview
Perfect Corp. is a Taiwan-based technology firm providing SaaS AI and augmented reality solutions tailored to the beauty and fashion industries. Its offerings include virtual try-on apps, AI skin and face analysis, and AR hairstyle and accessory simulations. Founded in 2015, the company employs around 340 people and focuses on delivering interactive customer experiences through its YouCam suite of applications, serving a niche market with advanced digital beauty tech.
Key similarities and differences
Both PTC and Perfect Corp. operate in the software application industry with a focus on innovative technologies like augmented reality. However, PTC targets broad industrial and enterprise markets with a diverse software portfolio supporting product development and lifecycle management. In contrast, Perfect Corp. concentrates on consumer-facing beauty and fashion tech solutions driven by AI and AR. The scale difference is notable, with PTC’s market cap near 20B and Perfect Corp.’s below 200M, reflecting their distinct market positions and business scopes.
Income Statement Comparison
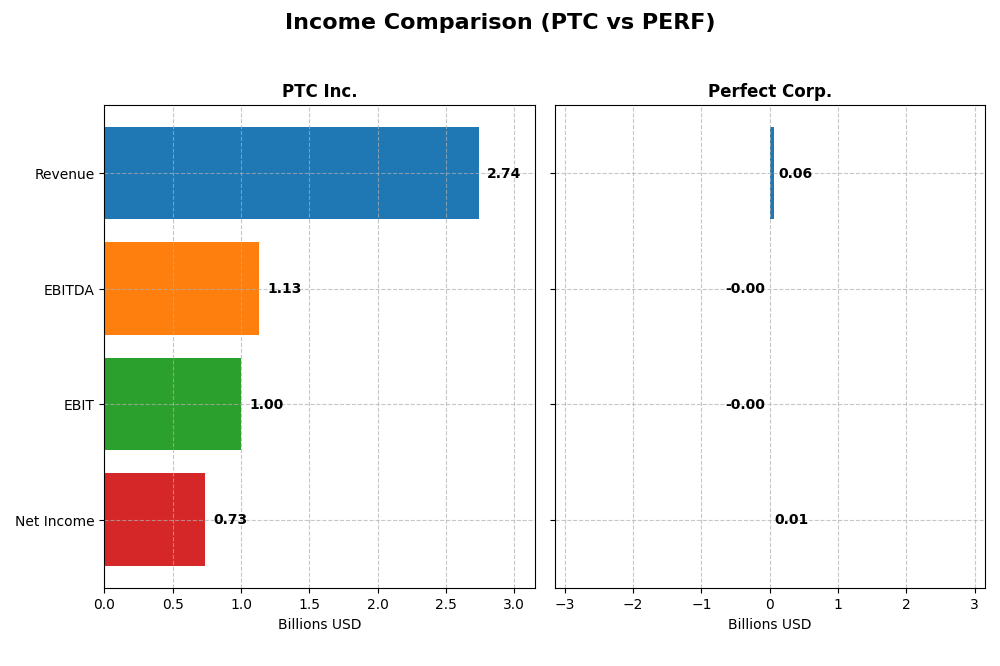
The table below presents a side-by-side comparison of key income statement metrics for PTC Inc. and Perfect Corp. based on their most recent fiscal year data.
| Metric | PTC Inc. | Perfect Corp. |
|---|---|---|
| Market Cap | 19.9B | 179M |
| Revenue | 2.74B | 60.2M |
| EBITDA | 1.13B | -2.05M |
| EBIT | 997M | -2.84M |
| Net Income | 734M | 5.02M |
| EPS | 6.18 | 0.05 |
| Fiscal Year | 2025 | 2024 |
Income Statement Interpretations
PTC Inc.
PTC experienced consistent revenue growth from 2021 to 2025, rising from $1.81B to $2.74B, with net income increasing from $477M to $734M. Margins remained robust, with a gross margin around 83.76% and net margin at 26.8%. The latest year showed strong margin expansion and nearly doubled net income, signaling solid operational leverage and profitability gains.
Perfect Corp.
Perfect Corp. also showed revenue growth, doubling from $30M in 2020 to $60M in 2024, with net income turning positive after previous losses, reaching $5M in 2024. Gross margin remained favorable at 77.98%, but EBIT margin was negative at -4.72%. Despite recent revenue growth, operating profitability declined, reflecting ongoing challenges in expense control.
Which one has the stronger fundamentals?
PTC demonstrates stronger fundamentals with consistently favorable margins, significant net income growth, and improving profitability metrics. Perfect Corp. shows promising revenue and net income growth but suffers from a negative EBIT margin and recent operating losses. Overall, PTC’s stable high margins and earnings growth suggest more reliable income statement strength.
Financial Ratios Comparison
The table below presents a clear comparison of key financial ratios for PTC Inc. and Perfect Corp. based on their most recent fiscal year data, highlighting operational efficiency, profitability, liquidity, and leverage.
| Ratios | PTC Inc. (2025) | Perfect Corp. (2024) |
|---|---|---|
| ROE | 19.18% | 3.42% |
| ROIC | 14.43% | -2.10% |
| P/E | 33.19 | 56.60 |
| P/B | 6.37 | 1.93 |
| Current Ratio | 1.12 | 5.52 |
| Quick Ratio | 1.12 | 5.52 |
| D/E (Debt-to-Equity) | 0.36 | 0.00 |
| Debt-to-Assets | 20.70% | 0.28% |
| Interest Coverage | 12.76 | -449.00 |
| Asset Turnover | 0.41 | 0.33 |
| Fixed Asset Turnover | 15.58 | 57.94 |
| Payout Ratio | 0% | 0% |
| Dividend Yield | 0% | 0% |
Interpretation of the Ratios
PTC Inc.
PTC shows generally strong financial ratios with favorable net margin at 26.8%, ROE at 19.18%, and ROIC at 14.43%. However, high P/E of 33.19 and a PB ratio of 6.37 indicate overvaluation concerns. The company’s dividend yield is zero, reflecting no dividend payments, likely due to a reinvestment strategy focused on growth and innovation.
Perfect Corp.
Perfect Corp. exhibits mixed ratios with a neutral net margin of 8.34% but unfavorable ROE of 3.42% and negative ROIC at -2.1%, signaling operational challenges. Despite a zero dividend yield, the firm maintains a strong quick ratio of 5.52 and zero debt, suggesting a cautious approach prioritizing growth and R&D over shareholder payouts at this stage.
Which one has the best ratios?
PTC presents a more favorable overall ratio profile, supported by strong profitability and leverage metrics, though valuation multiples are stretched. Perfect Corp. faces more unfavorable ratios with lower profitability and negative returns on invested capital, despite strong liquidity and zero debt. Thus, PTC’s ratios appear stronger in this comparison.
Strategic Positioning
This section compares the strategic positioning of PTC Inc. and Perfect Corp., focusing on market position, key segments, and exposure to technological disruption:
PTC Inc.
- Large market cap (~20B USD) with established presence in Americas, Europe, and Asia Pacific; faces competitive pressure in software application industry.
- Key segments include software products and professional services with strong revenue from licenses and cloud services driving business.
- Exposure to technological disruption through advanced AR and SaaS platforms supporting digital transformation and product lifecycle management.
Perfect Corp.
- Small market cap (~179M USD), niche player in beauty and fashion tech with AI and AR solutions; lower competitive pressure due to specialization.
- Focused on SaaS AI and AR beauty and fashion tech solutions, including virtual try-on and AI analysis applications.
- Relies heavily on AI and AR innovations in beauty and fashion, positioning itself at the forefront of tech disruption in its niche market.
PTC Inc. vs Perfect Corp. Positioning
PTC offers a diversified portfolio across software and professional services, benefiting from scale but facing broader competition. Perfect Corp. is more concentrated in AI-driven beauty tech, enabling focused innovation but with limited scale and market breadth.
Which has the best competitive advantage?
PTC shows a very favorable MOAT with growing ROIC well above WACC, indicating durable competitive advantage and value creation. Perfect Corp. has a slightly unfavorable MOAT, shedding value despite improving profitability, reflecting a weaker competitive position.
Stock Comparison
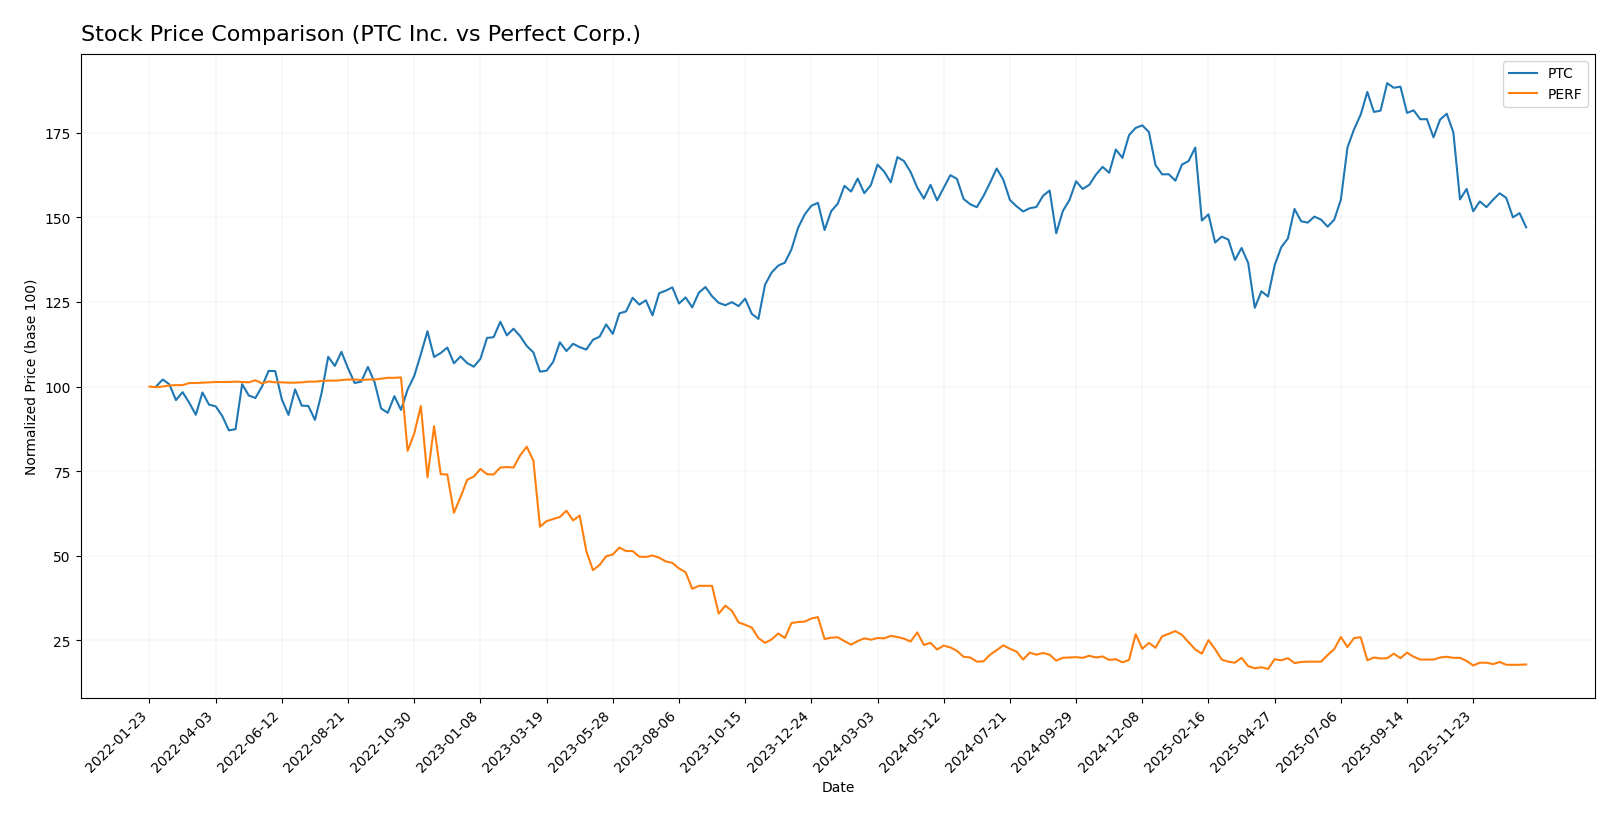
The stock prices of PTC Inc. and Perfect Corp. have exhibited notable declines over the past 12 months, with both experiencing bearish trends and varying degrees of trading volume dynamics.
Trend Analysis
PTC Inc.’s stock showed a -7.84% decline over the past year, indicating a bearish trend with deceleration. The price ranged from a high of 215.05 to a low of 139.77, with volatility reflected by a 15.47 standard deviation.
Perfect Corp.’s stock fell by -28.98% in the same period, also bearish with deceleration. Its price fluctuated between 2.7 and 1.61, showing low volatility with a 0.27 standard deviation.
Comparing both, PTC Inc. delivered a higher market performance than Perfect Corp., as its smaller percentage decline indicates a less severe loss over the past year.
Target Prices
Here is the current consensus on target prices from verified analysts for selected companies.
| Company | Target High | Target Low | Consensus |
|---|---|---|---|
| PTC Inc. | 255 | 120 | 213.25 |
| Perfect Corp. | 7 | 7 | 7 |
Analysts expect PTC Inc. to appreciate significantly from its current price of 166.75 USD, while Perfect Corp.’s consensus target is well above its current price of 1.74 USD, indicating strong growth potential.
Analyst Opinions Comparison
This section compares analysts’ ratings and grades for PTC Inc. and Perfect Corp.:
Rating Comparison
PTC Rating
- Rating: B+, rated as Very Favorable overall.
- Discounted Cash Flow Score: 4, Favorable.
- ROE Score: 4, Favorable return on equity.
- ROA Score: 5, Very Favorable asset efficiency.
- Debt To Equity Score: 2, Moderate financial risk.
- Overall Score: 3, Moderate overall score.
PERF Rating
- Rating: A-, rated as Very Favorable overall.
- Discounted Cash Flow Score: 5, Very Favorable.
- ROE Score: 2, Moderate return on equity.
- ROA Score: 3, Moderate asset efficiency.
- Debt To Equity Score: 4, Favorable financial risk.
- Overall Score: 4, Favorable overall score.
Which one is the best rated?
Based on the provided data, Perfect Corp. holds a higher overall rating (A-) and a better overall score (4) than PTC, indicating a more favorable analyst assessment. However, PTC scores higher on ROE and ROA metrics.
Scores Comparison
Here is a comparison of the Altman Z-Score and Piotroski Score for both companies:
PTC Scores
- Altman Z-Score: 5.67, indicating a safe zone with low bankruptcy risk.
- Piotroski Score: 8, categorized as very strong financial health.
Perfect Scores
- Altman Z-Score: 1.31, indicating distress zone with high bankruptcy risk.
- Piotroski Score: 6, reflecting average financial strength.
Which company has the best scores?
PTC shows stronger financial health with a high Altman Z-Score in the safe zone and a very strong Piotroski Score. Perfect has weaker scores, indicating potential financial distress and only average strength.
Grades Comparison
Here is a comparison of the latest reliable grades provided by recognized grading companies for PTC Inc. and Perfect Corp.:
PTC Inc. Grades
The following table presents recent grades from reputable grading firms for PTC Inc.:
| Grading Company | Action | New Grade | Date |
|---|---|---|---|
| Piper Sandler | Maintain | Neutral | 2025-11-07 |
| Rosenblatt | Maintain | Buy | 2025-11-06 |
| Rosenblatt | Maintain | Buy | 2025-10-30 |
| Oppenheimer | Maintain | Outperform | 2025-07-31 |
| Rosenblatt | Maintain | Buy | 2025-07-31 |
| Barclays | Maintain | Overweight | 2025-07-31 |
| Stifel | Maintain | Buy | 2025-07-31 |
| Keybanc | Maintain | Overweight | 2025-07-31 |
| RBC Capital | Maintain | Outperform | 2025-07-31 |
| Piper Sandler | Maintain | Neutral | 2025-07-31 |
Overall, PTC Inc. displays a predominantly positive trend in grades, with multiple “Buy,” “Outperform,” and “Overweight” ratings alongside few “Neutral” grades.
Perfect Corp. Grades
The following table presents recent grades from reputable grading firms for Perfect Corp.:
| Grading Company | Action | New Grade | Date |
|---|---|---|---|
| Piper Sandler | Maintain | Neutral | 2024-02-29 |
| Goldman Sachs | Maintain | Neutral | 2023-10-26 |
| Piper Sandler | Maintain | Neutral | 2023-10-25 |
| Piper Sandler | Maintain | Neutral | 2023-07-26 |
| Piper Sandler | Maintain | Neutral | 2023-07-25 |
| Piper Sandler | Maintain | Neutral | 2023-04-27 |
| Oppenheimer | Downgrade | Perform | 2023-04-20 |
| Oppenheimer | Downgrade | Perform | 2023-04-19 |
| Oppenheimer | Downgrade | Perform | 2023-04-18 |
| Piper Sandler | Maintain | Neutral | 2023-03-08 |
Perfect Corp. grades show a consistent pattern of “Neutral” ratings, with a recent downgrade from “Outperform” to “Perform” by Oppenheimer, indicating a more cautious outlook.
Which company has the best grades?
PTC Inc. has received notably stronger grades, including multiple “Buy” and “Outperform” ratings, compared to Perfect Corp.’s mainly “Neutral” grades and recent downgrades. This difference may influence investor sentiment and portfolio positioning accordingly.
Strengths and Weaknesses
Below is a comparison table highlighting the key strengths and weaknesses of PTC Inc. and Perfect Corp. based on the latest available data:
| Criterion | PTC Inc. | Perfect Corp. |
|---|---|---|
| Diversification | Strong revenue mix: License (1.16B), Support & Cloud (1.47B), Technology Services (107M) | Limited product diversification; mainly focused on beauty tech solutions |
| Profitability | High profitability: Net margin 26.8%, ROIC 14.43% (favorable) | Low profitability: Net margin 8.34%, ROIC -2.1% (unfavorable) |
| Innovation | Consistent investment in tech services and cloud; growing ROIC 42.4% | Growing ROIC trend 45.8% but still value-destroying; innovation improving but profitability lagging |
| Global presence | Established global footprint with diverse customer base | Smaller global reach, more niche market focus |
| Market Share | Significant in industrial software markets | Niche leader in AI beauty tech, but smaller scale |
Key takeaways: PTC Inc. demonstrates strong profitability, diversification, and a durable competitive advantage with growing returns on invested capital. Perfect Corp. shows promising innovation growth but struggles with profitability and value creation, indicating a higher risk profile. Investors should weigh PTC’s stable value creation against Perfect’s growth potential but current financial challenges.
Risk Analysis
Below is a comparative table summarizing key risks for PTC Inc. and Perfect Corp. based on the most recent data from 2025 and 2024 respectively:
| Metric | PTC Inc. | Perfect Corp. |
|---|---|---|
| Market Risk | Moderate (Beta 1.01, NASDAQ-listed, tech sector volatility) | Lower (Beta 0.45, NYSE-listed, niche AI beauty tech) |
| Debt level | Low (Debt-to-Equity 0.36, favorable) | Very low (Debt-to-Equity 0.0, favorable) |
| Regulatory Risk | Moderate (US tech regulations) | Moderate to high (Taiwanese market, AI-related privacy laws evolving) |
| Operational Risk | Moderate (Scale with 7.5K employees, global operations) | Higher (Smaller size 342 employees, rapid innovation pressure) |
| Environmental Risk | Low (Software-focused, limited direct environmental impact) | Low (Digital services, minimal direct environmental footprint) |
| Geopolitical Risk | Moderate (US-based with international exposure) | Higher (Taiwan HQ, geopolitical tensions in Asia) |
PTC’s moderate market and operational risks are balanced by its strong financial health and low debt. Perfect Corp. faces higher geopolitical and regulatory risks due to its location and industry but benefits from minimal debt and a niche market focus. The geopolitical risk for Perfect Corp. and regulatory uncertainties in AI tech represent the most impactful concerns for investors.
Which Stock to Choose?
PTC Inc. shows a favorable income evolution with a 19.18% revenue growth in 2025 and strong profitability metrics, including a 26.8% net margin and 19.18% ROE. Its financial ratios are mostly favorable, supported by a moderate debt level and a very favorable rating of B+. The company demonstrates a very favorable economic moat with a growing ROIC exceeding WACC.
Perfect Corp. presents positive income growth overall but with mixed profitability; its net margin is 8.34%, ROE is low at 3.42%, and ROIC is negative, indicating value destruction despite improving profitability. Financial ratios are slightly unfavorable overall, though the company has a very favorable rating of A-. It faces distress in Altman Z-Score, reflecting financial risk concerns.
Investors focused on stable profitability and durable competitive advantage might find PTC’s profile more favorable, while those tolerating higher risk and seeking growth potential could interpret Perfect Corp.’s improving income and rating as promising despite financial challenges. The choice could depend on the investor’s risk tolerance and strategic focus.
Disclaimer: Investment carries a risk of loss of initial capital. The past performance is not a reliable indicator of future results. Be sure to understand risks before making an investment decision.
Go Further
I encourage you to read the complete analyses of PTC Inc. and Perfect Corp. to enhance your investment decisions: