PTC Inc. and Pegasystems Inc. both operate in the competitive software application industry, offering innovative platforms that drive digital transformation and customer engagement. While PTC focuses on product lifecycle and industrial solutions, Pegasystems excels in intelligent automation and customer experience software. This comparison explores their market positions, innovation strategies, and growth potential to help you identify the most compelling investment opportunity in 2026.
Table of contents
Companies Overview
I will begin the comparison between PTC Inc. and Pegasystems Inc. by providing an overview of these two companies and their main differences.
PTC Overview
PTC Inc. operates as a software and services company across the Americas, Europe, and Asia Pacific, focusing on digital transformation solutions. Its offerings include platforms like ThingWorx for IoT, Vuforia for augmented reality, and Onshape, a SaaS product development tool. PTC serves industries by enabling product design, lifecycle management, and application lifecycle management, positioning itself as a leader in innovative engineering software.
Pegasystems Overview
Pegasystems Inc. develops enterprise software applications with a focus on customer engagement and digital process automation. Its core products include the Pega Platform and Pega Infinity, which unify customer interactions and automate business processes. Pegasystems targets diverse sectors such as financial services and healthcare, delivering cloud-based software, intelligent automation, and support services to enhance customer experience and operational efficiency.
Key similarities and differences
Both companies operate in the software application industry with a strong emphasis on enterprise solutions and digital transformation. PTC primarily specializes in product lifecycle management and engineering software, while Pegasystems focuses on customer engagement and process automation platforms. Additionally, PTC has a larger workforce and market capitalization compared to Pegasystems, reflecting differences in scale and market positioning.
Income Statement Comparison
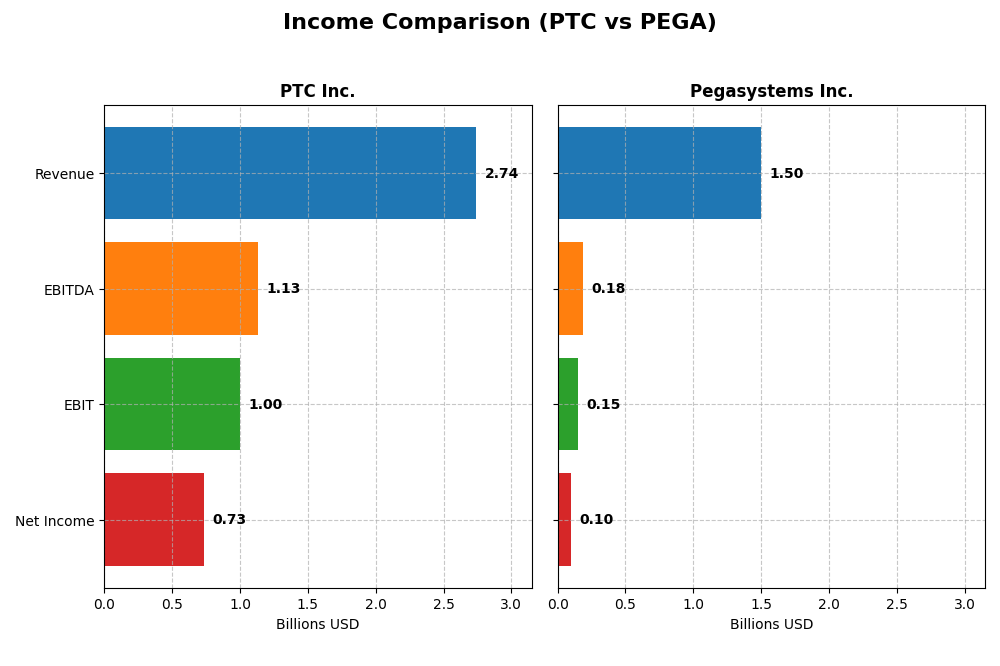
The table below compares the most recent fiscal year income statement metrics for PTC Inc. and Pegasystems Inc., providing a clear snapshot of their financial performance.
| Metric | PTC Inc. | Pegasystems Inc. |
|---|---|---|
| Market Cap | 19.9B | 8.9B |
| Revenue | 2.74B | 1.50B |
| EBITDA | 1.13B | 185M |
| EBIT | 997M | 149M |
| Net Income | 734M | 99M |
| EPS | 6.18 | 0.58 |
| Fiscal Year | 2025 | 2024 |
Income Statement Interpretations
PTC Inc.
PTC Inc. shows strong revenue and net income growth from 2021 to 2025, with revenues rising from $1.81B to $2.74B and net income doubling from $477M to $734M. Margins remain robust, with a gross margin of 83.76% and net margin of 26.8% in 2025. The latest year saw a 19.2% revenue increase and nearly 64% net margin growth, signaling accelerating profitability.
Pegasystems Inc.
Pegasystems experienced steady revenue growth from $1.02B in 2020 to $1.50B in 2024, while net income swung from losses to $99M. Gross margin improved to 73.9%, with a net margin of 6.63% in 2024. Growth slowed to around 4.5% in revenue, but net margin and EPS grew significantly, reflecting improving operational efficiency and profitability.
Which one has the stronger fundamentals?
PTC exhibits higher margins, more consistent and substantial revenue and net income growth, and superior profitability ratios compared to Pegasystems. Pegasystems shows positive momentum from prior losses with improving margins and earnings, but its profitability remains lower. Overall, PTC’s fundamentals appear stronger based on margin quality and growth metrics.
Financial Ratios Comparison
The table below presents a side-by-side comparison of key financial ratios for PTC Inc. and Pegasystems Inc. based on their most recent fiscal year data, enabling a clear view of their financial performance and health.
| Ratios | PTC Inc. (2025) | Pegasystems Inc. (2024) |
|---|---|---|
| ROE | 19.2% | 16.9% |
| ROIC | 14.4% | 7.4% |
| P/E | 33.2 | 80.1 |
| P/B | 6.37 | 13.57 |
| Current Ratio | 1.12 | 1.23 |
| Quick Ratio | 1.12 | 1.23 |
| D/E | 0.36 | 0.94 |
| Debt-to-Assets | 20.7% | 31.1% |
| Interest Coverage | 12.8 | 18.1 |
| Asset Turnover | 0.41 | 0.85 |
| Fixed Asset Turnover | 15.6 | 14.4 |
| Payout ratio | 0% | 10.3% |
| Dividend yield | 0% | 0.13% |
Interpretation of the Ratios
PTC Inc.
PTC Inc. shows a generally favorable ratio profile with strong net margin (26.8%) and return on equity (19.18%), indicating efficient profitability and shareholder value creation. However, its high P/E (33.19) and P/B (6.37) ratios suggest the stock may be overvalued. The company does not pay dividends, likely focusing on reinvestment and growth strategies, as free cash flow to equity is negative.
Pegasystems Inc.
Pegasystems Inc. presents a mixed ratio picture with favorable return on equity (16.94%) but only neutral net margin (6.63%) and return on invested capital (7.4%). Its P/E (80.12) and P/B (13.57) ratios are notably high, signaling valuation concerns. The company pays a small dividend (yield 0.13%), but this is considered unfavorable relative to valuation metrics and modest profitability.
Which one has the best ratios?
PTC Inc. holds a more favorable overall ratio assessment with 57.14% favorable metrics compared to Pegasystems’ 28.57%, reflecting stronger profitability and balance sheet health. Despite some valuation concerns, PTC’s financials appear more robust, while Pegasystems faces greater neutrality and valuation risks, resulting in a slightly favorable standing.
Strategic Positioning
This section compares the strategic positioning of PTC and Pegasystems, focusing on market position, key segments, and exposure to technological disruption:
PTC Inc.
- Strong market position with $19.9B market cap, moderate beta 1.01; competes in software apps.
- Key segments include License, Support & Cloud Services, and Technology Services driving growth.
- Exposure through digital transformation tools like ThingWorx, AR (Vuforia), and SaaS platforms.
Pegasystems Inc.
- Smaller $8.9B market cap, beta 1.08; competes in enterprise software with direct sales and partnerships.
- Key segments are Pega Cloud, Subscription and Maintenance, plus Consulting, targeting multiple industries.
- Exposure via Pega Platform, intelligent automation, and cloud infrastructure supporting customer engagement.
PTC Inc. vs Pegasystems Inc. Positioning
PTC demonstrates a diversified portfolio with software products and professional services across digital transformation and product lifecycle management. Pegasystems focuses more narrowly on enterprise customer engagement and automation software, relying heavily on cloud and subscription models.
Which has the best competitive advantage?
PTC holds a very favorable moat with consistent ROIC above WACC and growing profitability, indicating durable competitive advantage. Pegasystems shows slightly unfavorable moat status, shedding value despite improving profitability trends.
Stock Comparison
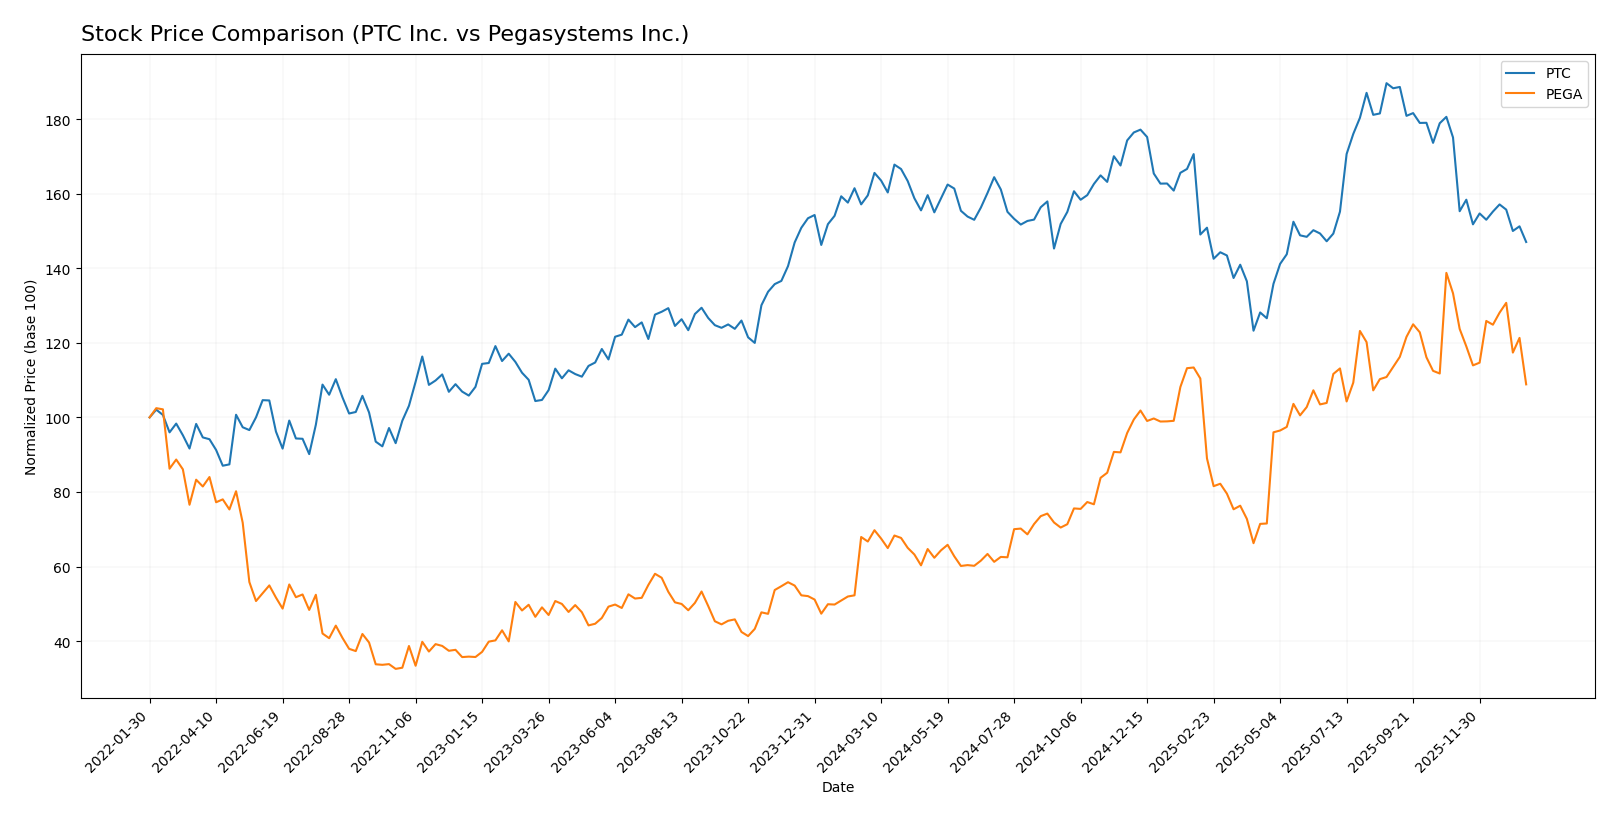
The stock prices of PTC Inc. and Pegasystems Inc. over the past 12 months reveal contrasting market dynamics, with PTC showing a declining trend and Pegasystems demonstrating significant gains despite recent moderation.
Trend Analysis
PTC Inc. experienced a bearish trend over the past year, with a price decline of 7.84% and decelerating losses. The stock showed volatility with a standard deviation of 15.47, reaching highs of 215.05 and lows of 139.77. Recent data indicates further weakening with a 16.01% drop.
Pegasystems Inc. displayed a bullish trend over the same period, gaining 63.18% despite deceleration. The stock’s volatility was lower at 10.77, with a high of 66.27 and a low of 28.73. However, recent weeks show a downward movement of 18.32%, signaling caution.
Comparing the two, Pegasystems outperformed PTC substantially over the past year, delivering the highest market performance despite both stocks showing recent declines.
Target Prices
The current analyst consensus presents a positive outlook with notable upside potential for both PTC Inc. and Pegasystems Inc.
| Company | Target High | Target Low | Consensus |
|---|---|---|---|
| PTC Inc. | 255 | 120 | 213.25 |
| Pegasystems Inc. | 80 | 67 | 74 |
Analysts expect PTC’s stock to rise from its current price of $166.75 toward a consensus target of $213.25, indicating significant upside. Pegasystems’ consensus target of $74 also suggests a strong growth potential above its current $51.99 market price.
Analyst Opinions Comparison
This section compares analysts’ ratings and grades for PTC Inc. and Pegasystems Inc.:
Rating Comparison
PTC Rating
- Rating: B+, classified as Very Favorable
- Discounted Cash Flow Score: 4 (Favorable)
- ROE Score: 4 (Favorable)
- ROA Score: 5 (Very Favorable)
- Debt To Equity Score: 2 (Moderate)
- Overall Score: 3 (Moderate)
PEGA Rating
- Rating: B+, also classified as Very Favorable
- Discounted Cash Flow Score: 3 (Moderate)
- ROE Score: 5 (Very Favorable)
- ROA Score: 5 (Very Favorable)
- Debt To Equity Score: 3 (Moderate)
- Overall Score: 3 (Moderate)
Which one is the best rated?
Both PTC and PEGA share the same overall rating of B+ and an identical overall score of 3, indicating moderate strength. PTC scores higher on discounted cash flow, while PEGA leads on return on equity and debt to equity, reflecting different financial strengths.
Scores Comparison
The scores comparison between PTC and PEGA provides insight into their financial stability and strength:
PTC Scores
- Altman Z-Score: 5.67, indicating a safe zone with low bankruptcy risk.
- Piotroski Score: 8, reflecting very strong financial health.
PEGA Scores
- Altman Z-Score: 10.31, indicating a safe zone with very low bankruptcy risk.
- Piotroski Score: 8, reflecting very strong financial health.
Which company has the best scores?
Both PTC and PEGA are in the safe zone for Altman Z-Score and share a very strong Piotroski Score of 8. PEGA has a higher Altman Z-Score, indicating comparatively lower bankruptcy risk based on this metric.
Grades Comparison
Here is a comparison of the latest grades assigned to PTC Inc. and Pegasystems Inc. by reputable grading companies:
PTC Inc. Grades
The following table summarizes recent grades from recognized financial institutions for PTC Inc.:
| Grading Company | Action | New Grade | Date |
|---|---|---|---|
| Piper Sandler | Maintain | Neutral | 2025-11-07 |
| Rosenblatt | Maintain | Buy | 2025-11-06 |
| Rosenblatt | Maintain | Buy | 2025-10-30 |
| Oppenheimer | Maintain | Outperform | 2025-07-31 |
| Rosenblatt | Maintain | Buy | 2025-07-31 |
| Barclays | Maintain | Overweight | 2025-07-31 |
| Stifel | Maintain | Buy | 2025-07-31 |
| Keybanc | Maintain | Overweight | 2025-07-31 |
| RBC Capital | Maintain | Outperform | 2025-07-31 |
| Piper Sandler | Maintain | Neutral | 2025-07-31 |
PTC Inc. shows a consistent pattern of positive ratings, with multiple “Buy,” “Outperform,” and “Overweight” grades, balanced by neutral assessments.
Pegasystems Inc. Grades
The table below presents recent grades from established grading companies for Pegasystems Inc.:
| Grading Company | Action | New Grade | Date |
|---|---|---|---|
| JP Morgan | Maintain | Overweight | 2025-12-05 |
| Wedbush | Maintain | Outperform | 2025-10-23 |
| RBC Capital | Maintain | Outperform | 2025-10-23 |
| Barclays | Maintain | Equal Weight | 2025-10-23 |
| Rosenblatt | Maintain | Buy | 2025-10-23 |
| DA Davidson | Upgrade | Buy | 2025-10-22 |
| Rosenblatt | Maintain | Buy | 2025-10-15 |
| Rosenblatt | Maintain | Buy | 2025-07-24 |
| DA Davidson | Maintain | Neutral | 2025-07-24 |
| Wedbush | Maintain | Outperform | 2025-07-24 |
Pegasystems Inc. has predominantly positive ratings with several “Buy,” “Outperform,” and “Overweight” grades, alongside some neutral and equal weight assessments.
Which company has the best grades?
Both PTC Inc. and Pegasystems Inc. have received predominantly favorable grades from reputable firms, with PTC showing more “Buy” and “Outperform” ratings consistently, while Pegasystems also has strong “Buy” and “Outperform” support but includes some neutral and equal weight grades. This could influence investor sentiment by highlighting PTC’s slightly stronger consensus among analysts.
Strengths and Weaknesses
Below is a comparison of key strengths and weaknesses for PTC Inc. and Pegasystems Inc. based on their latest financial and operational data.
| Criterion | PTC Inc. | Pegasystems Inc. |
|---|---|---|
| Diversification | Strong with License, Support & Cloud Services, Technology Services segments | Moderate, focused on Pega Cloud, Consulting, Maintenance, and Subscription Licenses |
| Profitability | High net margin (26.8%), ROIC 14.43%, creating value | Moderate net margin (6.63%), ROIC 7.4%, shedding value but improving |
| Innovation | Demonstrates durable competitive advantage with growing ROIC | Improving profitability but still slightly unfavorable moat status |
| Global presence | Established with broad service and license offerings globally | Growing cloud services presence, but less diversified globally |
| Market Share | Large in software licensing and cloud services | Focused niche in cloud-based customer engagement software |
Key takeaways: PTC Inc. exhibits a robust competitive moat with strong profitability and diversification across software and cloud segments. Pegasystems shows promising growth in cloud services but currently faces challenges in value creation and profitability, suggesting a higher risk profile for investors.
Risk Analysis
Below is a comparison table highlighting key risks for PTC Inc. and Pegasystems Inc. based on their latest financial and operational profiles.
| Metric | PTC Inc. | Pegasystems Inc. |
|---|---|---|
| Market Risk | Moderate (Beta 1.01) | Moderate (Beta 1.08) |
| Debt Level | Low (D/E 0.36, Debt/Assets 20.7%) | Moderate (D/E 0.94, Debt/Assets 31.1%) |
| Regulatory Risk | Moderate (Tech industry compliance) | Moderate (Tech industry compliance) |
| Operational Risk | Moderate (Global software deployment) | Moderate (Cloud and enterprise apps) |
| Environmental Risk | Low (Primarily software, low footprint) | Low (Primarily software, low footprint) |
| Geopolitical Risk | Moderate (Global presence, supply chain exposure) | Moderate (Global presence, supply chain exposure) |
The most impactful risks are market volatility and debt level. PTC maintains lower leverage, reducing financial risk, while Pegasystems carries higher debt, which could increase vulnerability during economic downturns. Both face regulatory and geopolitical risks typical of global software providers.
Which Stock to Choose?
PTC Inc. shows a favorable income evolution with a 19.18% revenue growth in 2025 and strong profitability metrics, including a 26.8% net margin and 19.18% ROE. Its financial ratios are mostly favorable, with a low debt-to-equity ratio and strong interest coverage, supported by a very favorable moat rating indicating durable competitive advantage.
Pegasystems Inc. has a moderately favorable income evolution with 4.51% revenue growth in 2024 and a lower net margin of 6.63%. While profitability ratios like ROE are favorable, the company’s financial ratios are more mixed, with some neutral and unfavorable valuations. Its moat rating is slightly unfavorable due to value destruction despite improving profitability.
Considering ratings and overall financial evaluations, PTC might appear more attractive for investors seeking quality and durability, whereas Pegasystems could appeal to those prioritizing growth potential despite higher risk. The choice could depend on whether the investor favors stability or is willing to tolerate volatility for potential upside.
Disclaimer: Investment carries a risk of loss of initial capital. The past performance is not a reliable indicator of future results. Be sure to understand risks before making an investment decision.
Go Further
I encourage you to read the complete analyses of PTC Inc. and Pegasystems Inc. to enhance your investment decisions: