In the fast-evolving software industry, PTC Inc. and Paycom Software, Inc. stand out as innovators with distinct yet overlapping market focuses. PTC specializes in digital transformation and product lifecycle solutions, while Paycom excels in cloud-based human capital management. Both companies leverage cutting-edge technology to drive growth, making them compelling contenders for investors seeking exposure to the tech sector. This article will help you identify which company holds the most promise for your portfolio.
Table of contents
Companies Overview
I will begin the comparison between PTC and Paycom by providing an overview of these two companies and their main differences.
PTC Overview
PTC Inc. is a software and services company headquartered in Boston, Massachusetts, operating globally in the Americas, Europe, and Asia Pacific. It focuses on digital transformation solutions through its ThingWorx platform and augmented reality via Vuforia. The company also offers product lifecycle management and application lifecycle management software, serving industries with scalable, innovative tools for design, collaboration, and service management.
Paycom Overview
Paycom Software, Inc., based in Oklahoma City, Oklahoma, provides cloud-based human capital management (HCM) software-as-a-service for small to mid-sized U.S. companies. Its platform covers the entire employment lifecycle, including talent acquisition, payroll, time and labor management, and benefits administration. Paycom’s solutions emphasize data analytics and mobile accessibility to streamline workforce management and compliance.
Key similarities and differences
Both PTC and Paycom operate in the software application industry, offering SaaS solutions that support business operations. However, PTC focuses on digital transformation and product lifecycle management across multiple sectors globally, while Paycom specializes in human capital management exclusively for the U.S. market. Their business models differ in target industries and software functionalities, with PTC emphasizing engineering and manufacturing, and Paycom concentrating on workforce management and HR processes.
Income Statement Comparison
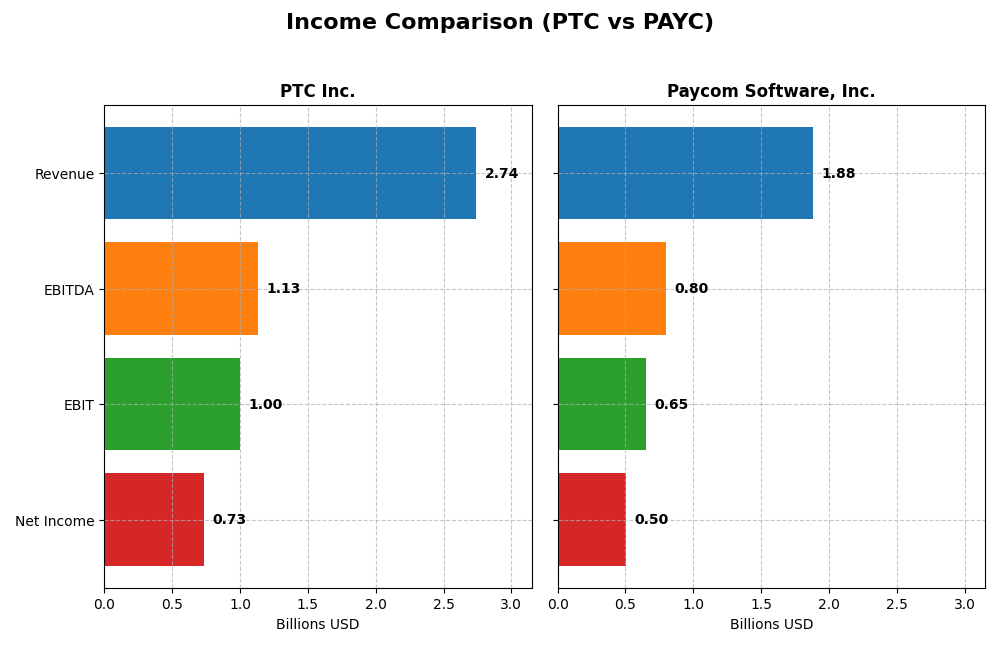
The table below compares key income statement metrics for PTC Inc. and Paycom Software, Inc. for their most recent fiscal years, providing a snapshot of their financial performance.
| Metric | PTC Inc. | Paycom Software, Inc. |
|---|---|---|
| Market Cap | 19.9B | 8.3B |
| Revenue | 2.74B | 1.88B |
| EBITDA | 1.13B | 798M |
| EBIT | 997M | 652M |
| Net Income | 734M | 502M |
| EPS | 6.18 | 8.93 |
| Fiscal Year | 2025 | 2024 |
Income Statement Interpretations
PTC Inc.
PTC Inc. experienced steady revenue growth from 2021 to 2025, rising from $1.81B to $2.74B. Net income more than doubled, reaching $734M in 2025. Margins remained stable, with gross margin at 83.76% and net margin at 26.8%. The latest year showed significant improvement in profitability, with a 19.18% revenue increase and nearly 97% EPS growth.
Paycom Software, Inc.
Paycom’s revenue climbed from $841M in 2020 to $1.88B in 2024, showing strong expansion. Net income grew robustly to $502M, supported by a consistent net margin near 26.66%. The 2024 fiscal year maintained positive momentum, with an 11.19% revenue rise and a 51.7% increase in EPS, reflecting solid operational execution and margin improvement.
Which one has the stronger fundamentals?
Both companies show favorable income statement trends, yet Paycom demonstrates higher overall growth rates, especially in net income (250%) and EPS (263%) over their respective periods. PTC maintains higher absolute revenue and net income levels with excellent margins. Therefore, Paycom’s rapid growth contrasts with PTC’s scale and stable profitability, indicating distinct fundamental strengths in each case.
Financial Ratios Comparison
The table below presents the most recent financial ratios for PTC Inc. and Paycom Software, Inc., offering a direct comparison of key performance and valuation metrics for fiscal year 2025 and 2024 respectively.
| Ratios | PTC Inc. (2025) | Paycom Software, Inc. (2024) |
|---|---|---|
| ROE | 19.18% | 31.85% |
| ROIC | 14.43% | 24.86% |
| P/E | 33.19 | 22.95 |
| P/B | 6.37 | 7.31 |
| Current Ratio | 1.12 | 1.10 |
| Quick Ratio | 1.12 | 1.10 |
| D/E | 0.36 | 0.05 |
| Debt-to-Assets | 20.70% | 1.42% |
| Interest Coverage | 12.76 | 186.56 |
| Asset Turnover | 0.41 | 0.32 |
| Fixed Asset Turnover | 15.58 | 2.93 |
| Payout ratio | 0.00 | 16.89% |
| Dividend yield | 0.00% | 0.74% |
Interpretation of the Ratios
PTC Inc.
PTC Inc. shows mostly strong financial ratios, with favorable net margin (26.8%), ROE (19.18%), and ROIC (14.43%), indicating solid profitability and capital efficiency. Concerns arise from an unfavorable PE ratio (33.19) and asset turnover (0.41), suggesting valuation and operational efficiency challenges. The company does not pay dividends, reflecting a reinvestment strategy in R&D and growth.
Paycom Software, Inc.
Paycom displays strong profitability with a net margin of 26.66%, an impressive ROE of 31.85%, and ROIC at 24.86%. Its interest coverage is excellent (191.88), signaling low financial risk. The dividend yield is low (0.74%) with an unfavorable rating, implying limited income returns. Paycom pays dividends, but payout ratios and buybacks are not detailed, indicating cautious shareholder return management.
Which one has the best ratios?
Both companies have a favorable overall ratio profile at 57.14%, but Paycom’s higher ROE and ROIC, superior interest coverage, and slightly better WACC rating stand out. PTC has more concerns with valuation multiples and asset turnover. However, both show prudent liquidity and leverage management, making the choice dependent on investor priorities.
Strategic Positioning
This section compares the strategic positioning of PTC Inc. and Paycom Software, Inc., including market position, key segments, and exposure to technological disruption:
PTC Inc.
- Large market cap of 19.9B, operating globally, facing NASDAQ competitive pressure.
- Diversified software products: CAD, PLM, AR platforms, and professional services.
- Exposure through innovative digital transformation platforms and AR technology.
Paycom Software, Inc.
- Smaller market cap of 8.3B, focused on U.S. mid-sized companies, competing on NYSE.
- Concentrated on cloud-based human capital management SaaS for U.S. small to mid-sized firms.
- Exposure via proprietary Bluetooth tech and advanced workforce management analytics.
PTC vs Paycom Positioning
PTC adopts a diversified approach with multiple product lines and global reach, offering broader market exposure but possibly higher operational complexity. Paycom focuses on a concentrated niche in HCM SaaS for U.S. mid-sized companies, potentially allowing deeper specialization but narrower market scope.
Which has the best competitive advantage?
Both companies demonstrate a very favorable moat with growing ROIC and value creation. Paycom shows a higher ROIC premium over WACC and steeper ROIC growth, indicating a possibly stronger and more durable competitive advantage.
Stock Comparison
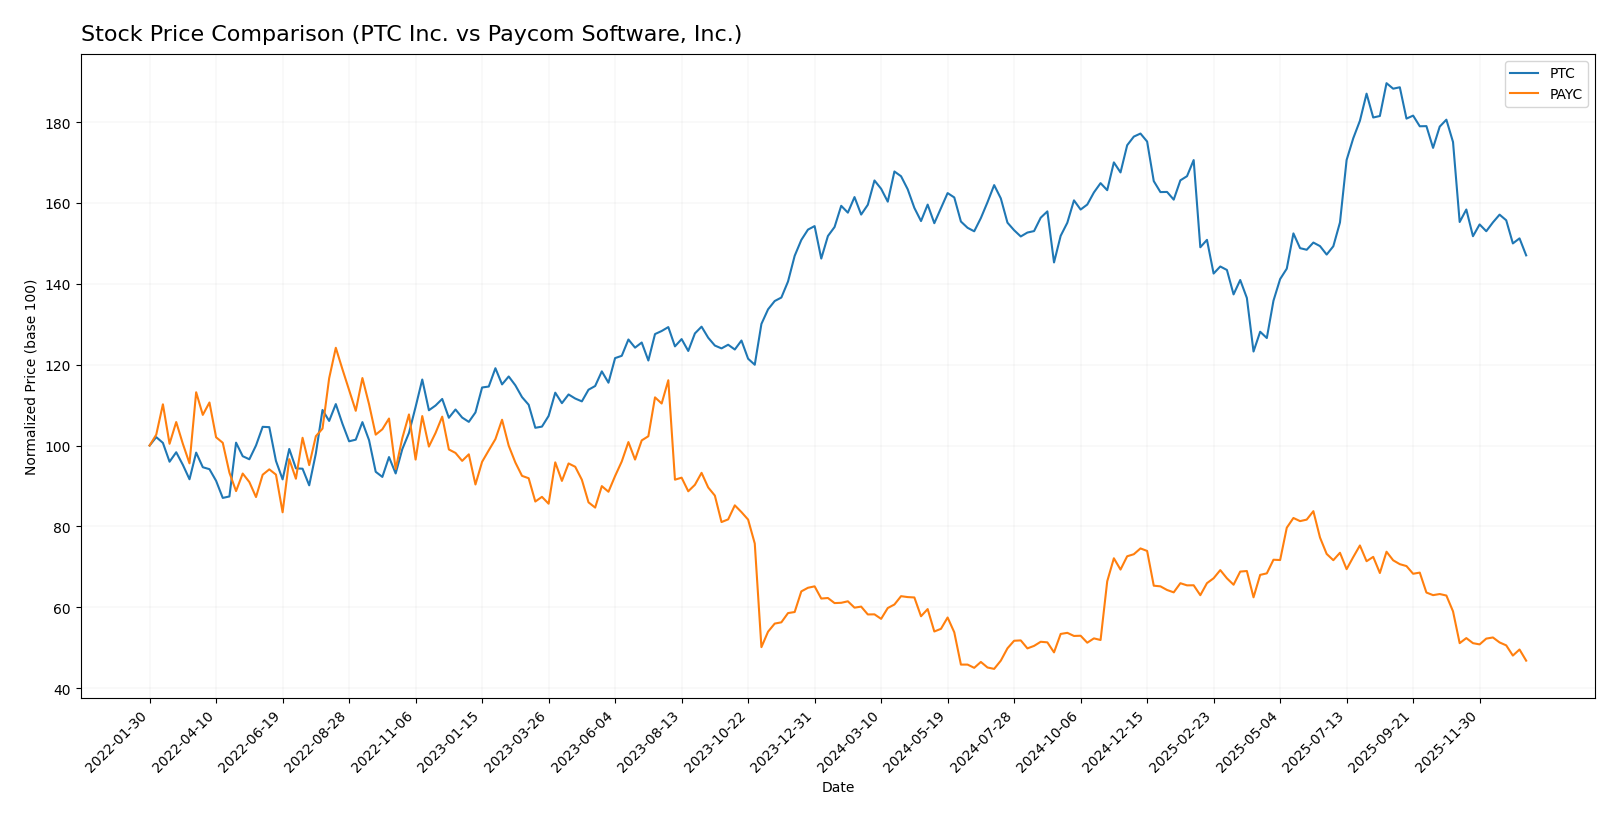
The stock prices of PTC Inc. and Paycom Software, Inc. have both experienced notable declines over the past year, reflecting bearish trends with decreasing momentum and shifts in trading volume dynamics.
Trend Analysis
PTC Inc. shows a bearish trend over the past 12 months with a -7.84% price change and deceleration in decline. The stock ranged between 139.77 and 215.05, with volatility measured by a 15.47 std deviation.
Paycom Software, Inc. also follows a bearish trend with a steeper -19.64% price drop over the last year, accompanied by deceleration. Its price fluctuated from 141.96 to 265.71, showing higher volatility at 31.92 std deviation.
Comparing both, Paycom Software, Inc. exhibited a larger negative price change, thus delivering the lower market performance relative to PTC Inc. over the past 12 months.
Target Prices
The target consensus from recognized analysts indicates promising upside potential for both PTC Inc. and Paycom Software, Inc.
| Company | Target High | Target Low | Consensus |
|---|---|---|---|
| PTC Inc. | 255 | 120 | 213.25 |
| Paycom Software, Inc. | 290 | 165 | 215 |
Analysts expect PTC’s stock to appreciate significantly from its current price of $166.75, while Paycom’s consensus target of $215 also suggests notable upside from $148.41. Both stocks show attractive potential relative to their current market prices.
Analyst Opinions Comparison
This section compares analysts’ ratings and grades for PTC Inc. and Paycom Software, Inc.:
Rating Comparison
PTC Rating
- Rating: B+ with a very favorable status.
- Discounted Cash Flow Score: 4, indicating a favorable valuation outlook.
- ROE Score: 4, showing favorable profit generation efficiency.
- ROA Score: 5, indicating very favorable asset utilization.
- Debt To Equity Score: 2, representing moderate financial risk.
- Overall Score: 3, classified as moderate overall financial standing.
PAYC Rating
- Rating: A with a very favorable status.
- Discounted Cash Flow Score: 5, reflecting a very favorable valuation outlook.
- ROE Score: 5, demonstrating very favorable profit generation efficiency.
- ROA Score: 5, indicating very favorable asset utilization.
- Debt To Equity Score: 4, indicating favorable financial risk management.
- Overall Score: 4, classified as favorable overall financial standing.
Which one is the best rated?
Based strictly on the provided ratings and scores, Paycom Software, Inc. holds the superior position with a higher overall score and stronger marks in discounted cash flow, ROE, and debt-to-equity, compared to PTC Inc.’s moderate overall rating and financial risk indicators.
Scores Comparison
Here is a comparison of the Altman Z-Score and Piotroski Score for PTC and PAYC:
PTC Scores
- Altman Z-Score: 5.67, indicating a safe zone with low bankruptcy risk.
- Piotroski Score: 8, classified as very strong financial health.
PAYC Scores
- Altman Z-Score: 3.84, indicating a safe zone with low bankruptcy risk.
- Piotroski Score: 5, classified as average financial health.
Which company has the best scores?
PTC shows stronger financial health with a higher Altman Z-Score and a very strong Piotroski Score compared to PAYC’s safe zone Altman Z-Score and average Piotroski Score.
Grades Comparison
Here is a comparison of the recent grades for PTC Inc. and Paycom Software, Inc.:
PTC Inc. Grades
The following table shows recent grades assigned by reputable grading companies for PTC Inc.:
| Grading Company | Action | New Grade | Date |
|---|---|---|---|
| Piper Sandler | Hold | Neutral | 2025-11-07 |
| Rosenblatt | Buy | Buy | 2025-11-06 |
| Rosenblatt | Buy | Buy | 2025-10-30 |
| Oppenheimer | Buy | Outperform | 2025-07-31 |
| Rosenblatt | Buy | Buy | 2025-07-31 |
| Barclays | Buy | Overweight | 2025-07-31 |
| Stifel | Buy | Buy | 2025-07-31 |
| Keybanc | Buy | Overweight | 2025-07-31 |
| RBC Capital | Buy | Outperform | 2025-07-31 |
| Piper Sandler | Hold | Neutral | 2025-07-31 |
PTC shows a strong bias toward buy and outperform ratings, with a few neutral opinions, indicating general analyst confidence.
Paycom Software, Inc. Grades
Below are recent grades from established grading firms for Paycom Software, Inc.:
| Grading Company | Action | New Grade | Date |
|---|---|---|---|
| Barclays | Hold | Equal Weight | 2026-01-12 |
| TD Cowen | Buy | Buy | 2026-01-08 |
| Citigroup | Hold | Neutral | 2025-12-23 |
| Keybanc | Buy | Overweight | 2025-11-06 |
| TD Cowen | Buy | Buy | 2025-11-06 |
| UBS | Buy | Buy | 2025-11-06 |
| Jefferies | Hold | Hold | 2025-11-06 |
| JP Morgan | Hold | Neutral | 2025-11-06 |
| Mizuho | Hold | Neutral | 2025-11-06 |
| Barclays | Hold | Equal Weight | 2025-11-06 |
Paycom’s grades reflect a more balanced outlook, combining several buy ratings with a significant number of hold or neutral opinions.
Which company has the best grades?
PTC Inc. holds a stronger overall consensus with 20 buy ratings versus Paycom’s 15, while Paycom has more hold ratings. This suggests PTC is viewed more favorably, which could influence investor sentiment toward growth potential and price appreciation.
Strengths and Weaknesses
Below is a comparison table highlighting key strengths and weaknesses of PTC Inc. and Paycom Software, Inc. based on their latest financial and operational data.
| Criterion | PTC Inc. | Paycom Software, Inc. |
|---|---|---|
| Diversification | Strong product mix: License $1.16B, Support & Cloud $1.47B, Tech Service $107M (2025) | Heavy reliance on recurring revenue $1.73B vs Implementation $24M (2024) |
| Profitability | Net margin 26.8%, ROIC 14.43%, ROE 19.18% (2025) – favorable but high P/E 33.2 | Net margin 26.7%, ROIC 24.86%, ROE 31.85% (2024) – very strong profitability |
| Innovation | Growing ROIC trend +42%, strong tech services growth | Growing ROIC trend +54%, strong recurring revenue growth |
| Global presence | Established global footprint, diversified revenue streams | Primarily US market focus but expanding recurring service base |
| Market Share | Solid position in industrial software with durable moat | Leading position in HR/payroll software with durable moat |
Key takeaways: Both companies demonstrate very favorable moats with growing profitability and strong return on capital. PTC benefits from a more diversified product portfolio globally, while Paycom excels in high-margin recurring revenue and superior ROIC. Investors should weigh diversification versus concentrated market leadership when choosing between these stocks.
Risk Analysis
Below is a comparative table outlining key risk factors for PTC Inc. and Paycom Software, Inc. based on their latest available data:
| Metric | PTC Inc. | Paycom Software, Inc. |
|---|---|---|
| Market Risk | Beta 1.01 – moderate market volatility exposure | Beta 0.82 – lower market volatility exposure |
| Debt level | Debt-to-Equity 0.36 – moderate leverage | Debt-to-Equity 0.05 – very low leverage |
| Regulatory Risk | Moderate – operates globally, subject to tech regulations | Moderate – US-focused, subject to US labor and data regulations |
| Operational Risk | Medium – complex product suite and global operations | Medium – SaaS model reliant on US market stability |
| Environmental Risk | Low – software company with limited environmental footprint | Low – cloud-based services, limited direct environmental impact |
| Geopolitical Risk | Moderate – global presence exposes to international risks | Low – primarily US market focus limits geopolitical exposure |
PTC faces moderate market and geopolitical risks due to its global footprint and moderate leverage, while Paycom benefits from lower debt and market risk but is more exposed to US regulatory changes. The most impactful risk for PTC is geopolitical uncertainty affecting international operations; for Paycom, regulatory compliance remains critical. Both maintain strong financial health, mitigating bankruptcy risk.
Which Stock to Choose?
PTC Inc. shows a favorable income evolution with a 19.18% revenue growth in 2025 and strong profitability metrics such as a 26.8% net margin and 19.18% ROE. Its debt levels are moderate with a net debt to EBITDA of about 1.05, and the overall rating is very favorable (B+).
Paycom Software, Inc. presents a solid income growth track record, with a 11.19% revenue increase in 2024 and excellent profitability, including a 26.66% net margin and 31.85% ROE. It maintains very low debt (net debt to EBITDA negative) and holds a very favorable overall rating (A).
Considering ratings and financial performance, Paycom’s higher ROE and lower debt might appeal to risk-tolerant or growth-focused investors, while PTC’s stable profitability and moderate leverage could be more attractive to those prioritizing quality and balanced risk. Both companies demonstrate strong competitive moats with growing ROIC, indicating durable advantages.
Disclaimer: Investment carries a risk of loss of initial capital. The past performance is not a reliable indicator of future results. Be sure to understand risks before making an investment decision.
Go Further
I encourage you to read the complete analyses of PTC Inc. and Paycom Software, Inc. to enhance your investment decisions: