In the dynamic world of software applications, PTC Inc. and PagerDuty, Inc. stand out as innovators shaping digital transformation and operations management. Both companies operate within the technology sector, offering cutting-edge solutions that address enterprise needs—from product lifecycle management to real-time incident response. Their shared focus on innovation and market overlap makes this comparison relevant for investors seeking growth and stability. Join me as we explore which company presents the most compelling opportunity for your investment portfolio.
Table of contents
Companies Overview
I will begin the comparison between PTC Inc. and PagerDuty, Inc. by providing an overview of these two companies and their main differences.
PTC Inc. Overview
PTC Inc. is a technology company specializing in software and services, operating globally across the Americas, Europe, and Asia Pacific. Its mission centers on enabling enterprises to digitally transform their businesses through platforms like ThingWorx and Vuforia, alongside product lifecycle and application lifecycle management solutions. Headquartered in Boston, PTC has a strong market presence with a market capitalization of $19.9B.
PagerDuty, Inc. Overview
PagerDuty, Inc. focuses on digital operations management through its machine-learning-powered platform, serving customers internationally, including in the U.S. and Japan. The company targets multiple industries by collecting and analyzing digital signals to predict and address operational issues. Founded in 2009 and based in San Francisco, PagerDuty has a market cap of $1.03B and is positioned as an innovator in real-time incident response.
Key similarities and differences
Both companies operate in the software application industry, providing technology solutions designed to optimize business operations. PTC offers a broad suite of product lifecycle and digital transformation tools, while PagerDuty concentrates on digital operations management with an emphasis on machine learning and incident prediction. PTC is significantly larger in market cap and employee count, reflecting its broader scope and global footprint compared to PagerDuty’s more focused platform and smaller scale.
Income Statement Comparison
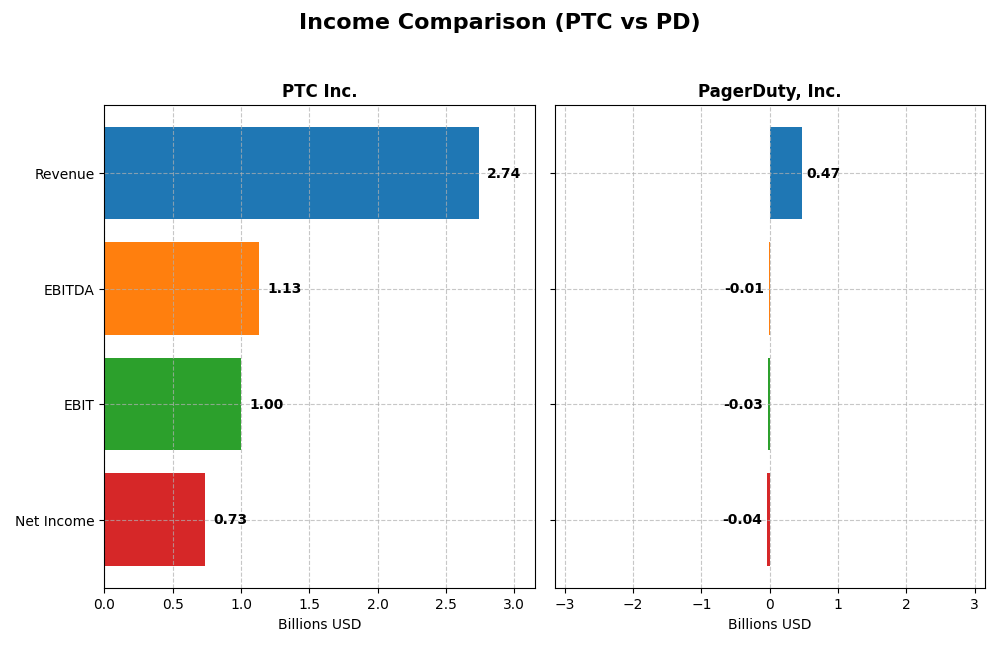
The table below presents a side-by-side comparison of key income statement metrics for PTC Inc. and PagerDuty, Inc. for the most recent fiscal year available.
| Metric | PTC Inc. | PagerDuty, Inc. |
|---|---|---|
| Market Cap | 19.9B | 1.03B |
| Revenue | 2.74B | 467.5M |
| EBITDA | 1.13B | -11.9M |
| EBIT | 997.2M | -32.5M |
| Net Income | 734.0M | -54.5M |
| EPS | 6.18 | -0.59 |
| Fiscal Year | 2025 | 2025 |
Income Statement Interpretations
PTC Inc.
From 2021 to 2025, PTC Inc. demonstrated strong and consistent growth in revenue and net income, with revenue rising from $1.81B to $2.74B and net income increasing from $477M to $734M. Margins remained robust, highlighted by a gross margin near 84% and a net margin of 26.8% in 2025. The latest year showed accelerated revenue growth of 19.2%, with net income nearly doubling, reflecting improved profitability and operational efficiency.
PagerDuty, Inc.
PagerDuty’s revenue grew significantly from $213M in 2021 to $467M in 2025, more than doubling over the period. However, net income remained negative, albeit with improving margins and narrowing losses, from -$69M in 2021 to -$43M in 2025. While gross margin stayed favorable at 83%, EBIT and net margins were negative, though they showed year-on-year improvements, signaling progress toward profitability in the most recent fiscal year.
Which one has the stronger fundamentals?
PTC exhibits stronger fundamentals with consistently positive and growing net income, high and stable margins, and favorable growth across key metrics. PagerDuty shows impressive revenue growth but continues to report net losses and negative EBIT margins, despite improvements. PTC’s income statement reflects greater profitability and operational strength, while PagerDuty remains in a growth phase with profitability challenges.
Financial Ratios Comparison
The table below presents the most recent key financial ratios for PTC Inc. and PagerDuty, Inc., reflecting their fiscal year 2025 performance.
| Ratios | PTC Inc. (2025) | PagerDuty, Inc. (2025) |
|---|---|---|
| ROE | 19.18% | -32.92% |
| ROIC | 14.43% | -9.66% |
| P/E | 33.19 | -39.87 |
| P/B | 6.37 | 13.12 |
| Current Ratio | 1.12 | 1.87 |
| Quick Ratio | 1.12 | 1.87 |
| D/E | 0.36 | 3.57 |
| Debt-to-Assets | 20.70% | 50.00% |
| Interest Coverage | 12.76 | -6.46 |
| Asset Turnover | 0.41 | 0.50 |
| Fixed Asset Turnover | 15.58 | 16.61 |
| Payout Ratio | 0% | 0% |
| Dividend Yield | 0% | 0% |
Interpretation of the Ratios
PTC Inc.
PTC Inc. shows mostly favorable financial ratios in 2025, with strong profitability metrics such as a 26.8% net margin, 19.18% ROE, and 14.43% ROIC. However, valuation multiples like a 33.19 P/E and 6.37 P/B are less attractive. The company does not pay dividends, reflecting a possible reinvestment focus. Its capital structure and liquidity ratios are generally sound.
PagerDuty, Inc.
PagerDuty exhibits several weak ratios in 2025, including a negative net margin of -9.14%, ROE of -32.92%, and ROIC of -9.66%, indicating losses and operational challenges. Its balance sheet shows higher leverage with a debt-to-equity of 3.57 and debt-to-assets of 50%. PagerDuty does not pay dividends, likely due to ongoing investments and negative earnings.
Which one has the best ratios?
PTC Inc. clearly outperforms PagerDuty in profitability, leverage, and overall financial health, supported by a higher percentage of favorable ratios (57.14% vs. 35.71%). PagerDuty’s unfavorable profitability and coverage ratios weigh down its profile despite some liquidity strengths. Thus, PTC holds the stronger ratio profile between the two.
Strategic Positioning
This section compares the strategic positioning of PTC Inc. and PagerDuty, Inc., including market position, key segments, and exposure to technological disruption:
PTC Inc.
- Large market cap of 19.9B USD with moderate competitive pressure in software applications.
- Diversified segments: License, Technology Service, Support and Cloud Services drive revenue growth.
- Utilizes AR and SaaS platforms like ThingWorx and Onshape, indicating moderate exposure to tech disruption.
PagerDuty, Inc.
- Smaller market cap of 1B USD, facing competitive pressure in digital operations software.
- Focused on digital operations management platform serving multiple industries globally.
- Leverages machine learning for digital signal processing, indicating higher tech disruption exposure.
PTC vs PagerDuty Positioning
PTC has a diversified business model with multiple software and service segments, providing stability but facing broad competition. PagerDuty is more concentrated on digital operations management, potentially more agile but with narrower revenue streams.
Which has the best competitive advantage?
PTC demonstrates a very favorable moat with ROIC significantly above WACC and growing profitability, indicating durable competitive advantage. PagerDuty has a slightly unfavorable moat, shedding value despite improving profitability.
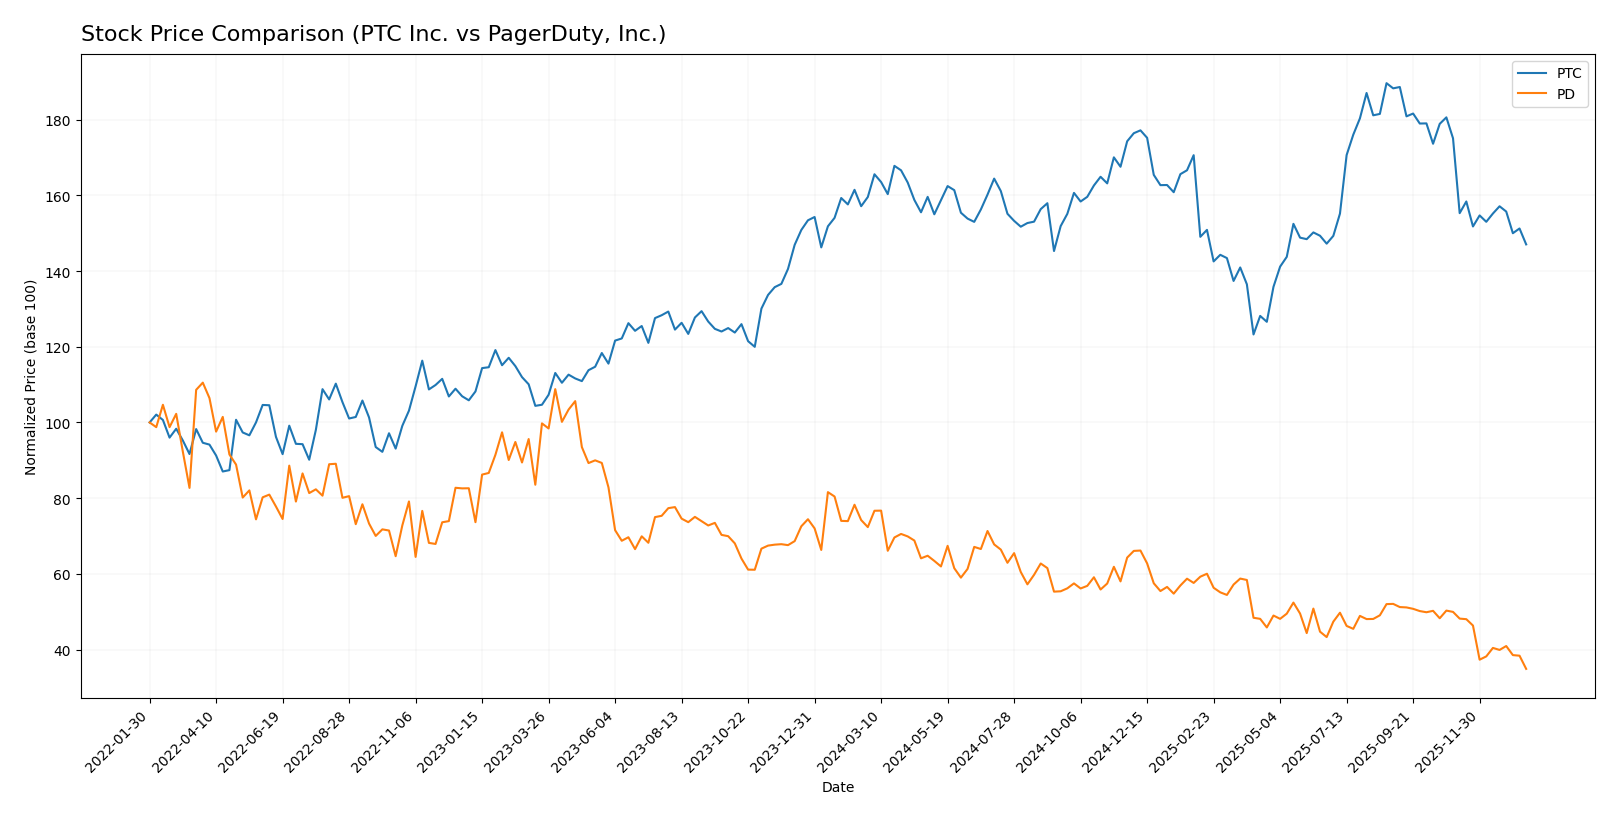
Stock Comparison
The stock price movements of PTC Inc. and PagerDuty, Inc. over the past year reveal significant bearish trends with notable declines and varying volume dynamics, highlighting distinct trading pressures and decelerating momentum.
Trend Analysis
PTC Inc. experienced a bearish trend with a -7.84% price change over the past 12 months, showing deceleration and high volatility with a standard deviation of 15.47. The stock ranged from a high of 215.05 to a low of 139.77.
PagerDuty, Inc. showed a more pronounced bearish trend with a -51.76% price change over the same period, also decelerating but with lower volatility (std deviation 2.92). Its price fluctuated between 24.66 and 11.22.
Comparing both stocks, PTC Inc. delivered the higher market performance with a smaller price decline over the past year, while PagerDuty faced a steeper drop in value.
Target Prices
Analysts provide a clear target price consensus for both PTC Inc. and PagerDuty, Inc., reflecting their growth expectations.
| Company | Target High | Target Low | Consensus |
|---|---|---|---|
| PTC Inc. | 255 | 120 | 213.25 |
| PagerDuty, Inc. | 19 | 15 | 16.2 |
The consensus target for PTC Inc. at 213.25 significantly exceeds its current price of 166.75, indicating positive analyst sentiment. PagerDuty’s consensus target of 16.2 also suggests upside potential from its current 11.22 price.
Analyst Opinions Comparison
This section compares analysts’ ratings and grades for PTC Inc. and PagerDuty, Inc.:
Rating Comparison
PTC Rating
- Rating: B+, considered very favorable overall
- Discounted Cash Flow Score: 4, favorable
- ROE Score: 4, favorable
- ROA Score: 5, very favorable
- Debt To Equity Score: 2, moderate
- Overall Score: 3, moderate
PD Rating
- Rating: A-, considered very favorable overall
- Discounted Cash Flow Score: 5, very favorable
- ROE Score: 5, very favorable
- ROA Score: 5, very favorable
- Debt To Equity Score: 1, very unfavorable
- Overall Score: 4, favorable
Which one is the best rated?
Based strictly on the provided data, PagerDuty, Inc. has higher scores in discounted cash flow, ROE, ROA, and overall score, but a very unfavorable debt to equity score compared to PTC Inc.’s moderate rating in debt to equity. Overall, PagerDuty holds a better rating profile.
Scores Comparison
Here is a comparison of the financial stability and strength scores for PTC and PagerDuty:
PTC Scores
- Altman Z-Score: 5.67, indicating a safe zone with low bankruptcy risk.
- Piotroski Score: 8, reflecting very strong financial health.
PagerDuty Scores
- Altman Z-Score: 1.26, indicating distress zone with high bankruptcy risk.
- Piotroski Score: 7, reflecting strong financial health.
Which company has the best scores?
PTC shows superior scores with a safe zone Altman Z-Score of 5.67 and a very strong Piotroski score of 8, while PagerDuty is in distress zone for Altman and has a slightly lower Piotroski score of 7.
Grades Comparison
Here is the comparison of recent grades and ratings for PTC Inc. and PagerDuty, Inc.:
PTC Inc. Grades
The following table summarizes recent grades from reputable grading companies for PTC Inc.:
| Grading Company | Action | New Grade | Date |
|---|---|---|---|
| Piper Sandler | Maintain | Neutral | 2025-11-07 |
| Rosenblatt | Maintain | Buy | 2025-11-06 |
| Rosenblatt | Maintain | Buy | 2025-10-30 |
| Oppenheimer | Maintain | Outperform | 2025-07-31 |
| Rosenblatt | Maintain | Buy | 2025-07-31 |
| Barclays | Maintain | Overweight | 2025-07-31 |
| Stifel | Maintain | Buy | 2025-07-31 |
| Keybanc | Maintain | Overweight | 2025-07-31 |
| RBC Capital | Maintain | Outperform | 2025-07-31 |
| Piper Sandler | Maintain | Neutral | 2025-07-31 |
PTC Inc. has maintained predominantly positive grades, with multiple Buy and Outperform ratings alongside a few Neutral assessments.
PagerDuty, Inc. Grades
Below is a summary of recent grades from credible grading firms for PagerDuty, Inc.:
| Grading Company | Action | New Grade | Date |
|---|---|---|---|
| Truist Securities | Maintain | Buy | 2026-01-07 |
| RBC Capital | Downgrade | Sector Perform | 2026-01-05 |
| TD Cowen | Maintain | Buy | 2025-11-26 |
| Craig-Hallum | Downgrade | Hold | 2025-11-26 |
| Morgan Stanley | Maintain | Equal Weight | 2025-11-26 |
| RBC Capital | Maintain | Outperform | 2025-11-26 |
| Truist Securities | Maintain | Buy | 2025-11-19 |
| Baird | Maintain | Neutral | 2025-09-04 |
| RBC Capital | Maintain | Outperform | 2025-09-04 |
| Canaccord Genuity | Maintain | Buy | 2025-09-04 |
PagerDuty shows a mixed grading pattern with recent downgrades to Sector Perform and Hold but also retains several Buy and Outperform ratings.
Which company has the best grades?
PTC Inc. has consistently received stronger and more stable grades, mostly Buy and Outperform, indicating higher analyst confidence. PagerDuty’s grades are more mixed with recent downgrades, suggesting greater uncertainty. This contrast may influence investors’ perception of risk and growth potential differently for each company.
Strengths and Weaknesses
Below is a comparison of key strengths and weaknesses for PTC Inc. and PagerDuty, Inc. based on the most recent financial and strategic data.
| Criterion | PTC Inc. | PagerDuty, Inc. |
|---|---|---|
| Diversification | Strong revenue mix: License (1.16B), Support & Cloud Services (1.47B), Technology Services (107M) | Limited product diversification; primarily incident response platform |
| Profitability | High net margin (26.8%), ROIC 14.4%, ROE 19.2% – favorable and growing | Negative net margin (-9.1%), ROIC -9.7%, ROE -32.9% – loss-making but improving ROIC |
| Innovation | Consistent investment in technology services and cloud support | Focused on innovation in incident management but limited scale |
| Global presence | Established international footprint with diversified client base | Smaller global reach, mainly US-centric |
| Market Share | Solid market position with durable competitive advantage (ROIC > WACC by 6.1%) | Weaker market position, value destroying (ROIC < WACC by -15.5%) but improving |
Key takeaways: PTC shows a durable competitive advantage with strong profitability and diversified revenues, making it a value creator. PagerDuty, while currently unprofitable and value-destroying, demonstrates improving profitability trends and potential for growth but carries higher risk.
Risk Analysis
Below is a comparative table of key risks for PTC Inc. and PagerDuty, Inc. based on the most recent 2025 data:
| Metric | PTC Inc. | PagerDuty, Inc. |
|---|---|---|
| Market Risk | Moderate (Beta 1.01) | Lower (Beta 0.63) |
| Debt Level | Low (D/E 0.36) | High (D/E 3.57) |
| Regulatory Risk | Moderate | Moderate |
| Operational Risk | Moderate | Elevated (smaller size, rapid growth) |
| Environmental Risk | Low | Low |
| Geopolitical Risk | Moderate | Moderate |
PTC’s financial stability is strong with low debt and favorable profitability, reducing its risk profile. PagerDuty faces higher financial risk due to significant leverage and negative profitability, making it more vulnerable in downturns. The most impactful risks for PagerDuty are its high debt and operational challenges amid growth pressures.
Which Stock to Choose?
PTC Inc. shows a favorable income evolution with a 19.18% revenue growth in 2025 and strong profitability metrics, including a 26.8% net margin and 19.18% ROE. Its financial ratios are mostly favorable, supported by low debt levels (debt-to-equity 0.36) and a solid rating of B+ indicating very favorable financial health.
PagerDuty, Inc. presents a mixed picture with positive revenue growth of 8.54% in 2025 but negative profitability ratios, including a -9.14% net margin and -32.92% ROE. Its financial ratios are largely unfavorable, burdened by high debt (debt-to-equity 3.57) and a rating of A- reflecting some favorable aspects but marked by financial risk.
Considering ratings and comprehensive evaluations, PTC’s strong income statement and mostly favorable ratios suggest it might be more suitable for investors seeking quality and value creation. PagerDuty’s profile could appeal to risk-tolerant investors focused on growth potential despite current profitability challenges.
Disclaimer: Investment carries a risk of loss of initial capital. The past performance is not a reliable indicator of future results. Be sure to understand risks before making an investment decision.
Go Further
I encourage you to read the complete analyses of PTC Inc. and PagerDuty, Inc. to enhance your investment decisions: