In the dynamic world of software applications, PTC Inc. and monday.com Ltd. stand out as innovators shaping business operations globally. PTC, with its strong focus on digital transformation and product lifecycle management, contrasts with monday.com’s cloud-based visual work operating system that streamlines project and workflow management. Both companies compete in overlapping markets with distinct innovation strategies, offering investors intriguing opportunities. This article will help you decide which company holds the most promise for your investment portfolio.

Table of contents
Companies Overview
I will begin the comparison between PTC and monday.com by providing an overview of these two companies and their main differences.
PTC Overview
PTC Inc. is a technology company headquartered in Boston, Massachusetts, operating primarily in software and services across the Americas, Europe, and Asia Pacific. Its mission focuses on enabling enterprises to digitally transform their businesses with platforms like ThingWorx and Vuforia, alongside product development and lifecycle management software, aiming to accelerate time to value through scalable and innovative solutions.
monday.com Overview
monday.com Ltd. is an Israel-based technology company specializing in cloud-based work operating systems designed to enhance work management through modular applications. Serving organizations globally, monday.com’s software supports marketing, CRM, project management, and software development, delivering customizable solutions that improve collaboration and operational efficiency across diverse sectors including education and government.
Key similarities and differences
Both PTC and monday.com operate in the software application industry with a focus on digital transformation and enhancing work processes. PTC emphasizes product lifecycle management and industrial digital solutions, while monday.com centers on cloud-based work management and modular software applications. Their geographic footprints differ, with PTC’s presence stronger in the Americas and Asia Pacific, and monday.com focused more broadly on international markets including Europe and the Middle East.
Income Statement Comparison
The table below presents a side-by-side comparison of the most recent fiscal year income statement metrics for PTC Inc. and monday.com Ltd., providing a clear view of their financial performance in 2025 and 2024 respectively.
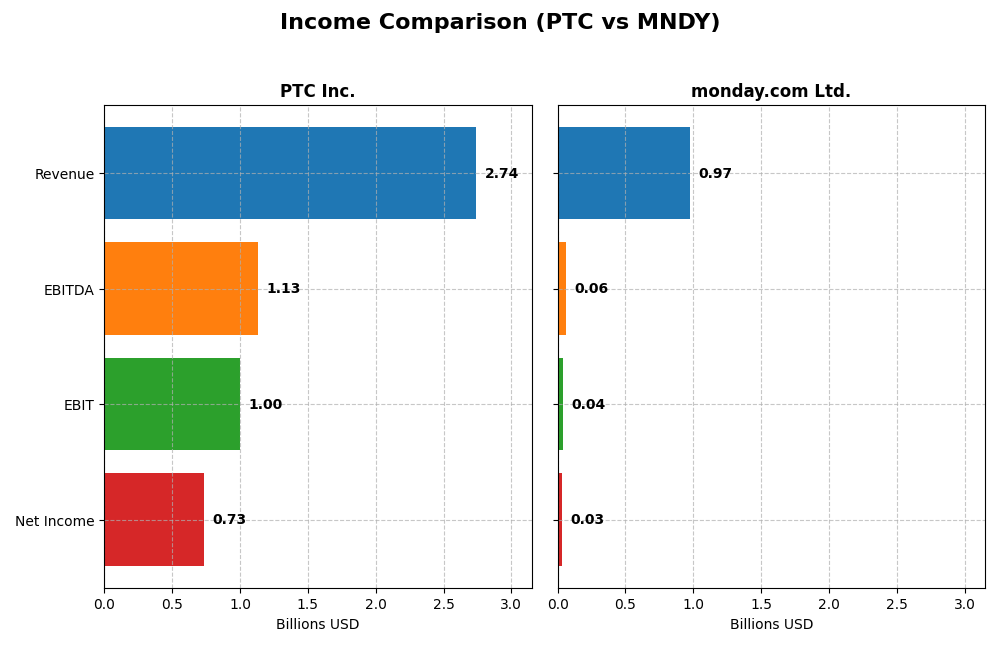
| Metric | PTC Inc. (2025) | monday.com Ltd. (2024) |
|---|---|---|
| Market Cap | 19.9B | 6.5B |
| Revenue | 2.74B | 972M |
| EBITDA | 1.13B | 58M |
| EBIT | 997M | 40M |
| Net Income | 734M | 32M |
| EPS | 6.18 | 0.65 |
| Fiscal Year | 2025 | 2024 |
Income Statement Interpretations
PTC Inc.
PTC Inc. demonstrated steady revenue growth from $1.81B in 2021 to $2.74B in 2025, with net income rising from $477M to $734M. Margins remained robust, with gross margin around 83.8% and net margin near 26.8%. The latest year showed strong acceleration in net income and EPS growth, indicating improved profitability and operational efficiency.
monday.com Ltd.
monday.com Ltd. experienced rapid revenue expansion from $161M in 2020 to $972M in 2024, alongside a turnaround from a net loss of $152M to a net income of $32M. Gross margins stayed high at about 89.3%, while EBIT and net margins remained low but improved significantly. The recent year featured substantial growth in net margin and EPS, reflecting operational progress.
Which one has the stronger fundamentals?
PTC shows stronger profitability with high and stable margins, solid net income, and consistent growth, reflecting mature fundamentals. monday.com, while growing faster and improving margins from losses, still has lower profitability metrics. Both have favorable income evaluations, but PTC’s financial metrics suggest more established and resilient fundamentals.
Financial Ratios Comparison
This table presents a side-by-side comparison of key financial ratios for PTC Inc. and monday.com Ltd. based on their most recent fiscal year data to aid in objective analysis.
| Ratios | PTC Inc. (2025) | monday.com Ltd. (2024) |
|---|---|---|
| ROE | 19.18% | 3.14% |
| ROIC | 14.43% | -1.73% |
| P/E | 33.19 | 362.98 |
| P/B | 6.37 | 11.41 |
| Current Ratio | 1.12 | 2.66 |
| Quick Ratio | 1.12 | 2.66 |
| D/E | 0.36 | 0.10 |
| Debt-to-Assets | 20.70% | 6.29% |
| Interest Coverage | 12.76 | 0 |
| Asset Turnover | 0.41 | 0.58 |
| Fixed Asset Turnover | 15.58 | 7.13 |
| Payout Ratio | 0 | 0 |
| Dividend Yield | 0 | 0 |
Interpretation of the Ratios
PTC Inc.
PTC displays strong profitability with a 26.8% net margin, 19.18% ROE, and 14.43% ROIC, all favorable, though its valuation ratios such as PE at 33.19 and PB at 6.37 are unfavorable. Liquidity is adequate, with a current ratio of 1.12 and a solid debt profile. PTC does not pay dividends, likely prioritizing reinvestment and growth instead.
monday.com Ltd.
monday.com shows weaker profitability, with low net margin at 3.33%, ROE at 3.14%, and negative ROIC, all unfavorable. However, its liquidity ratios are strong, current and quick ratios both at 2.66, with low debt levels and excellent interest coverage. The company does not pay dividends, reflecting a growth focus and reinvestment strategy.
Which one has the best ratios?
PTC has a more favorable overall ratio profile, with stronger profitability metrics and a balanced capital structure despite some valuation concerns. monday.com’s liquidity and leverage ratios are solid, but profitability and valuation remain weak, resulting in a more neutral assessment compared to PTC’s favorable standing.
Strategic Positioning
This section compares the strategic positioning of PTC Inc. and monday.com Ltd., focusing on Market position, Key segments, and Exposure to technological disruption:
PTC Inc.
- Established software leader with strong market cap, moderate beta, facing competitive pressure in application software.
- Key segments include License, Support and Cloud Services, and Technology Services driving revenue growth.
- Exposure through innovative platforms like ThingWorx, Vuforia, and Onshape supporting digital transformation and AR.
monday.com Ltd.
- Smaller market cap with higher beta, competing in cloud-based work management software globally.
- Focused on Work OS platform for work management, marketing, CRM, and software development solutions.
- Cloud-based modular software faces disruption risk but aims for flexible work application development.
PTC Inc. vs monday.com Ltd. Positioning
PTC presents a diversified software portfolio spanning licensing and cloud services, supporting digital industrial transformation, while monday.com concentrates on cloud-based work management tools with modular applications, reflecting different approaches to market focus and innovation scope.
Which has the best competitive advantage?
PTC shows a very favorable moat with strong value creation and growing ROIC, indicating durable competitive advantage, whereas monday.com has a slightly unfavorable moat, shedding value despite improving profitability.
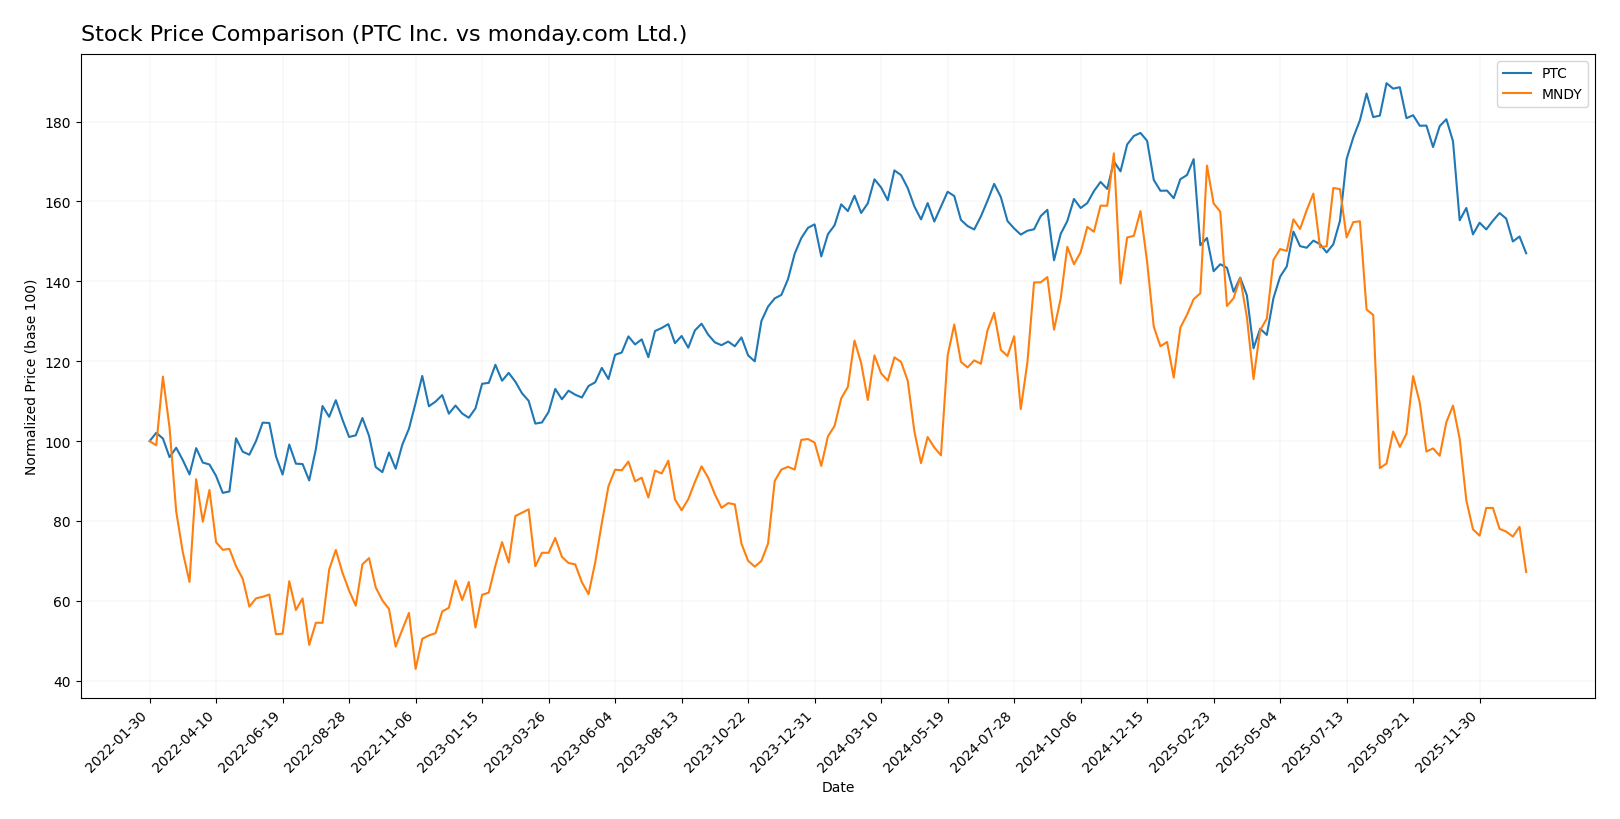
Stock Comparison
The stock prices of PTC Inc. and monday.com Ltd. have exhibited significant bearish trends over the past 12 months, with marked declines and decelerating momentum in both cases. Trading volumes have generally increased, though recent buyer dominance weakened notably.
Trend Analysis
PTC Inc. experienced a bearish trend over the past year with a -7.84% price change and decelerating downward momentum. The stock’s volatility is moderate, with a standard deviation of 15.47, peaking at 215.05 and dipping to 139.77.
monday.com Ltd. showed a stronger bearish trend with a -39.06% decline over the same period, also decelerating. Its volatility is higher, marked by a 47.32 standard deviation, with a high of 324.31 and a low of 126.7.
Comparing both, PTC Inc. delivered the highest market performance, with a significantly smaller price decline than monday.com Ltd. over the past year.
Target Prices
The target price consensus from analysts indicates a positive outlook for both PTC Inc. and monday.com Ltd.
| Company | Target High | Target Low | Consensus |
|---|---|---|---|
| PTC Inc. | 255 | 120 | 213.25 |
| monday.com Ltd. | 330 | 194 | 264.42 |
Analysts expect notable upside potential for PTC Inc. and monday.com Ltd., with consensus targets significantly above their current prices of 166.75 and 126.7 respectively, suggesting growth opportunities ahead.
Analyst Opinions Comparison
This section compares analysts’ ratings and grades for PTC Inc. and monday.com Ltd.:
Rating Comparison
PTC Rating
- Rating: B+ indicating a very favorable overall evaluation
- Discounted Cash Flow Score: 4, a favorable score reflecting solid future cash flow projections
- ROE Score: 4, favorable indicating efficient profit generation from shareholders’ equity
- ROA Score: 5, very favorable reflecting excellent asset utilization
- Debt To Equity Score: 2, moderate indicating moderate financial risk
- Overall Score: 3, moderate reflecting balanced financial standing
monday.com Rating
- Rating: B- also indicating a very favorable overall evaluation
- Discounted Cash Flow Score: 4, a favorable score reflecting solid future cash flow projections
- ROE Score: 3, moderate indicating average efficiency in generating shareholder profits
- ROA Score: 3, moderate reflecting average asset utilization
- Debt To Equity Score: 3, moderate indicating moderate financial risk
- Overall Score: 3, moderate reflecting balanced financial standing
Which one is the best rated?
Based strictly on the data, PTC holds a higher rating (B+) compared to monday.com’s B-, with stronger ROE and ROA scores and a slightly lower debt to equity risk, indicating a marginally better financial profile.
Scores Comparison
Here is a comparison of the Altman Z-Score and Piotroski Score for PTC and monday.com:
PTC Scores
- Altman Z-Score: 5.67, indicating a safe zone
- Piotroski Score: 8, classified as very strong
monday.com Scores
- Altman Z-Score: 6.33, indicating a safe zone
- Piotroski Score: 5, classified as average
Which company has the best scores?
Both companies are in the safe zone according to the Altman Z-Score, with monday.com slightly higher. However, PTC shows a stronger financial health with a very strong Piotroski Score of 8, compared to monday.com’s average score of 5.
Grades Comparison
Here is a detailed comparison of the latest grades for PTC Inc. and monday.com Ltd.:
PTC Inc. Grades
This table summarizes recent analyst grades from verified financial institutions for PTC Inc.:
| Grading Company | Action | New Grade | Date |
|---|---|---|---|
| Piper Sandler | Maintain | Neutral | 2025-11-07 |
| Rosenblatt | Maintain | Buy | 2025-11-06 |
| Rosenblatt | Maintain | Buy | 2025-10-30 |
| Oppenheimer | Maintain | Outperform | 2025-07-31 |
| Rosenblatt | Maintain | Buy | 2025-07-31 |
| Barclays | Maintain | Overweight | 2025-07-31 |
| Stifel | Maintain | Buy | 2025-07-31 |
| Keybanc | Maintain | Overweight | 2025-07-31 |
| RBC Capital | Maintain | Outperform | 2025-07-31 |
| Piper Sandler | Maintain | Neutral | 2025-07-31 |
PTC Inc. has a majority of Buy and Outperform grades, with a few Neutral ratings, reflecting a generally positive but cautious outlook.
monday.com Ltd. Grades
Below are the recent analyst grades from reputable firms for monday.com Ltd.:
| Grading Company | Action | New Grade | Date |
|---|---|---|---|
| BTIG | Maintain | Buy | 2026-01-15 |
| Barclays | Maintain | Overweight | 2026-01-12 |
| Jefferies | Maintain | Buy | 2026-01-05 |
| Citigroup | Maintain | Buy | 2025-12-23 |
| Tigress Financial | Maintain | Buy | 2025-12-11 |
| Baird | Maintain | Outperform | 2025-11-11 |
| Wells Fargo | Maintain | Overweight | 2025-11-11 |
| DA Davidson | Maintain | Buy | 2025-11-11 |
| Morgan Stanley | Maintain | Overweight | 2025-11-11 |
| Piper Sandler | Maintain | Overweight | 2025-11-11 |
monday.com Ltd. displays a strong consensus with predominantly Buy and Overweight ratings, suggesting solid analyst confidence.
Which company has the best grades?
Both companies have a consensus rating of “Buy,” but monday.com Ltd. holds a higher proportion of Buy and Overweight grades with fewer Hold ratings, indicating stronger analyst enthusiasm. This may influence investor sentiment regarding growth potential and risk assessment.
Strengths and Weaknesses
Below is a comparative overview of key strengths and weaknesses for PTC Inc. and monday.com Ltd. based on the latest financial and operational data.
| Criterion | PTC Inc. | monday.com Ltd. |
|---|---|---|
| Diversification | Strong revenue mix: License, Technology Service, Support and Cloud Services. | Less diversified, focused on cloud-based collaboration. |
| Profitability | High net margin (26.8%) and ROIC (14.43%) indicating strong profitability. | Low net margin (3.33%) and negative ROIC (-1.73%), currently unprofitable. |
| Innovation | Demonstrates durable competitive advantage with growing ROIC (+42%) and strong cloud service growth. | Improving ROIC trend (+99%), signaling rising innovation but still value-destructive. |
| Global presence | Established global footprint with robust tech and service offerings. | Growing international reach but smaller scale than PTC. |
| Market Share | Significant share in industrial software and cloud services markets. | Emerging player in collaboration software with increasing market penetration. |
Key takeaways: PTC Inc. stands out for its solid profitability, diversification, and sustained competitive moat, making it a value creator. monday.com Ltd. shows promise with rapid ROIC improvement and innovation but remains less profitable and riskier due to ongoing value destruction. Investors should weigh PTC’s stability against monday.com’s growth potential and higher risk.
Risk Analysis
Below is a comparison of key risks for PTC Inc. and monday.com Ltd. based on the most recent financial and operational data.
| Metric | PTC Inc. | monday.com Ltd. |
|---|---|---|
| Market Risk | Moderate beta 1.01, stable with NASDAQ exposure | Higher beta 1.26, more volatile market sensitivity |
| Debt level | Moderate debt-to-equity 0.36, manageable leverage | Low debt-to-equity 0.10, conservative financial structure |
| Regulatory Risk | US-based, subject to mature market regulations | Israel-based, potential exposure to complex international regulations |
| Operational Risk | Diversified software portfolio, stable operations | Rapid growth phase, higher operational scaling risk |
| Environmental Risk | Limited direct impact, software industry | Limited direct impact, software industry |
| Geopolitical Risk | Moderate, US-centric operations | Higher, due to Israel location and international markets |
PTC’s most impactful risks include moderate market volatility and regulatory exposure in the US tech sector, though its strong financial health mitigates debt risk. monday.com faces higher market and geopolitical risks due to its Israeli base and growth phase challenges, despite low debt. Investors should weigh these factors carefully for portfolio risk management.
Which Stock to Choose?
PTC Inc. shows a favorable income evolution with strong revenue and net income growth, supported by robust profitability and a solid debt profile. Its financial ratios are mostly favorable, reflecting efficient capital use and a very favorable rating of B+.
monday.com Ltd. presents a favorable income growth trend but with lower profitability and some financial ratios marked as unfavorable. The company maintains a low debt level and a very favorable rating of B-, though its value creation ability is slightly unfavorable.
For investors prioritizing stability and durable value creation, PTC’s very favorable moat and strong financial metrics might appear more aligned with those goals. Conversely, growth-oriented investors might find monday.com’s rapid income expansion and improving profitability potentially appealing, despite its current financial challenges.
Disclaimer: Investment carries a risk of loss of initial capital. The past performance is not a reliable indicator of future results. Be sure to understand risks before making an investment decision.
Go Further
I encourage you to read the complete analyses of PTC Inc. and monday.com Ltd. to enhance your investment decisions: