In the dynamic world of technology software, PTC Inc. and Bentley Systems, Incorporated stand out as key players with overlapping markets in application software for engineering and infrastructure. Both companies emphasize innovation through digital transformation and advanced modeling solutions, targeting a global client base. This comparison will explore which company presents the most compelling investment opportunity for your portfolio in 2026. Let’s analyze their strengths to guide your decision-making.
Table of contents
Companies Overview
I will begin the comparison between PTC Inc. and Bentley Systems, Incorporated by providing an overview of these two companies and their main differences.
PTC Inc. Overview
PTC Inc. operates as a software and services company across the Americas, Europe, and Asia Pacific. It focuses on digital transformation solutions with products like ThingWorx and Vuforia, enabling enterprises to innovate and accelerate value delivery. PTC also offers CAD, PLM, and lifecycle management software, serving a broad range of industrial and design needs from its Boston headquarters.
Bentley Systems, Incorporated Overview
Bentley Systems provides infrastructure engineering software solutions worldwide, including open modeling, simulation, and project delivery systems. Its offerings target civil, structural, geotechnical, and geospatial professionals, supporting infrastructure design, construction, and asset performance. Headquartered in Exton, Pennsylvania, Bentley emphasizes collaboration and specialized industry applications.
Key similarities and differences
Both companies operate in the technology software sector, focusing on application software for engineering and design. PTC centers on digital transformation and product lifecycle management, while Bentley targets infrastructure engineering and project delivery. Each serves global markets with complementary yet distinct product portfolios, and both emphasize scalable, collaborative solutions within their respective domains.
Income Statement Comparison
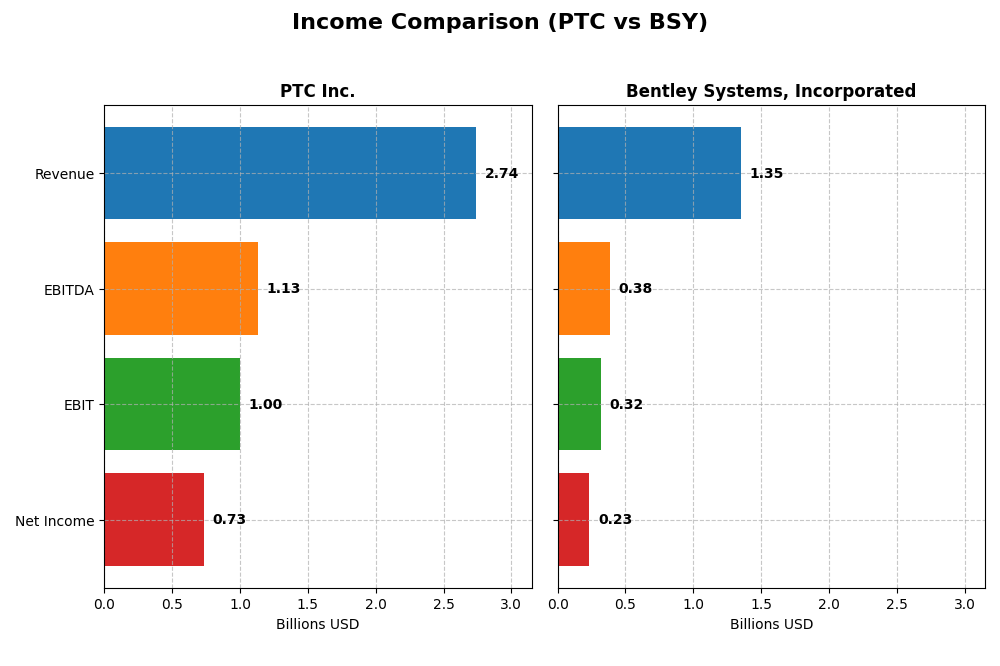
This table presents a side-by-side comparison of the latest income statement metrics for PTC Inc. and Bentley Systems, Incorporated, reflecting their financial performance in the most recent fiscal year.
| Metric | PTC Inc. | Bentley Systems, Incorporated |
|---|---|---|
| Market Cap | 20.4B | 11.1B |
| Revenue | 2.74B | 1.35B |
| EBITDA | 1.13B | 382M |
| EBIT | 997M | 318M |
| Net Income | 734M | 242M |
| EPS | 6.18 | 0.75 |
| Fiscal Year | 2025 | 2024 |
Income Statement Interpretations
PTC Inc.
From 2021 to 2025, PTC Inc. demonstrated consistent revenue growth, rising from $1.81B to $2.74B, with net income increasing substantially from $477M to $734M. Margins remained robust, with gross margin at 83.76% and net margin at 26.8% in 2025. The most recent year saw strong growth in revenue (+19.18%) and net income (+63.66%), reflecting improved profitability and operational efficiency.
Bentley Systems, Incorporated
Bentley’s revenue grew steadily from $965M in 2020 to $1.35B in 2024, with net income increasing from $127M to $235M over the same period. Margins were favorable, with a gross margin of 80.95% and net margin of 17.35% in 2024. However, despite a 10.15% revenue growth in the latest year, net margin and EPS declined, indicating some pressure on profitability despite overall positive trends.
Which one has the stronger fundamentals?
PTC shows stronger fundamentals with higher and improving margins, significant net income growth, and favorable profitability metrics sustained over five years. Bentley exhibits solid revenue and net income growth but faces challenges in margin stability and recent EPS decline. Overall, PTC’s income statement metrics suggest more consistent operational performance and margin control.
Financial Ratios Comparison
The table below presents a side-by-side comparison of key financial ratios for PTC Inc. and Bentley Systems, Incorporated, reflecting their most recent fiscal year data.
| Ratios | PTC Inc. (2025) | Bentley Systems (2024) |
|---|---|---|
| ROE | 19.18% | 22.55% |
| ROIC | 14.43% | 9.30% |
| P/E | 33.19 | 62.63 |
| P/B | 6.37 | 14.13 |
| Current Ratio | 1.12 | 0.54 |
| Quick Ratio | 1.12 | 0.54 |
| D/E | 0.36 | 1.37 |
| Debt-to-Assets | 20.70% | 41.96% |
| Interest Coverage | 12.76 | 12.20 |
| Asset Turnover | 0.41 | 0.40 |
| Fixed Asset Turnover | 15.58 | 20.47 |
| Payout ratio | 0% | 30.72% |
| Dividend yield | 0% | 0.49% |
Interpretation of the Ratios
PTC Inc.
PTC Inc. shows a generally favorable set of financial ratios with strong net margin at 26.8% and return on equity of 19.18%, indicating solid profitability and efficient capital use. However, valuation multiples like PE at 33.19 and PB at 6.37 are considered unfavorable, suggesting the stock might be relatively expensive. The company does not pay dividends, likely focusing on reinvestment and growth.
Bentley Systems, Incorporated
Bentley Systems exhibits mixed financial ratios, with favorable net margin at 17.35% and return on equity at 22.55%, but weaker liquidity indicated by a current ratio of 0.54 and a high debt-to-equity ratio of 1.37. Its PE ratio is high at 62.63, reflecting elevated valuation concerns. Bentley pays a small dividend yield of 0.49%, though this is marked unfavorable due to valuation pressures.
Which one has the best ratios?
PTC Inc. holds the advantage with a higher proportion of favorable ratios (57.14%) and a global favorable opinion, supported by better liquidity and debt management metrics. Bentley Systems, despite strong profitability, faces challenges in liquidity and leverage, reflected in a slightly unfavorable overall ratio evaluation. Thus, PTC’s ratios present a comparatively stronger financial profile.
Strategic Positioning
This section compares the strategic positioning of PTC and BSY, including market position, key segments, and exposure to disruption:
PTC
- Leading in software applications with moderate beta of 1.03; faces competitive tech industry pressures.
- Generates revenue mainly from licenses and cloud services; key drivers include ThingWorx, Vuforia, Onshape platforms.
- Invests in digital transformation, AR visualization, SaaS platforms; moderate exposure to rapid tech shifts.
BSY
- Focused on infrastructure engineering software with higher beta of 1.23; operates in competitive niche markets.
- Revenue driven by subscriptions, licenses, and professional services; offers broad infrastructure engineering solutions.
- Provides open modeling, simulation, and project delivery software; exposed to evolving infrastructure tech demands.
PTC vs BSY Positioning
PTC adopts a diversified software portfolio spanning digital transformation and product lifecycle management, supporting scalable growth. BSY concentrates on infrastructure engineering solutions with a focus on collaboration tools and asset performance, which may limit diversification but deepens industry expertise.
Which has the best competitive advantage?
PTC demonstrates a very favorable moat with growing ROIC well above WACC, indicating durable competitive advantage and value creation. BSY shows a slightly unfavorable moat with declining ROIC, suggesting challenges in sustaining profitability and competitive advantage.
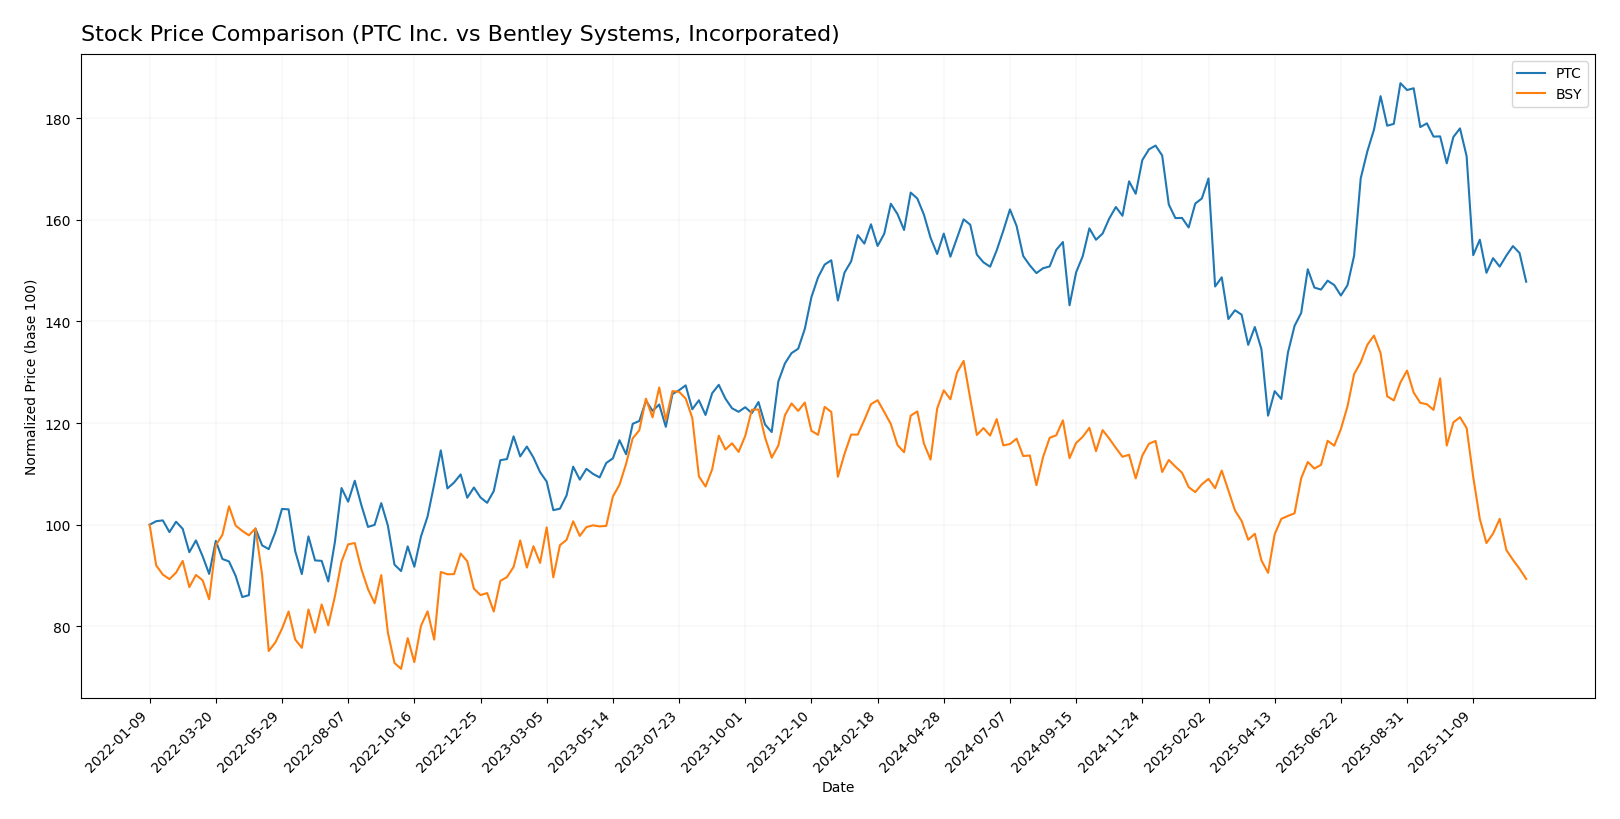
Stock Comparison
The stock price movements of PTC Inc. and Bentley Systems, Incorporated over the past year reveal distinct bearish trends with varying degrees of decline and trading volume dynamics.
Trend Analysis
PTC Inc. experienced a 7.1% price decline over the past 12 months, indicating a bearish trend with deceleration. The stock showed notable volatility with a standard deviation of 15.38 and a price range from 139.77 to 215.05.
Bentley Systems, Incorporated’s stock fell by 27.79% over the same period, also reflecting a bearish trend with deceleration. It exhibited lower volatility with a standard deviation of 4.48 and traded between 38.15 and 58.59.
Comparatively, PTC Inc. outperformed Bentley Systems with a smaller percentage loss, indicating a less severe market decline over the past year.
Target Prices
Analysts present a clear consensus on target prices for PTC Inc. and Bentley Systems, Incorporated, indicating potential upside from current levels.
| Company | Target High | Target Low | Consensus |
|---|---|---|---|
| PTC Inc. | 255 | 120 | 213.25 |
| Bentley Systems, Incorporated | 64 | 57 | 60.5 |
The consensus target prices suggest that PTC’s shares could rise significantly above the current price of 170.1 USD, while Bentley Systems also shows upside potential from its current 38.15 USD, reflecting optimistic analyst expectations.
Analyst Opinions Comparison
This section compares analysts’ ratings and grades for PTC Inc. and Bentley Systems, Incorporated:
Rating Comparison
PTC Inc. Rating
- Rating: B+ indicating a very favorable assessment of financial standing.
- Discounted Cash Flow Score: 4, considered favorable for valuation assessment.
- ROE Score: 4, favorable efficiency in generating profit from equity.
- ROA Score: 5, very favorable utilization of assets to generate earnings.
- Debt To Equity Score: 2, moderate financial risk indicating some leverage.
- Overall Score: 3, moderate overall financial standing.
Bentley Systems, Incorporated Rating
- Rating: B- indicating a very favorable assessment of financial standing.
- Discounted Cash Flow Score: 4, considered favorable for valuation assessment.
- ROE Score: 4, favorable efficiency in generating profit from equity.
- ROA Score: 4, favorable utilization of assets to generate earnings.
- Debt To Equity Score: 1, very unfavorable indicating higher financial risk.
- Overall Score: 3, moderate overall financial standing.
Which one is the best rated?
PTC holds a higher rating (B+) compared to Bentley’s B-, with a superior ROA score and a more moderate debt-to-equity risk profile. Both have equal overall and DCF scores.
Scores Comparison
The following table presents the Altman Z-Score and Piotroski Score for PTC and BSY to compare their financial health:
PTC Scores
- Altman Z-Score: 5.90, indicating a safe zone status.
- Piotroski Score: 8, classified as very strong.
BSY Scores
- Altman Z-Score: 4.37, indicating a safe zone status.
- Piotroski Score: 9, classified as very strong.
Which company has the best scores?
Both PTC and BSY are in the safe zone for Altman Z-Score, showing low bankruptcy risk. BSY has a slightly lower Altman score but a higher Piotroski score, suggesting marginally stronger financial health.
Grades Comparison
Here is a comparison of the recent grades assigned to PTC Inc. and Bentley Systems, Incorporated:
PTC Inc. Grades
The table below summarizes recent grades from reputable grading companies for PTC Inc.:
| Grading Company | Action | New Grade | Date |
|---|---|---|---|
| Piper Sandler | Maintain | Neutral | 2025-11-07 |
| Rosenblatt | Maintain | Buy | 2025-11-06 |
| Rosenblatt | Maintain | Buy | 2025-10-30 |
| Barclays | Maintain | Overweight | 2025-07-31 |
| Piper Sandler | Maintain | Neutral | 2025-07-31 |
| Oppenheimer | Maintain | Outperform | 2025-07-31 |
| Rosenblatt | Maintain | Buy | 2025-07-31 |
| RBC Capital | Maintain | Outperform | 2025-07-31 |
| Keybanc | Maintain | Overweight | 2025-07-31 |
| Stifel | Maintain | Buy | 2025-07-31 |
PTC Inc.’s grades show a consistent positive outlook with multiple Buy, Overweight, and Outperform ratings maintained over recent months.
Bentley Systems, Incorporated Grades
The table below summarizes recent grades from reputable grading companies for Bentley Systems, Incorporated:
| Grading Company | Action | New Grade | Date |
|---|---|---|---|
| Baird | Maintain | Outperform | 2025-11-06 |
| Piper Sandler | Maintain | Overweight | 2025-11-06 |
| JP Morgan | Maintain | Neutral | 2025-11-06 |
| Rosenblatt | Maintain | Buy | 2025-11-06 |
| Rosenblatt | Upgrade | Buy | 2025-10-17 |
| Goldman Sachs | Maintain | Sell | 2025-08-07 |
| Rosenblatt | Downgrade | Neutral | 2025-08-07 |
| Piper Sandler | Maintain | Overweight | 2025-08-07 |
| UBS | Maintain | Neutral | 2025-08-07 |
| Oppenheimer | Maintain | Outperform | 2025-08-07 |
Bentley Systems’ grades reflect a mixed but generally positive sentiment, with several Outperform and Buy ratings, though a notable Sell rating persists from Goldman Sachs.
Which company has the best grades?
PTC Inc. generally holds stronger and more stable positive grades with multiple Buy and Outperform ratings consistently maintained. Bentley Systems shows a more mixed grade profile, including a Sell rating, which may indicate greater perceived risk or uncertainty. Investors could interpret PTC’s steadier ratings as a sign of greater analyst confidence relative to Bentley Systems.
Strengths and Weaknesses
Below is a comparative overview of key strengths and weaknesses for PTC Inc. and Bentley Systems, Incorporated based on the most recent financial and operational data.
| Criterion | PTC Inc. | Bentley Systems, Incorporated |
|---|---|---|
| Diversification | Strong diversification with a balanced revenue mix across License (1.16B), Support & Cloud Services (1.47B), and Technology Service (107M) segments. | Moderate diversification, mainly reliant on Subscriptions & Licenses (1.27B) and Term License Subscriptions (434M), with smaller service revenue (84M). |
| Profitability | High profitability with a net margin of 26.8%, ROIC at 14.43%, and favorable return metrics indicating efficient capital use. | Moderate profitability with a net margin of 17.35% and ROIC at 9.3%, but showing signs of declining returns over recent years. |
| Innovation | Demonstrates growing ROIC (+42.4%) and value creation indicating successful innovation and competitive advantage. | Declining ROIC (-45.5%), slightly unfavorable moat, suggesting challenges in sustaining innovation and profitability. |
| Global presence | Global footprint supported by diversified cloud and license services, enhancing resilience and market reach. | Global presence through subscription models and enterprise licenses but with weaker financial health and liquidity ratios. |
| Market Share | Strong market position with growing revenues in cloud services and licenses, supported by favorable debt management and interest coverage. | Smaller market share relative to PTC, with unfavorable liquidity ratios (current ratio 0.54) and higher debt levels, limiting growth potential. |
In summary, PTC Inc. stands out with a robust and growing profitability profile, strong diversification, and a durable competitive moat. Bentley Systems shows moderate strengths but faces risks from declining returns and weaker financial stability, warranting careful consideration.
Risk Analysis
Below is a comparative table summarizing key risk factors for PTC Inc. and Bentley Systems, Incorporated based on the most recent financial and market data available in 2026:
| Metric | PTC Inc. | Bentley Systems, Incorporated |
|---|---|---|
| Market Risk | Beta 1.03 (moderate volatility) | Beta 1.23 (higher volatility) |
| Debt level | Debt/Equity 0.36 (low, favorable) | Debt/Equity 1.37 (high, unfavorable) |
| Regulatory Risk | Moderate, tech sector compliance | Moderate, infrastructure software |
| Operational Risk | Moderate, global software ops | Moderate, global software ops |
| Environmental Risk | Low to moderate, mainly data centers | Low to moderate, infrastructure focus |
| Geopolitical Risk | Exposure to Americas, Europe, Asia Pacific | Exposure to Americas, EMEA, Asia Pacific |
The most impactful risks are Bentley’s high debt level and elevated market volatility, which may pressure its financial flexibility. PTC’s moderate market risk and favorable debt profile position it more defensively. Both companies face typical technology sector regulatory and operational risks, but no acute environmental or geopolitical threats stand out currently. Caution is advised for investors sensitive to leverage and valuation multiples.
Which Stock to Choose?
PTC Inc. has shown a favorable income evolution with 19.18% revenue growth in the last year and a 53.9% net income increase over 2021-2025. Its financial ratios are mostly favorable, including a 19.18% ROE and 14.43% ROIC, supported by moderate debt and a strong B+ rating.
Bentley Systems, Incorporated exhibits positive income growth overall, with 68.81% revenue and 85.57% net income growth over 2020-2024, though recent net margin and EPS growth declined. Its financial ratios are mixed, with a higher debt level and a slightly unfavorable global ratio rating, paired with a B- rating.
Investors seeking consistent profitability and a durable competitive advantage might find PTC’s strong ROIC versus WACC and favorable ratio profile more appealing, while those focused on growth potential despite recent margin softness could consider Bentley’s higher overall income expansion but must weigh its elevated debt and less favorable ratios.
Disclaimer: Investment carries a risk of loss of initial capital. The past performance is not a reliable indicator of future results. Be sure to understand risks before making an investment decision.
Go Further
I encourage you to read the complete analyses of PTC Inc. and Bentley Systems, Incorporated to enhance your investment decisions: