Home > Comparison > Real Estate > PLD vs PSA
The strategic rivalry between Prologis, Inc. and Public Storage defines the current trajectory of the real estate sector. Prologis dominates as a global logistics real estate leader focused on high-growth industrial markets, while Public Storage specializes in self-storage facilities across the U.S. and Europe. This analysis contrasts their operational models to identify which offers superior risk-adjusted returns. I aim to guide investors seeking durable exposure within the REIT industrial niche.
Table of contents
Companies Overview
Prologis and Public Storage stand as dominant players in distinct niches of the industrial real estate sector.
Prologis, Inc.: Global Logistics Real Estate Leader
Prologis commands the logistics real estate market with nearly 1B square feet in 19 countries. It generates revenue by leasing modern facilities to 5,500 clients, focusing on business-to-business and retail fulfillment. In 2020, its strategic emphasis remained on expanding in high-barrier, high-growth markets, reinforcing its global footprint.
Public Storage: Premier Self-Storage REIT
Public Storage dominates the self-storage industry in the U.S. with 2,504 facilities totaling 171M rentable square feet. It earns primarily from leasing units to individual and business customers. In 2020, it expanded its reach through equity stakes in Shurgard Self Storage and PS Business Parks, focusing on diversifying its commercial and international presence.
Strategic Collision: Similarities & Divergences
Both firms excel in industrial real estate but diverge sharply in focus—Prologis targets global logistics hubs, while Public Storage centers on self-storage and commercial assets. Their battle for market share unfolds in how they capitalize on space utilization and customer diversification. Investors face distinct profiles: Prologis offers global scale and growth, Public Storage delivers steady cash flow with a defensive moat.
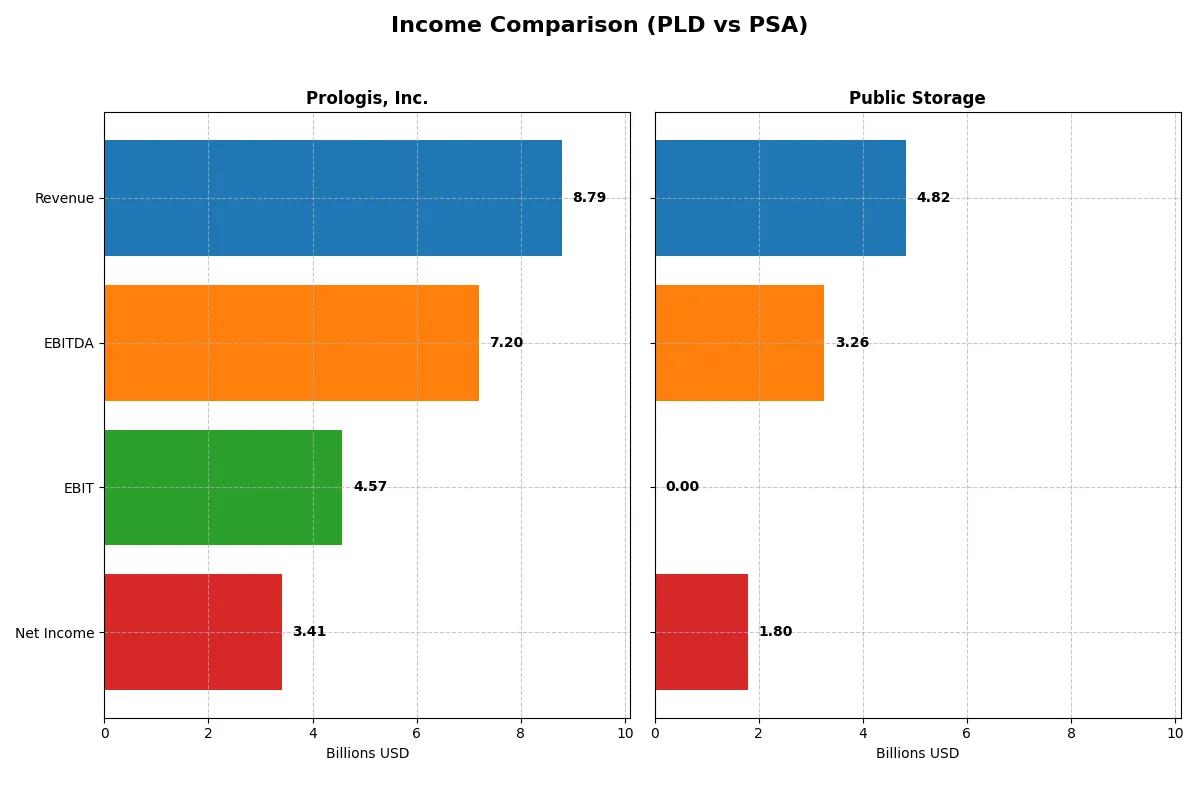
Income Statement Comparison
The following data dissects the core profitability and scalability of both corporate engines to reveal who dominates the bottom line:
| Metric | Prologis, Inc. (PLD) | Public Storage (PSA) |
|---|---|---|
| Revenue | 8.79B | 4.82B |
| Cost of Revenue | 3.55B | 1.31B |
| Operating Expenses | 1.70B | 0.11B |
| Gross Profit | 5.24B | 3.51B |
| EBITDA | 7.20B | 3.26B |
| EBIT | 4.57B | 0 |
| Interest Expense | 1.00B | 0.30B |
| Net Income | 3.41B | 1.80B |
| EPS | 3.57 | 9.04 |
| Fiscal Year | 2025 | 2025 |
Income Statement Analysis: The Bottom-Line Duel
This income statement comparison reveals the true operational efficiency and profitability trends of two leading real estate giants.
Prologis, Inc. Analysis
Prologis grew revenue from $4.8B in 2021 to $8.8B in 2025, showing strong top-line momentum. Net income also climbed moderately, reaching $3.3B in 2025 despite a 1-year net margin decline to 38.8%. Gross margins remain robust at nearly 60%, but EBIT and EPS contracted recently, indicating margin pressure and rising interest costs.
Public Storage Analysis
Public Storage’s revenue expanded steadily from $3.4B in 2021 to $4.8B in 2025, a slower pace than Prologis. Its gross margin impresses at 72.9%, but EBIT margin dropped to zero in 2025, reflecting operational challenges. Net income fell by 15.6% over the last year to $1.8B, with EPS down 15%, signaling deteriorating profitability despite controlled expenses.
Margin Strength vs. Growth Trajectory
Prologis leads with higher revenue growth (+84.7% over five years) and stronger absolute net income ($3.3B vs. $1.8B). However, Public Storage excels in gross margin but suffers from eroded EBIT and net margins. For investors, Prologis’s growth and scale offer a more compelling profit profile despite margin headwinds, while Public Storage faces tougher operational efficiency challenges.
Financial Ratios Comparison
These vital ratios act as a diagnostic tool to expose the underlying fiscal health, valuation premiums, and capital efficiency of the companies compared below:
| Ratios | Prologis, Inc. (PLD) | Public Storage (PSA) |
|---|---|---|
| ROE | 6.41% | 19.43% |
| ROIC | 3.60% | 595.69% |
| P/E | 35.12 | 25.34 |
| P/B | 2.25 | 4.92 |
| Current Ratio | 0.23 | 0 |
| Quick Ratio | 0.23 | 0 |
| D/E (Debt to Equity) | 0.66 | 1.11 |
| Debt-to-Assets | 35.49% | 50.74% |
| Interest Coverage | 3.53 | 11.19 |
| Asset Turnover | 0.09 | 0.24 |
| Fixed Asset Turnover | 0.11 | 0 |
| Payout ratio | 110.38% | 117.16% |
| Dividend yield | 3.14% | 4.62% |
| Fiscal Year | 2025 | 2025 |
Efficiency & Valuation Duel: The Vital Signs
Financial ratios serve as a company’s DNA, uncovering hidden risks and operational excellence essential for informed investment decisions.
Prologis, Inc.
Prologis posts a solid net margin of 38.8%, but its ROE at 6.41% and ROIC at 3.6% lag behind sector averages, signaling efficiency challenges. The stock trades at a stretched P/E of 35.12, reflecting high valuation. A 3.14% dividend yield supports shareholder returns, balancing modest reinvestment needs.
Public Storage
Public Storage demonstrates robust profitability, with a 19.43% ROE and an extraordinary 595.69% ROIC, far exceeding typical industry benchmarks. Its P/E ratio of 25.34 appears elevated but justifiable given strong returns. The company offers a 4.62% dividend yield, highlighting a shareholder-friendly capital allocation policy despite some balance sheet risks.
Operational Efficiency Meets Valuation Stretch
Public Storage delivers superior operational returns but carries more financial risk, reflected in its debt and coverage metrics. Prologis’s more conservative leverage and steady dividend yield offer a safer profile but at a higher valuation relative to returns. Investors prioritizing growth and yield may favor Public Storage’s profile, while risk-averse investors might lean toward Prologis’s stability.
Which one offers the Superior Shareholder Reward?
I compare Prologis (PLD) and Public Storage (PSA) on dividends, payout ratios, and buybacks. PSA yields 4.6%, nearly 50% higher than PLD’s 3.1%, but PSA’s payout ratio exceeds 1.17, signaling risk in dividend sustainability. PLD pays a 3.1% yield with a 1.1 payout ratio, backed by stable free cash flow. Both reinvest heavily, but PSA’s free cash flow per share (18.2) dwarfs PLD’s (5.3), enabling larger buybacks. PSA’s debt leverage is higher (debt-to-equity 1.1 vs. 0.66), raising risk. I find PSA offers a higher immediate yield and buyback scale but with greater financial leverage risk. PLD’s disciplined payout and moderate leverage suggest more sustainable long-term value. For 2026, I favor PLD for superior risk-adjusted total return potential.
Comparative Score Analysis: The Strategic Profile
The radar chart reveals the fundamental DNA and trade-offs of Prologis, Inc. and Public Storage, highlighting their financial strengths and weaknesses across key metrics:
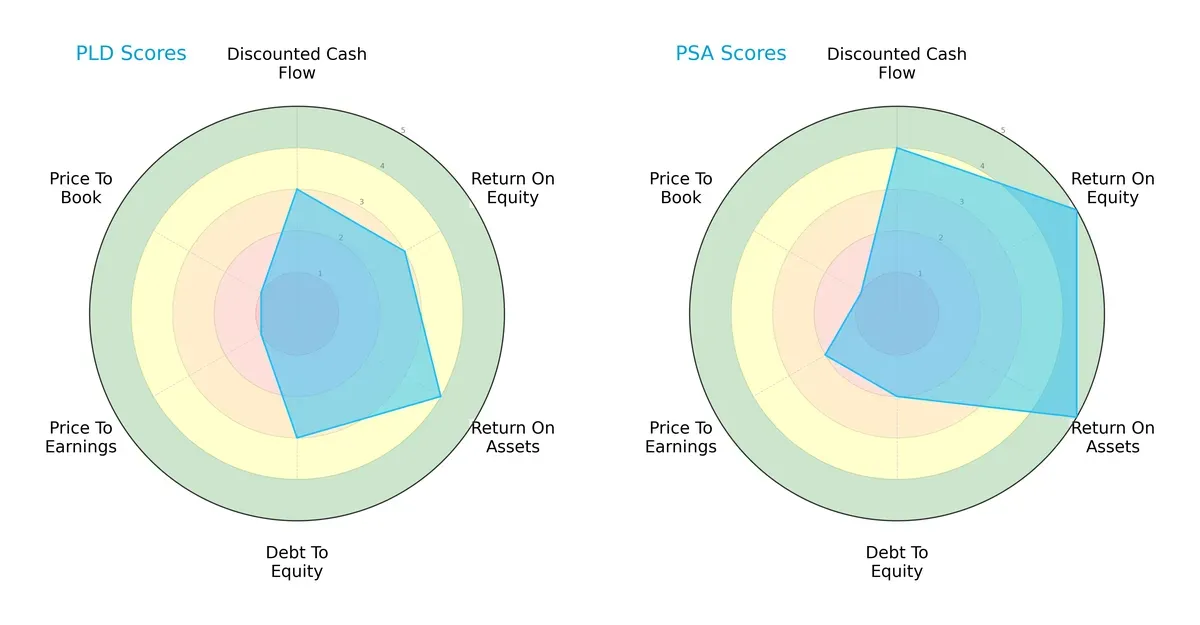
Public Storage excels with very favorable ROE and ROA scores, signaling strong profitability and asset use. Prologis shows a more balanced risk profile with moderate debt-to-equity and DCF scores. However, both firms suffer very unfavorable valuation scores (P/E and P/B), indicating market skepticism or overvaluation risks. Public Storage relies heavily on operational efficiency, while Prologis maintains steadier leverage management.
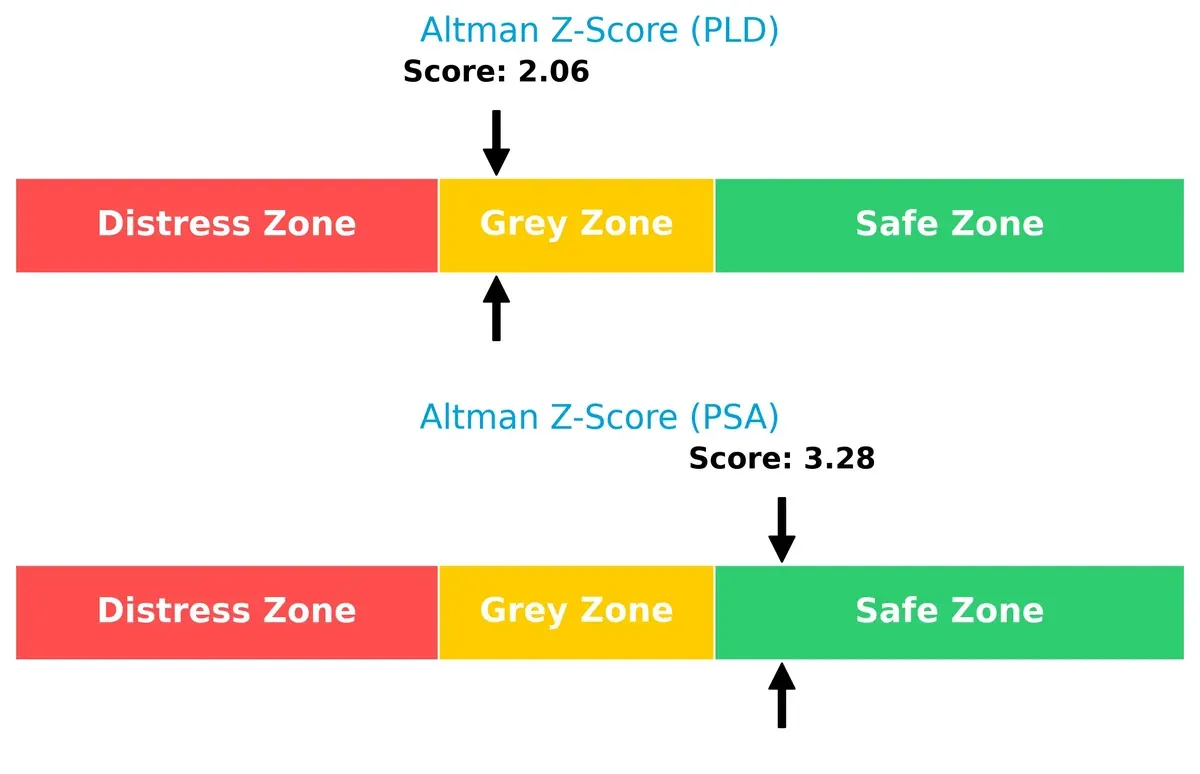
Bankruptcy Risk: Solvency Showdown
The Altman Z-Score gap favors Public Storage, scoring 3.28 in the safe zone versus Prologis’s 2.06 in the grey zone, indicating stronger long-term survival prospects for PSA in this cycle:
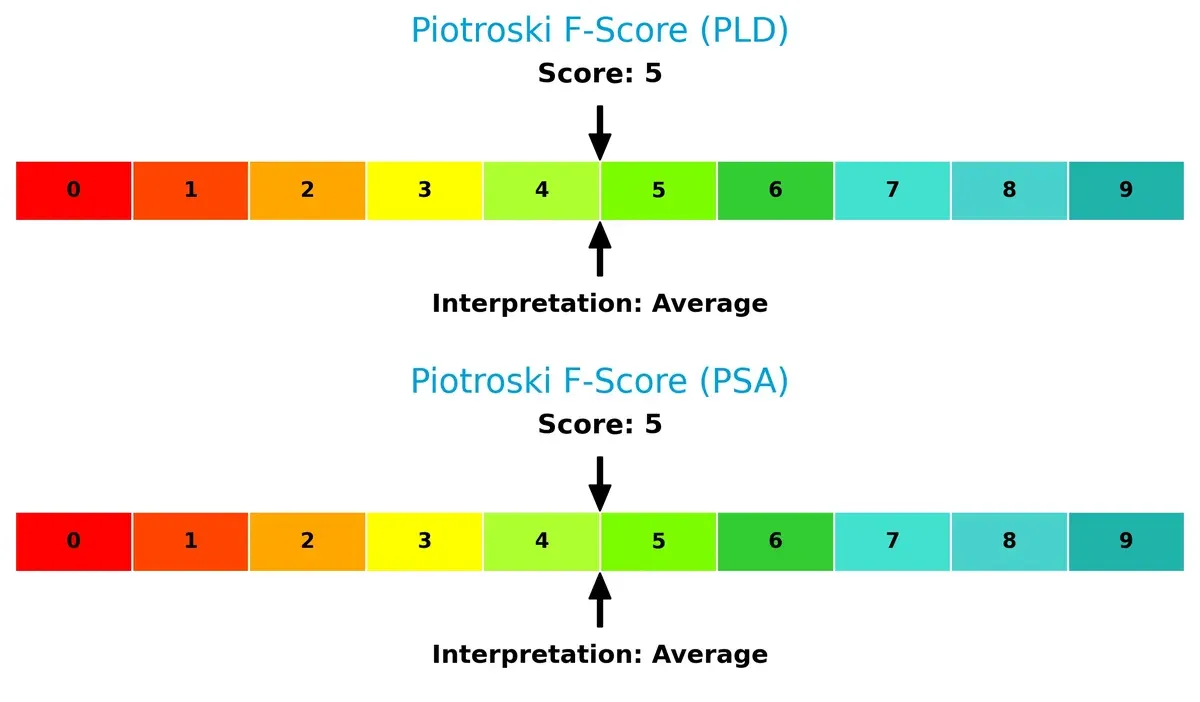
Financial Health: Quality of Operations
Both companies have identical Piotroski F-Scores of 5, reflecting average financial health. Neither shows clear red flags, but neither is in peak condition, signaling room for operational improvement:
How are the two companies positioned?
This section dissects the operational DNA of Prologis and Public Storage by comparing their revenue distribution by segment and internal dynamics. The goal is to confront their economic moats and identify which model offers the most resilient competitive advantage today.
Revenue Segmentation: The Strategic Mix
This visual comparison dissects how Prologis, Inc. and Public Storage diversify their income streams and where their primary sector bets lie:
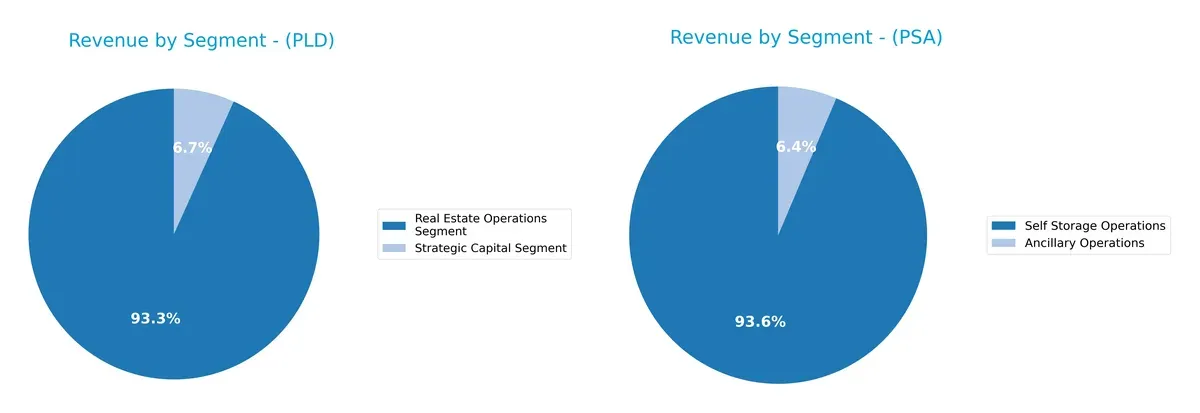
Prologis anchors its revenue in Real Estate Operations, generating $8.2B in 2025, with a smaller $592M Strategic Capital segment. This mix shows moderate diversification but heavy reliance on core operations. Public Storage pivots around Self Storage Operations, earning $4.4B in 2024, complemented by $300M Ancillary Operations. PSA’s focus suggests ecosystem lock-in, while PLD’s mix indicates infrastructure dominance with some capital flexibility.
Strengths and Weaknesses Comparison
This table compares the strengths and weaknesses of Prologis, Inc. (PLD) and Public Storage (PSA) based on their diversification, profitability, financials, innovation, global presence, and market share:
PLD Strengths
- Diversified revenue streams with Real Estate and Strategic Capital segments
- Favorable net margin at 38.8%
- Dividend yield of 3.14% supports shareholder returns
- Neutral debt levels with 35.49% debt-to-assets
- Global presence with significant U.S., Europe, Asia operations
PSA Strengths
- Strong profitability with 19.43% ROE and 595.69% ROIC
- Favorable net margin at 37.25%
- Higher dividend yield at 4.62%
- Favorable WACC at 7.53% improves capital efficiency
- Leading market share in Self Storage Operations segment
PLD Weaknesses
- Unfavorable ROE at 6.41% and ROIC at 3.6%, below WACC
- Low liquidity ratios with current and quick ratio at 0.23
- High price-to-earnings ratio at 35.12 signals valuation risk
- Low asset turnover ratios indicate operational inefficiency
PSA Weaknesses
- Zero current and quick ratios raise liquidity concerns
- High debt-to-equity ratio at 1.11 and 50.74% debt-to-assets
- Interest coverage at zero indicates risk in meeting debt costs
- Unfavorable price-to-book at 4.92 and fixed asset turnover at zero
Overall, PLD excels in diversification and moderate global reach but faces operational inefficiencies and liquidity challenges. PSA shows superior profitability metrics and capital efficiency but carries higher financial risk and liquidity weaknesses. These factors will influence each company’s strategic priorities in managing growth and financial stability.
The Moat Duel: Analyzing Competitive Defensibility
A structural moat is the only reliable shield preserving long-term profits from relentless competition erosion:
Prologis, Inc.: Scale-Driven Market Penetration
Prologis leverages a vast global logistics footprint as its moat, driving high gross margins and operational scale. However, declining ROIC signals profit pressure amid rising interest costs by 2026. Expansion into emerging markets could deepen this advantage if managed prudently.
Public Storage: Niche Dominance via Brand and Network Effects
Public Storage’s moat arises from strong brand recognition and network effects in self-storage. It sustains high gross margins and growing ROIC, contrasting with Prologis’s decline. Its expansion into European markets and commercial space offers promising growth and disruption potential.
Scale Dominance vs. Brand-Network Synergy
Public Storage holds the deeper moat, evidenced by a soaring ROIC well above WACC, while Prologis struggles with value destruction. PSA appears better equipped to defend and grow market share amid evolving industry dynamics.
Which stock offers better returns?
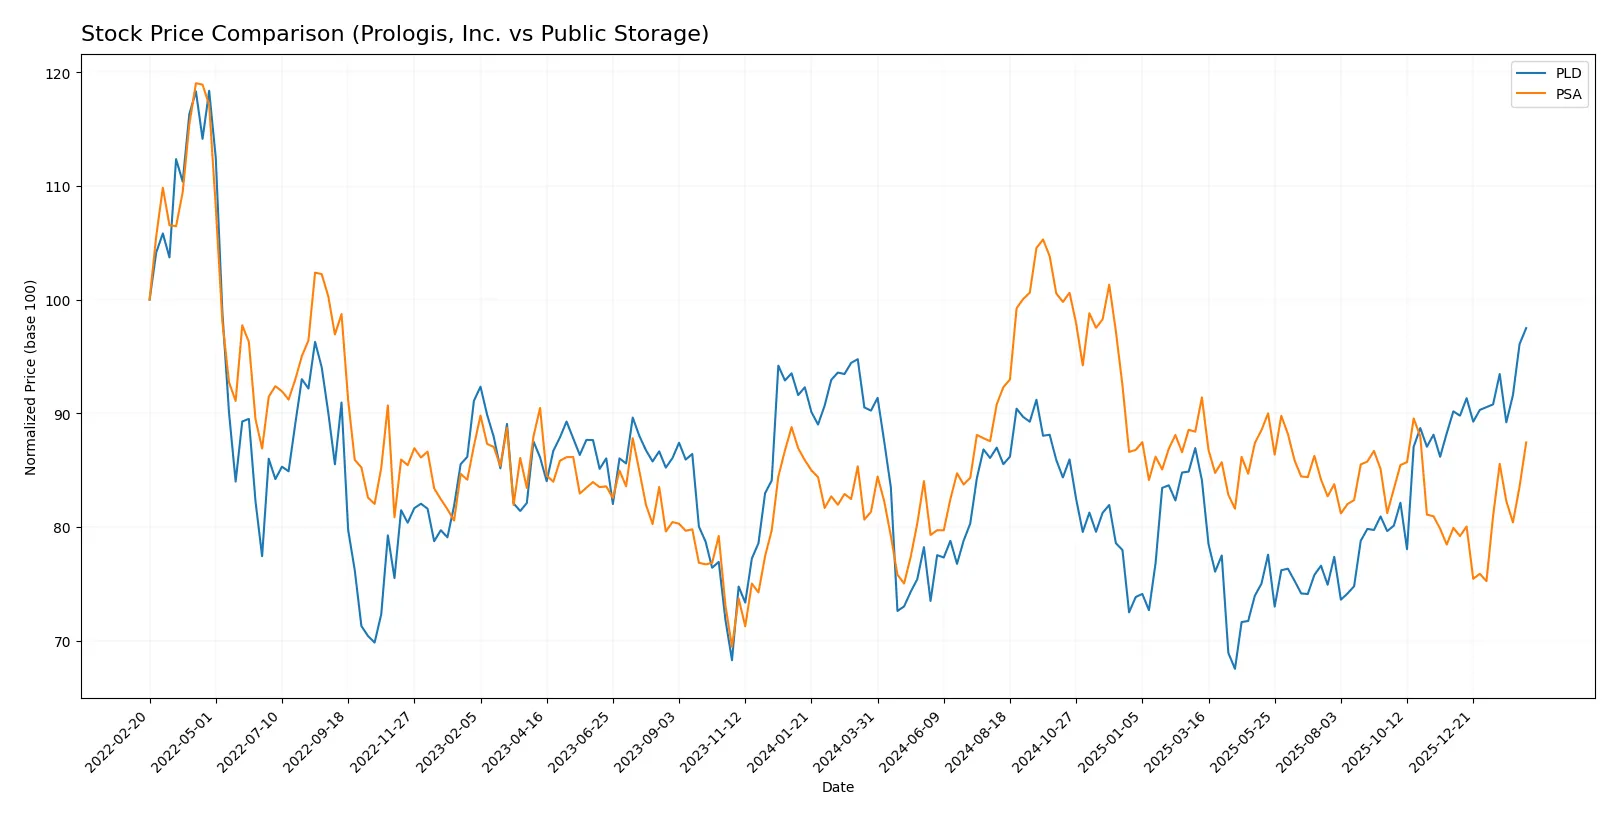
Over the past 12 months, Prologis, Inc. and Public Storage have both exhibited bullish price trends with accelerating momentum and notable price ranges.
Trend Comparison
Prologis, Inc. (PLD) gained 8.05% over the past year, showing a bullish trend with accelerating price growth. Its price ranged between 96.23 and 138.97, supported by moderate volatility (9.45%).
Public Storage (PSA) rose 7.51% over the last year, also in a bullish trend with acceleration. It experienced higher volatility (23.94%) and price swings between 257.73 and 361.72.
PLD delivered the highest market performance with an 8.05% gain versus PSA’s 7.51%, both showing strong upward momentum and growing trading volumes.
Target Prices
Analysts present a solid target price consensus for both Prologis, Inc. and Public Storage, reflecting confidence in their sector positions.
| Company | Target Low | Target High | Consensus |
|---|---|---|---|
| Prologis, Inc. | 119 | 155 | 136 |
| Public Storage | 276 | 331 | 298.5 |
Prologis trades near its consensus target at $139, indicating limited upside. Public Storage’s consensus of $298.5 is slightly below its $300 current price, suggesting a modest pullback risk.

Don’t Let Luck Decide Your Entry Point
Optimize your entry points with our advanced ProRealTime indicators. You’ll get efficient buy signals with precise price targets for maximum performance. Start outperforming now!
How do institutions grade them?
Here is a summary of recent institutional grades for Prologis, Inc. and Public Storage:
Prologis, Inc. Grades
The following table shows recent grades from established grading companies for Prologis, Inc.:
| Grading Company | Action | New Grade | Date |
|---|---|---|---|
| RBC Capital | maintain | Sector Perform | 2026-02-02 |
| Truist Securities | maintain | Buy | 2026-01-26 |
| Mizuho | maintain | Outperform | 2026-01-26 |
| Freedom Capital Markets | downgrade | Hold | 2026-01-23 |
| Argus Research | maintain | Buy | 2026-01-22 |
| UBS | maintain | Buy | 2026-01-22 |
| Evercore ISI Group | maintain | In Line | 2026-01-22 |
| Truist Securities | maintain | Buy | 2026-01-20 |
| Scotiabank | upgrade | Sector Outperform | 2026-01-14 |
| Baird | downgrade | Neutral | 2026-01-08 |
Public Storage Grades
The following table shows recent grades from established grading companies for Public Storage:
| Grading Company | Action | New Grade | Date |
|---|---|---|---|
| Wells Fargo | downgrade | Equal Weight | 2026-02-05 |
| Wolfe Research | downgrade | Peer Perform | 2026-01-26 |
| Truist Securities | maintain | Buy | 2026-01-20 |
| UBS | maintain | Neutral | 2026-01-08 |
| JP Morgan | downgrade | Neutral | 2025-12-18 |
| Mizuho | maintain | Neutral | 2025-12-05 |
| Evercore ISI Group | maintain | In Line | 2025-12-01 |
| Truist Securities | maintain | Buy | 2025-11-25 |
| Evercore ISI Group | maintain | In Line | 2025-11-03 |
| RBC Capital | maintain | Sector Perform | 2025-10-31 |
Which company has the best grades?
Prologis, Inc. has received stronger and more frequent upgrades including multiple “Buy” and “Outperform” ratings. Public Storage’s grades have more downgrades and neutral positions. This difference may influence investor confidence and portfolio positioning.
Risks specific to each company
The following categories outline the critical pressure points and systemic threats facing Prologis, Inc. (PLD) and Public Storage (PSA) in the 2026 market environment:
1. Market & Competition
Prologis, Inc.
- Dominates logistics real estate with global scale and diverse customers but faces industrial sector cyclicality.
Public Storage
- Leads self-storage market with large US presence; competitive pressures from new entrants and tech-enabled alternatives.
2. Capital Structure & Debt
Prologis, Inc.
- Maintains moderate debt-to-equity (0.66), neutral leverage; interest coverage ratio (4.56) suggests manageable debt service.
Public Storage
- High leverage (debt-to-equity 1.11) and zero interest coverage signal elevated financial risk and potential distress.
3. Stock Volatility
Prologis, Inc.
- Beta 1.44 shows above-market volatility, typical for industrial REITs with cyclical exposure.
Public Storage
- Beta near 1.0 indicates market-aligned volatility, reflecting more stable self-storage demand.
4. Regulatory & Legal
Prologis, Inc.
- Exposure to complex international regulations across 19 countries increases compliance risk.
Public Storage
- Primarily US operations reduce regulatory complexity but face stringent US real estate regulations.
5. Supply Chain & Operations
Prologis, Inc.
- Relies on global construction and leasing markets; supply chain disruptions can delay developments.
Public Storage
- Operationally focused on facility management; less supply chain risk but sensitive to labor and maintenance costs.
6. ESG & Climate Transition
Prologis, Inc.
- As a logistics leader, faces pressure to improve energy efficiency and reduce carbon footprint in warehouses.
Public Storage
- ESG risks lower but growing investor scrutiny on sustainable operations and climate resilience of storage facilities.
7. Geopolitical Exposure
Prologis, Inc.
- Global footprint subjects it to geopolitical tensions, trade disruptions, and currency risks.
Public Storage
- Concentrated US operations limit geopolitical risk but domestic policy shifts remain a factor.
Which company shows a better risk-adjusted profile?
Prologis’s most impactful risk is its elevated stock volatility and international regulatory burden. Public Storage faces critical financial strain from its high leverage and zero interest coverage. Despite Prologis’s operational challenges, its moderate debt and global scale offer better risk mitigation. PSA’s weak capital structure and debt servicing capacity create a riskier profile, signaling caution for risk-averse investors. Recent data showing PSA’s interest coverage at zero confirms urgent financial vulnerability, tipping the scale in Prologis’s favor for risk-adjusted stability.
Final Verdict: Which stock to choose?
Prologis, Inc. (PLD) stands out for its unmatched scale and operational efficiency in industrial real estate logistics. Its ability to generate consistent cash flow amid a challenging market is impressive. However, the low liquidity ratios and declining ROIC signal a point of vigilance. It suits portfolios targeting aggressive growth with a tolerance for financial leverage risks.
Public Storage (PSA) commands a strategic moat through its dominant position in self-storage, delivering exceptional returns on invested capital far above its cost of capital. Despite higher leverage and some liquidity concerns, PSA offers a more stable income profile with strong profitability metrics. It aligns well with investors seeking growth at a reasonable price (GARP) and income stability.
If you prioritize long-term value creation and a sustainable competitive advantage, PSA is the compelling choice due to its superior ROIC and growing profitability. However, if you seek exposure to a cash-generating industrial giant with aggressive growth potential, PLD offers that upside but with more financial risk to monitor. Both stocks show bullish momentum, yet their risk profiles and strategic strengths cater to distinct investor avatars.
Disclaimer: Investment carries a risk of loss of initial capital. The past performance is not a reliable indicator of future results. Be sure to understand risks before making an investment decision.
Go Further
I encourage you to read the complete analyses of Prologis, Inc. and Public Storage to enhance your investment decisions: