Home > Comparison > Financial Services > HIG vs PFG
The strategic rivalry between The Hartford Financial Services Group, Inc. and Principal Financial Group, Inc. shapes the competitive landscape of the diversified insurance sector. Hartford operates as a comprehensive insurer with broad commercial and personal lines. Principal emphasizes retirement and asset management with a global footprint. This analysis contrasts their models to identify which offers superior risk-adjusted returns and resilience for a diversified portfolio in evolving financial markets.

Table of contents
Companies Overview
The Hartford and Principal Financial Group shape the diversified insurance landscape with significant market footprints.
The Hartford Financial Services Group, Inc.: Insurance and Risk Solutions Leader
The Hartford anchors its identity in diversified insurance, generating revenue from commercial and personal lines insurance. It focuses on workers’ compensation, property, automobile, and specialty casualty coverages. In 2026, the company emphasizes expanding risk management services and underwriting innovation to strengthen its competitive edge.
Principal Financial Group, Inc.: Retirement and Asset Management Powerhouse
Principal defines itself as a retirement and asset management specialist, earning through retirement solutions, global investments, and insurance products. Its 2026 strategy centers on growing international pension offerings and enhancing retirement income products, targeting both institutional and individual clients worldwide.
Strategic Collision: Similarities & Divergences
Both firms operate in diversified insurance but diverge in focus: Hartford leans into property-casualty risk, while Principal prioritizes retirement and asset management. They compete mainly in the group benefits and insurance markets but pursue distinct growth paths. Hartford offers steady underwriting returns, whereas Principal’s profile reflects growth through international expansion and retirement solutions innovation.
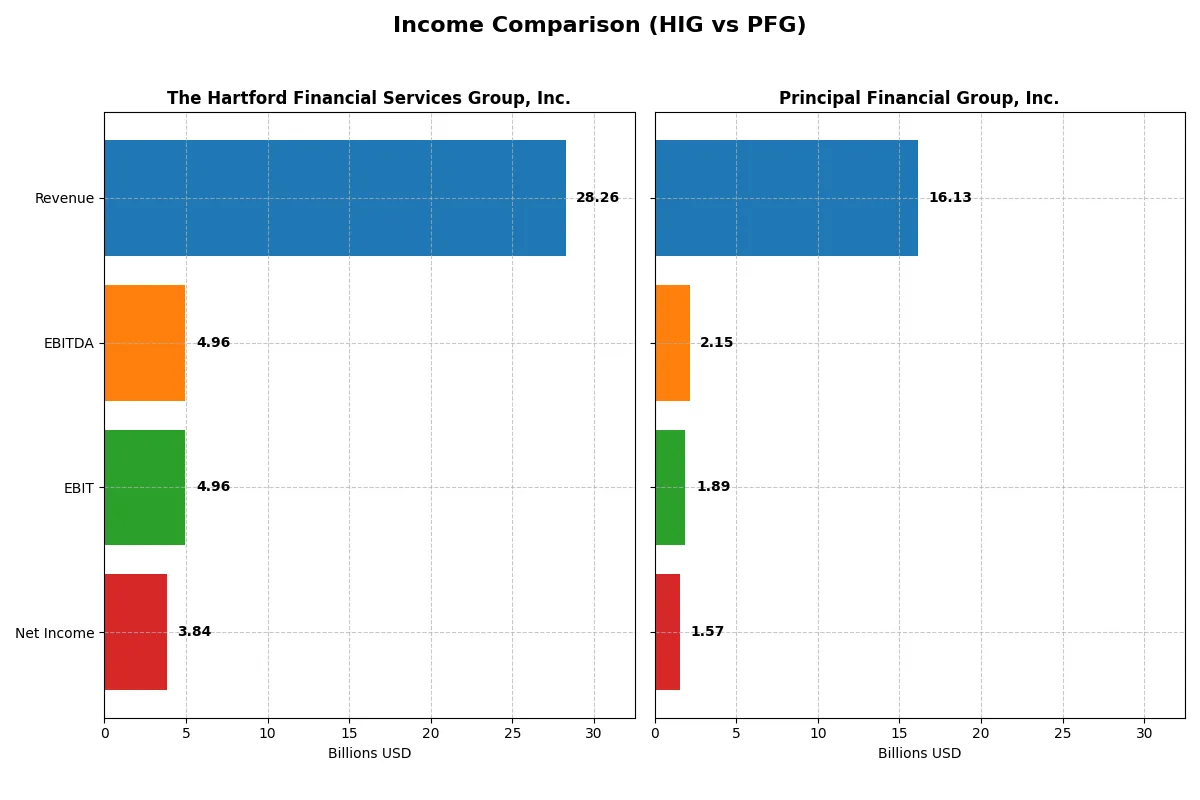
Income Statement Comparison
This data dissects the core profitability and scalability of both corporate engines to reveal who dominates the bottom line:
| Metric | The Hartford Financial Services Group, Inc. (HIG) | Principal Financial Group, Inc. (PFG) |
|---|---|---|
| Revenue | 28.3B | 16.1B |
| Cost of Revenue | 15.2B | 8.8B |
| Operating Expenses | 8.3B | 5.5B |
| Gross Profit | 13.0B | 7.4B |
| EBITDA | 5.0B | 2.1B |
| EBIT | 5.0B | 1.9B |
| Interest Expense | 199M | 3M |
| Net Income | 3.8B | 1.6B |
| EPS | 13.51 | 6.77 |
| Fiscal Year | 2025 | 2024 |
Income Statement Analysis: The Bottom-Line Duel
This income statement comparison reveals how efficiently each company converts revenue into profits amid evolving market conditions.
The Hartford Financial Services Group, Inc. Analysis
Hartford’s revenue rose steadily from 21.6B in 2021 to 28.3B in 2025, reflecting a 30.5% growth over five years. Net income surged 62% to 3.8B, with gross margin expanding to a strong 46.1%. The 2025 net margin of 13.6% and EBIT margin of 17.6% highlight robust operational efficiency and improving profitability momentum.
Principal Financial Group, Inc. Analysis
Principal’s revenue grew moderately to 16.1B in 2024, up 9.4% since 2020, while net income advanced 12.6% to 1.6B. Gross margin held firm near 45.6%, but net margin at 9.7% trails Hartford’s. The firm’s EBIT margin of 11.7% and sharp one-year net margin growth (+114%) suggest a recent rebound, though overall profitability lags behind its peer.
Margin Leadership vs. Growth Momentum
Hartford leads with higher absolute profits, superior margins, and sustained five-year growth, demonstrating consistent operational strength. Principal shows impressive short-term margin expansion and EPS growth but from a lower base and smaller scale. For investors, Hartford’s profile offers greater earnings power and margin resilience, while Principal presents a more volatile but improving earnings trajectory.
Financial Ratios Comparison
These vital ratios act as a diagnostic tool to expose the underlying fiscal health, valuation premiums, and capital efficiency of the companies compared below:
| Ratios | The Hartford Financial Services Group, Inc. (HIG) | Principal Financial Group, Inc. (PFG) |
|---|---|---|
| ROE | 20.2% | 14.2% |
| ROIC | 28.2% | 10.5% |
| P/E | 10.1 | 11.1 |
| P/B | 2.05 | 1.58 |
| Current Ratio | 17.7 | N/A |
| Quick Ratio | 17.7 | N/A |
| D/E | 0.23 | 0.37 |
| Debt-to-Assets | 5.1% | 1.3% |
| Interest Coverage | 23.9 | 727 |
| Asset Turnover | 0.33 | 0.05 |
| Fixed Asset Turnover | 30.4 | 21.0 |
| Payout ratio | 16.0% | 41.9% |
| Dividend yield | 1.57% | 3.76% |
| Fiscal Year | 2025 | 2024 |
Efficiency & Valuation Duel: The Vital Signs
Financial ratios act as a company’s DNA, revealing operational strengths and hidden risks essential for investment decisions.
The Hartford Financial Services Group, Inc.
The Hartford displays strong profitability with a 20.21% ROE and robust 13.57% net margin, signaling operational efficiency. Its P/E of 10.14 suggests the stock trades at a reasonable valuation. The company balances shareholder returns with a modest 1.57% dividend yield, indicating steady income while maintaining growth potential.
Principal Financial Group, Inc.
Principal posts a moderate 14.17% ROE and a 9.74% net margin, reflecting average profitability. Its P/E stands at 11.15, slightly higher but still attractive relative to peers. The firm rewards shareholders with a higher 3.76% dividend yield, emphasizing income distribution over aggressive reinvestment strategies.
Balanced Profitability vs. Yield Focus
The Hartford offers a compelling blend of operational efficiency and reasonable valuation, while Principal emphasizes dividend income with moderate profitability. Investors seeking a balance of growth and income may prefer Hartford’s profile, whereas those prioritizing yield might find Principal more fitting.
Which one offers the Superior Shareholder Reward?
I observe The Hartford Financial Services Group, Inc. (HIG) delivers a modest dividend yield near 1.57% with a conservative payout ratio around 16%, signaling strong free cash flow coverage. Its buyback program is less intense but steady, underpinning shareholder value without risking capital. Principal Financial Group, Inc. (PFG) offers a higher dividend yield near 3.76% but with a payout ratio above 40%, implying less room for reinvestment or buybacks. PFG’s aggressive buyback activity boosts total returns but raises sustainability concerns given its high financial leverage ratio (28.3x) compared to HIG’s 4.5x. Historically in financial services, a balanced distribution model like HIG’s tends to sustain long-term value better, mitigating risk amid market cycles. I conclude HIG presents a more attractive and sustainable total return profile for 2026 investors seeking prudent shareholder reward.
Comparative Score Analysis: The Strategic Profile
The radar chart reveals the fundamental DNA and trade-offs of The Hartford Financial Services Group, Inc. (HIG) and Principal Financial Group, Inc. (PFG), highlighting their strategic strengths and weaknesses:
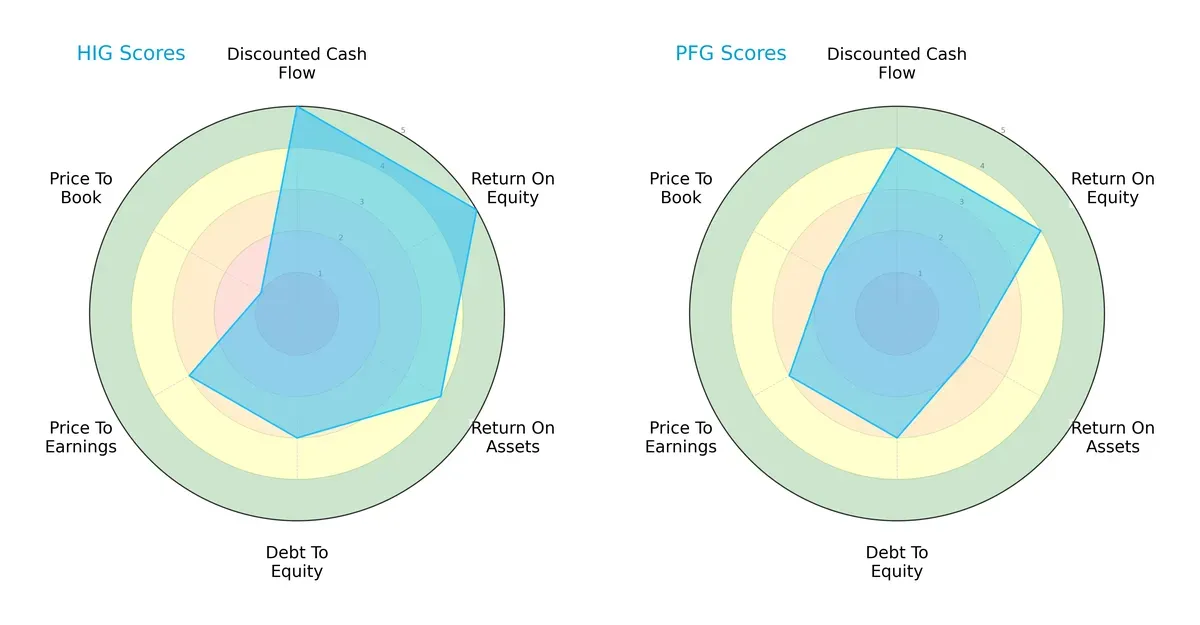
HIG leads with a more balanced profile, excelling in DCF (5 vs. 4), ROE (5 vs. 4), and ROA (4 vs. 2), reflecting superior profitability and asset use. Both match in Debt/Equity (3), indicating similar leverage risk. Valuation scores show moderate P/E parity (3 each), but HIG’s very low P/B score (1) signals potential overvaluation or asset concerns compared to PFG’s moderate 2. HIG relies on operational efficiency, while PFG shows a more cautious valuation stance.
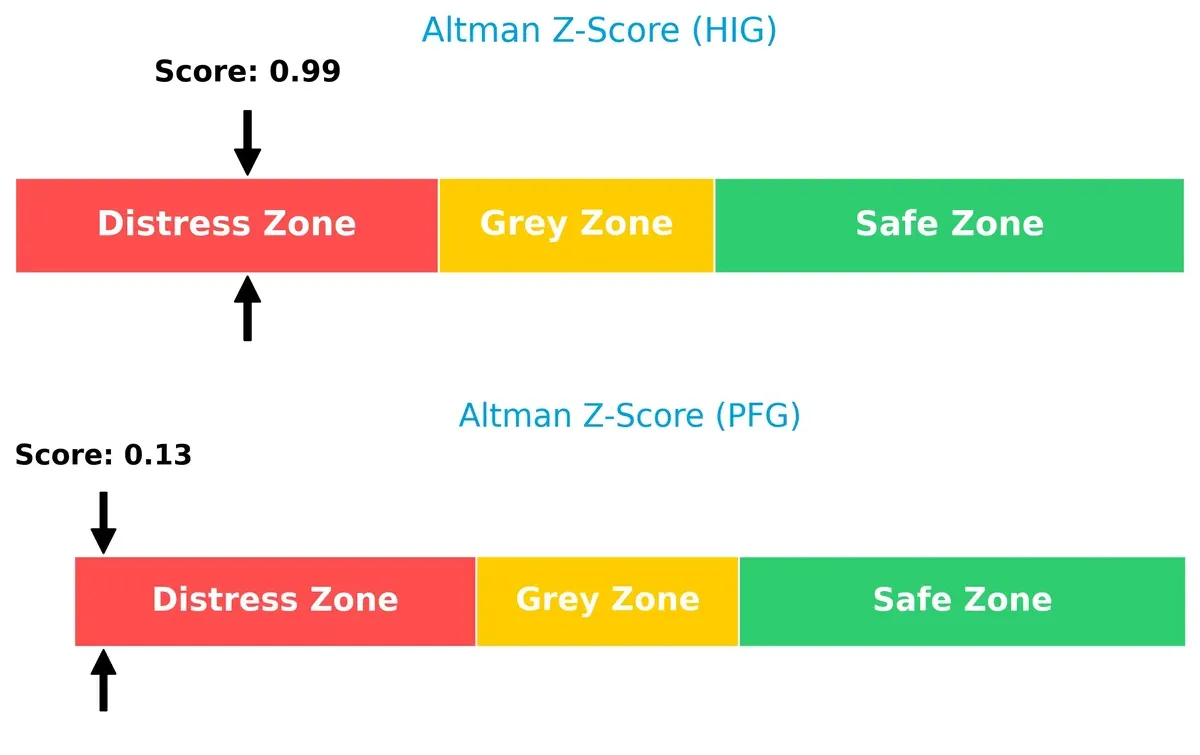
Bankruptcy Risk: Solvency Showdown
Both firms reside in the distress zone by Altman Z-Score, with HIG at 0.99 and PFG lower at 0.13; this implies elevated bankruptcy risk amid current market cycles, demanding caution:
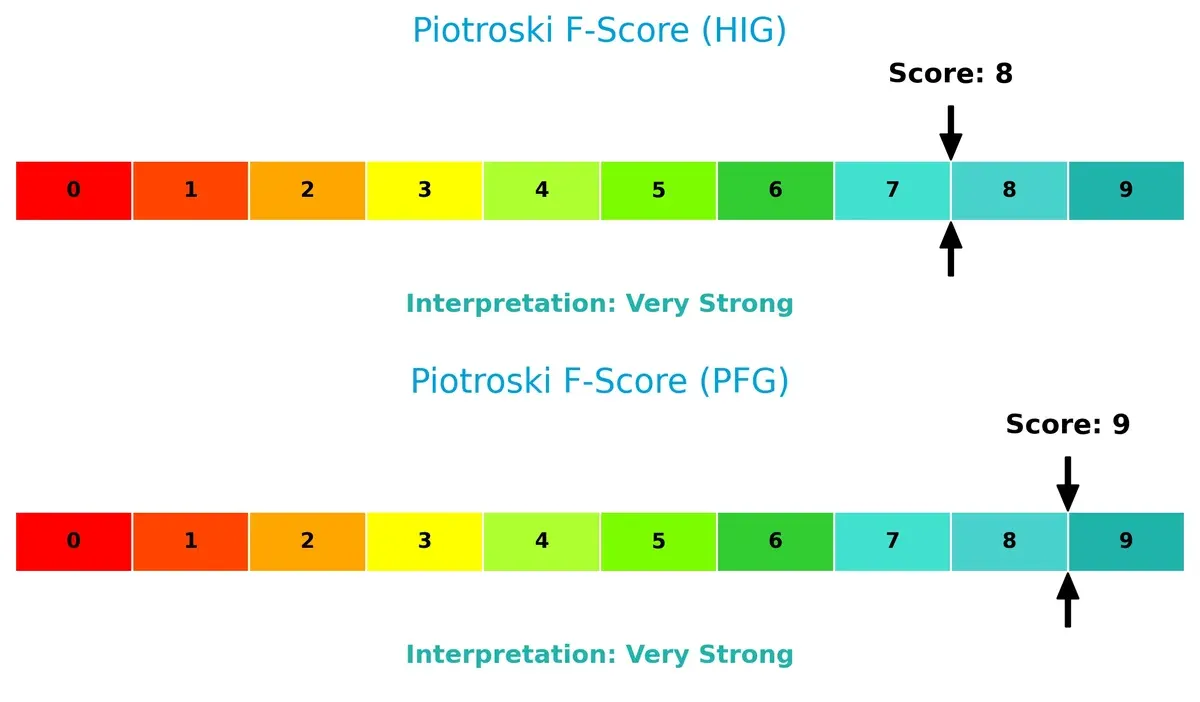
Financial Health: Quality of Operations
With Piotroski F-Scores of 8 (HIG) and 9 (PFG), both companies demonstrate very strong financial health. PFG slightly outperforms, indicating marginally better internal financial quality and operational efficiency:
How are the two companies positioned?
This section dissects the operational DNA of HIG and PFG by comparing their revenue distribution and internal dynamics. The goal is to confront their economic moats to identify which model offers the most resilient competitive advantage.
Revenue Segmentation: The Strategic Mix
This visual comparison dissects how The Hartford Financial Services Group, Inc. and Principal Financial Group, Inc. diversify their income streams and where their primary sector bets lie:
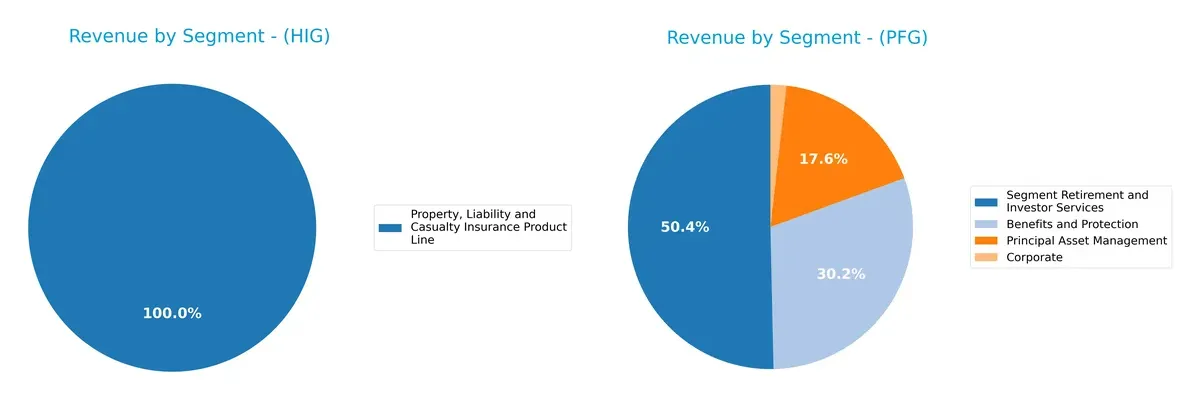
The Hartford’s 2013 revenue spans multiple insurance lines, anchored by Group Life and Accident at $5.2B, showing broad diversification across ten segments. In contrast, Principal’s 2024 revenue pivots around Retirement and Investor Services at $7.98B, complemented by Benefits and Protection at $4.79B, indicating a focused dual-segment dominance. Hartford’s spread reduces concentration risk, while Principal leverages ecosystem lock-in via retirement services, heightening dependency but fueling scale advantages.
Strengths and Weaknesses Comparison
This table compares the strengths and weaknesses of The Hartford Financial Services Group, Inc. (HIG) and Principal Financial Group, Inc. (PFG):
HIG Strengths
- Strong profitability metrics with 20.21% ROE and 28.21% ROIC
- Low debt-to-assets ratio at 5.08% indicating conservative leverage
- Favorable interest coverage of 24.92 supports debt service
- Diverse product lines including commercial autos and group life
- Significant global presence with large US and Japan revenue
PFG Strengths
- Exceptionally high ROIC at 1046.43% showing efficient capital use
- High interest coverage ratio of 726.77 indicating strong earnings
- Favorable debt-to-assets ratio at 1.31% and moderate debt-to-equity
- Robust dividend yield at 3.76% attracts income investors
- Diversified revenue streams across retirement, asset management, and insurance
HIG Weaknesses
- Extremely high current ratio of 17.65 suggests inefficient asset use
- Unfavorable asset turnover of 0.33 limits revenue generation from assets
- Neutral price-to-book ratio at 2.05 limits valuation upside
- Limited recent revenue breakdown for innovation visibility
- Heavy US and Japan concentration may limit geographic diversification
PFG Weaknesses
- Zero current and quick ratios raise liquidity concerns
- Low asset turnover of 0.05 points to underutilized assets
- Neutral net margin and ROE indicate moderate profitability
- Limited geographic diversification focused on US insurance solutions
- Slightly higher debt-to-equity ratio at 0.37 increases leverage risk
Both companies show favorable capital efficiency and manageable leverage, but HIG’s liquidity figures and asset turnover are concerns. PFG’s outstanding ROIC and dividend yield contrast with troubling liquidity ratios and narrow geographic exposure. These factors shape their strategic focus on operational efficiency and market expansion.
The Moat Duel: Analyzing Competitive Defensibility
Structural moats are the sole barriers protecting long-term profits from relentless competitive erosion. Here is how two insurers defend their turf:
The Hartford Financial Services Group, Inc.: Intangible Assets Powerhouse
I see Hartford’s moat rooted in deep intangible assets and diversified insurance products. This fuels a robust ROIC 21.8% above WACC and stable margins. New risk management services in 2026 should widen this lead.
Principal Financial Group, Inc.: Efficient Capital Allocation Leader
Principal leans on superior capital efficiency, boasting an ROIC over 10x its WACC and rapid earnings growth. Unlike Hartford’s broad product moat, Principal’s focus on retirement solutions drives its expanding profitability in 2026.
Intangible Assets vs. Capital Efficiency: The Moat Face-Off
Both firms exhibit very favorable moats with growing ROIC trends. However, Principal’s extraordinary capital returns trump Hartford’s strong margin stability. Principal is better positioned to sustain market share through relentless value creation.
Which stock offers better returns?
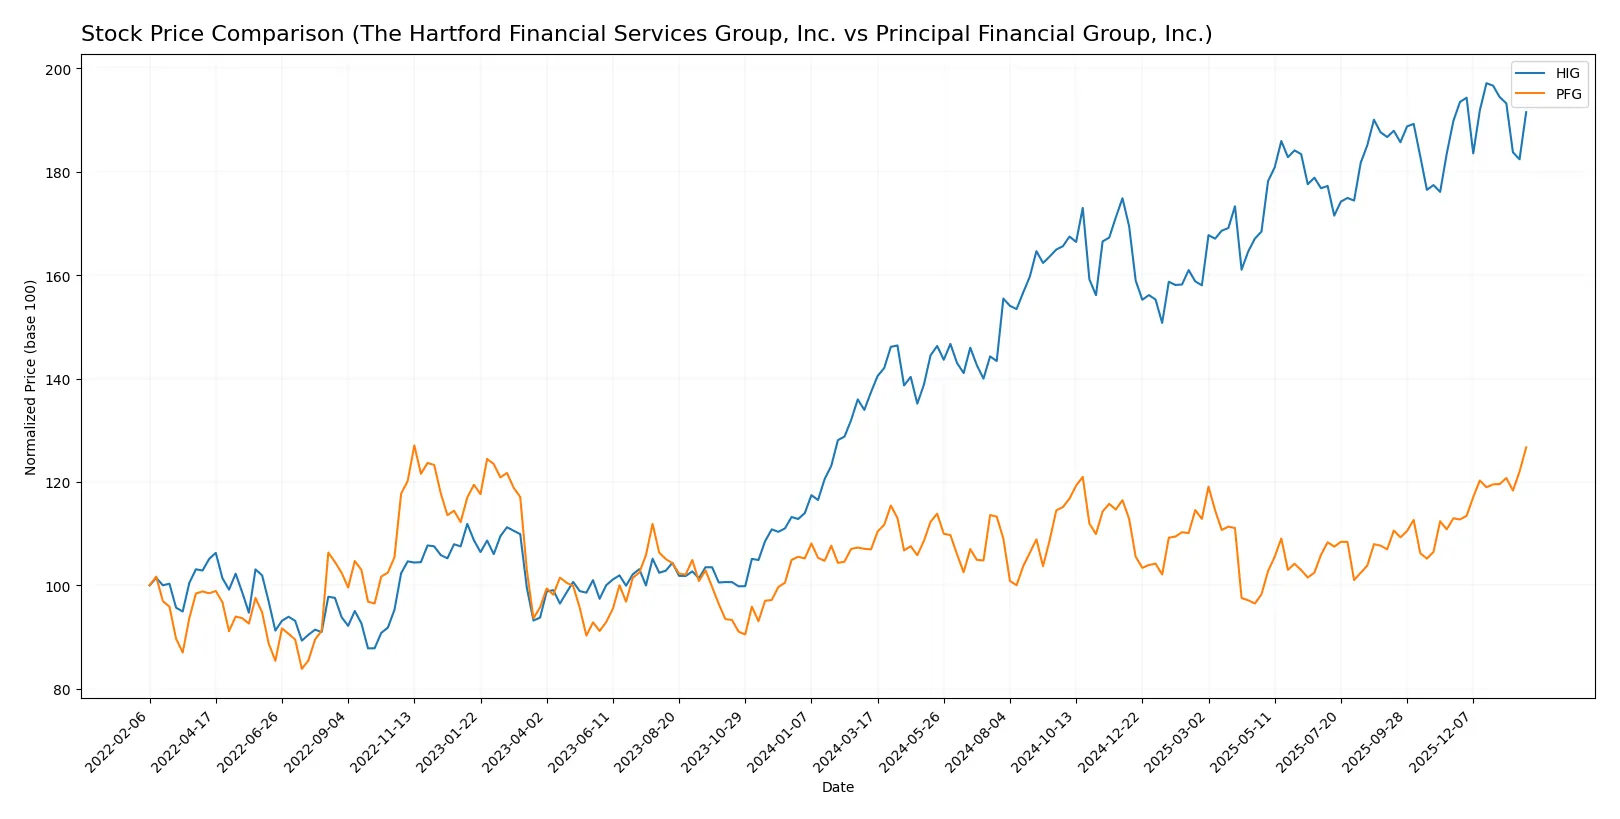
Over the past 12 months, The Hartford Financial Services Group, Inc. (HIG) and Principal Financial Group, Inc. (PFG) showed distinct bullish trends with varying momentum and trading dynamics.
Trend Comparison
HIG’s stock increased 39.44% over the past year, signaling a bullish trend with decelerating momentum. It ranged between 95.3 and 139.01, showing moderate volatility (11.88 std deviation).
PFG’s stock rose 18.44% over 12 months, confirming a bullish trend with accelerating momentum. It traded between 72.14 and 94.72, with lower volatility (4.49 std deviation).
HIG outperformed PFG with a stronger overall price gain, despite decelerating momentum, while PFG showed accelerating strength but a smaller total return.
Target Prices
Analysts present a confident target price consensus for both Hartford Financial Services and Principal Financial Group.
| Company | Target Low | Target High | Consensus |
|---|---|---|---|
| The Hartford Financial Services Group, Inc. | 135 | 161 | 152.75 |
| Principal Financial Group, Inc. | 85 | 100 | 91.5 |
The Hartford’s target consensus at 152.75 suggests upside from its current 135.06 price, signaling bullish sentiment. Principal Financial’s 91.5 consensus is slightly below its 94.72 price, indicating cautious expectations.

Don’t Let Luck Decide Your Entry Point
Optimize your entry points with our advanced ProRealTime indicators. You’ll get efficient buy signals with precise price targets for maximum performance. Start outperforming now!
How do institutions grade them?
The following tables detail recent grades from major institutions for the two companies:
The Hartford Financial Services Group, Inc. Grades
This table summarizes recent institutional grades for The Hartford Financial Services Group, Inc.:
| Grading Company | Action | New Grade | Date |
|---|---|---|---|
| Roth Capital | Maintain | Neutral | 2026-01-30 |
| Cantor Fitzgerald | Maintain | Overweight | 2026-01-14 |
| Wells Fargo | Maintain | Overweight | 2026-01-13 |
| Evercore ISI Group | Maintain | In Line | 2026-01-07 |
| JP Morgan | Maintain | Neutral | 2026-01-07 |
| Keefe, Bruyette & Woods | Maintain | Outperform | 2026-01-06 |
| Piper Sandler | Maintain | Overweight | 2025-12-22 |
| UBS | Maintain | Buy | 2025-12-08 |
| Argus Research | Maintain | Buy | 2025-11-25 |
| Morgan Stanley | Maintain | Equal Weight | 2025-11-17 |
Principal Financial Group, Inc. Grades
This table summarizes recent institutional grades for Principal Financial Group, Inc.:
| Grading Company | Action | New Grade | Date |
|---|---|---|---|
| Wells Fargo | Maintain | Underweight | 2026-01-13 |
| UBS | Maintain | Neutral | 2026-01-08 |
| JP Morgan | Downgrade | Neutral | 2026-01-05 |
| Piper Sandler | Maintain | Overweight | 2025-12-23 |
| Keefe, Bruyette & Woods | Maintain | Market Perform | 2025-10-30 |
| Wells Fargo | Maintain | Underweight | 2025-10-29 |
| Morgan Stanley | Upgrade | Equal Weight | 2025-10-23 |
| Keefe, Bruyette & Woods | Maintain | Market Perform | 2025-10-09 |
| Evercore ISI Group | Maintain | In Line | 2025-10-09 |
| Barclays | Maintain | Underweight | 2025-10-08 |
Which company has the best grades?
The Hartford consistently receives stronger ratings, including multiple “Buy,” “Overweight,” and “Outperform” grades. Principal Financial exhibits more cautious ratings, with several “Underweight” and “Market Perform” grades. Investors may perceive The Hartford as having greater institutional confidence.
Risks specific to each company
The following categories identify the critical pressure points and systemic threats facing both firms in the 2026 market environment:
1. Market & Competition
The Hartford Financial Services Group, Inc.
- Faces strong competition in diversified insurance and risk management sectors, relying on US and UK markets.
Principal Financial Group, Inc.
- Competes globally with a focus on retirement, asset management, and insurance products, facing diverse regional competitors.
2. Capital Structure & Debt
The Hartford Financial Services Group, Inc.
- Maintains a low debt-to-equity ratio (0.23) and strong interest coverage (24.92), signaling conservative leverage.
Principal Financial Group, Inc.
- Slightly higher debt-to-equity ratio (0.37) but excellent interest coverage (726.77), indicating low default risk despite more debt.
3. Stock Volatility
The Hartford Financial Services Group, Inc.
- Displays low beta (0.61), indicating lower stock volatility and defensive characteristics.
Principal Financial Group, Inc.
- Exhibits moderate beta (0.9), suggesting higher sensitivity to market swings and more volatility risk.
4. Regulatory & Legal
The Hartford Financial Services Group, Inc.
- Exposed to regulatory changes in insurance underwriting and claims management, particularly in US and UK.
Principal Financial Group, Inc.
- Faces complex regulatory environments across multiple international jurisdictions, increasing compliance risks.
5. Supply Chain & Operations
The Hartford Financial Services Group, Inc.
- Operational risks stem from managing diverse insurance lines and maintaining underwriting discipline.
Principal Financial Group, Inc.
- Operational complexity is high due to global asset management and retirement services, requiring robust infrastructure.
6. ESG & Climate Transition
The Hartford Financial Services Group, Inc.
- Faces pressure to adapt insurance products to climate risks; transition risk impacts underwriting portfolios.
Principal Financial Group, Inc.
- Must integrate ESG factors in asset management and insurance underwriting across varied international markets.
7. Geopolitical Exposure
The Hartford Financial Services Group, Inc.
- Concentrated exposure in the US and UK limits geopolitical risk but increases regional dependency.
Principal Financial Group, Inc.
- Significant international footprint exposes it to currency, political, and regulatory risks in emerging markets.
Which company shows a better risk-adjusted profile?
The Hartford’s most impactful risk is its high current ratio anomaly, signaling potential liquidity management issues despite strong profitability. Principal’s key risk lies in elevated stock volatility and complex regulatory exposure internationally. Hartford’s lower beta and conservative leverage provide a more stable risk-adjusted profile. Recent strong interest coverage for Principal offsets debt concerns but volatility remains a caution. I conclude Hartford offers a better risk-adjusted position in the 2026 market.
Final Verdict: Which stock to choose?
The Hartford Financial Services Group, Inc. (HIG) excels as a cash-generating powerhouse with a durable competitive advantage. Its standout strength is a high and growing ROIC far above WACC, signaling strong value creation. However, an unusually high current ratio is a point of vigilance, hinting at potential inefficiencies. HIG suits aggressive growth portfolios that tolerate operational nuances for superior returns.
Principal Financial Group, Inc. (PFG) offers a strategic moat rooted in exceptional capital efficiency and robust free cash flow yields. Its conservative debt profile and higher dividend yield suggest relative safety compared to HIG. PFG fits well in GARP portfolios, balancing growth potential with reasonable valuation and income stability.
If you prioritize aggressive value creation and strong profitability expansion, HIG is the compelling choice due to its superior ROIC and growth trajectory. However, if you seek a more stable income stream with a wide economic moat and solid cash flow, PFG offers better stability and a defensive growth profile. Both companies demonstrate durable advantages but cater to distinct investor risk appetites.
Disclaimer: Investment carries a risk of loss of initial capital. The past performance is not a reliable indicator of future results. Be sure to understand risks before making an investment decision.
Go Further
I encourage you to read the complete analyses of The Hartford Financial Services Group, Inc. and Principal Financial Group, Inc. to enhance your investment decisions: