In the evolving landscape of regulated electric utilities, Xcel Energy Inc. (XEL) and PPL Corporation (PPL) stand out as prominent players. Both companies serve millions of customers with electricity and natural gas across key U.S. regions, focusing on innovation and sustainability in energy generation. Comparing their strategies and market positions offers valuable insights. Join me as we analyze which company presents the most compelling opportunity for investors today.
Table of contents
Companies Overview
I will begin the comparison between Xcel Energy Inc. and PPL Corporation by providing an overview of these two companies and their main differences.
Xcel Energy Inc. Overview
Xcel Energy Inc. operates as a regulated electric utility serving approximately 3.7M electricity and 2.1M natural gas customers across several US states including Colorado, Michigan, and Texas. The company generates electricity from diverse sources such as coal, nuclear, natural gas, wind, and solar. Founded in 1909 and headquartered in Minneapolis, Xcel Energy focuses on both energy generation and distribution, including natural gas pipeline development.
PPL Corporation Overview
PPL Corporation is a utility holding company providing electricity and natural gas services primarily in Kentucky, Pennsylvania, and parts of Virginia. It serves over 2.7M electric and natural gas customers, operating through Kentucky Regulated and Pennsylvania Regulated segments. The company generates power from coal, gas, hydro, and solar sources. Founded in 1920 and based in Allentown, PPL also sells wholesale electricity and maintains operations in both the US and the UK.
Key similarities and differences
Both companies operate in the regulated electric utility industry, delivering electricity and natural gas to residential and commercial customers. Xcel Energy has a broader geographic footprint and a wider range of energy sources, including biomass and wind, while PPL focuses more regionally with segments in Kentucky and Pennsylvania. Additionally, Xcel Energy manages natural gas infrastructure development, whereas PPL holds a utility holding company structure with international operations.
Income Statement Comparison
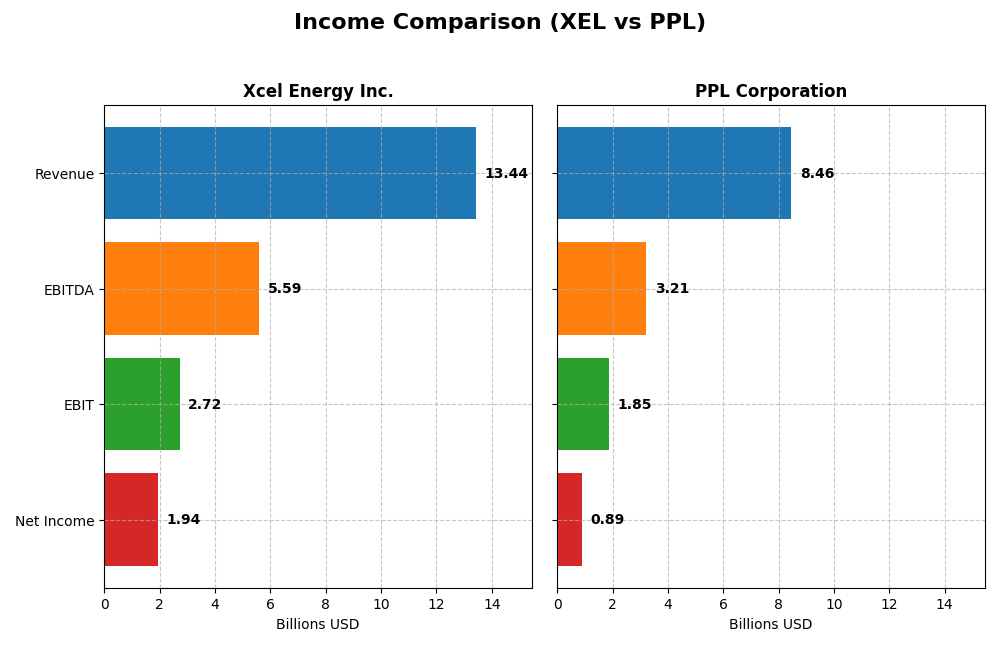
This table compares key income statement metrics for Xcel Energy Inc. and PPL Corporation for the fiscal year 2024, highlighting their revenue, profitability, and earnings per share.
| Metric | Xcel Energy Inc. (XEL) | PPL Corporation (PPL) |
|---|---|---|
| Market Cap | 44B | 26B |
| Revenue | 13.44B | 8.46B |
| EBITDA | 5.59B | 3.21B |
| EBIT | 2.72B | 1.85B |
| Net Income | 1.94B | 0.89B |
| EPS | 3.44 | 1.20 |
| Fiscal Year | 2024 | 2024 |
Income Statement Interpretations
Xcel Energy Inc.
Xcel Energy’s revenue grew 16.61% over 2020-2024 but declined by 5.39% in 2024, while net income increased 31.43% overall and rose 9.3% in the last year. Margins improved, with a gross margin of 45.74% and net margin of 14.4%, reflecting a favorable trend. The 2024 year showed margin expansion despite revenue contraction, supported by disciplined cost controls.
PPL Corporation
PPL’s revenue increased 54.59% over five years, with a modest 1.8% rise in 2024. However, net income fell 39.55% overall, though net margin and EPS improved 17.87% and 20% respectively in 2024. Margins remain stable to favorable, with a gross margin near 40% and EBIT margin at 21.91%. The most recent year reflects mixed signals: revenue growth but net income challenges.
Which one has the stronger fundamentals?
Xcel Energy demonstrates stronger fundamentals with consistent net income growth and margin improvements over the period, despite recent revenue softness. PPL shows solid revenue growth but faces significant net income and margin downturns overall. Both have favorable income statement evaluations, yet Xcel’s steadier profitability and margin expansion position it with a more robust earnings profile.
Financial Ratios Comparison
The table below presents key financial ratios for Xcel Energy Inc. (XEL) and PPL Corporation (PPL) for the fiscal year 2024, providing a snapshot of their profitability, liquidity, leverage, and market valuation metrics.
| Ratios | Xcel Energy Inc. (XEL) | PPL Corporation (PPL) |
|---|---|---|
| ROE | 9.92% | 6.31% |
| ROIC | 4.59% | 3.59% |
| P/E | 19.64 | 26.97 |
| P/B | 1.95 | 1.70 |
| Current Ratio | 0.67 | 0.86 |
| Quick Ratio | 0.57 | 0.71 |
| D/E (Debt-to-Equity) | 1.55 | 1.19 |
| Debt-to-Assets | 43.13% | 40.92% |
| Interest Coverage | 2.02 | 2.36 |
| Asset Turnover | 0.19 | 0.21 |
| Fixed Asset Turnover | 0.23 | 0.26 |
| Payout Ratio | 60.69% | 84.12% |
| Dividend Yield | 3.09% | 3.12% |
Interpretation of the Ratios
Xcel Energy Inc.
Xcel Energy shows a mixed ratio profile with 21.43% favorable and 50% unfavorable ratios, leading to a slightly unfavorable overall view. Strong points include a favorable net margin of 14.4% and a dividend yield of 3.09%, but weaknesses arise from a low current ratio of 0.67 and poor asset turnover. Its dividend payments appear sustainable given the stable yield, though coverage by free cash flow is negative, signaling caution.
PPL Corporation
PPL Corporation presents a less favorable ratio profile with 21.43% favorable and 57.14% unfavorable ratios, resulting in an unfavorable global opinion. It maintains a decent net margin of 10.49% and a slightly higher dividend yield of 3.12%, but suffers from a high P/E of 26.97 and suboptimal liquidity ratios below 1. Dividend payments are supported, yet free cash flow remains negative, which may affect long-term payout sustainability.
Which one has the best ratios?
Comparing both, Xcel Energy holds a marginally better ratio profile with fewer unfavorable metrics and a slightly more balanced valuation. Both companies pay dividends with similar yields, but Xcel’s stronger net margin and slightly better capital returns contrast with PPL’s higher P/E and liquidity concerns. Neither company shows a clearly superior risk-return ratio, demanding careful consideration.
Strategic Positioning
This section compares the strategic positioning of Xcel Energy Inc. and PPL Corporation, including Market position, Key segments, and Exposure to technological disruption:
Xcel Energy Inc.
- Larger market cap with lower beta indicating stable demand and moderate competitive pressure.
- Focuses on regulated electric and natural gas utilities across multiple US states, serving millions of customers.
- Generates electricity from diverse sources including coal, nuclear, natural gas, and renewables, showing broad energy exposure.
PPL Corporation
- Smaller market cap with higher beta implying slightly higher market volatility and competition.
- Concentrated on regulated electric and natural gas segments mainly in Kentucky and Pennsylvania regions.
- Electricity generation mainly from coal, gas, hydro, and solar, with regulated operations in US and UK.
Xcel Energy Inc. vs PPL Corporation Positioning
Xcel Energy displays a diversified geographic and energy source footprint, serving a larger customer base, while PPL has a more regionally focused approach with concentrated segments. Diversification offers broader exposure but may increase operational complexity.
Which has the best competitive advantage?
Both companies are shedding value with ROIC below WACC but show growing profitability trends. Neither currently exhibits a strong economic moat; however, Xcel’s larger scale and diversified energy mix may imply a modest edge in competitive positioning.
Stock Comparison
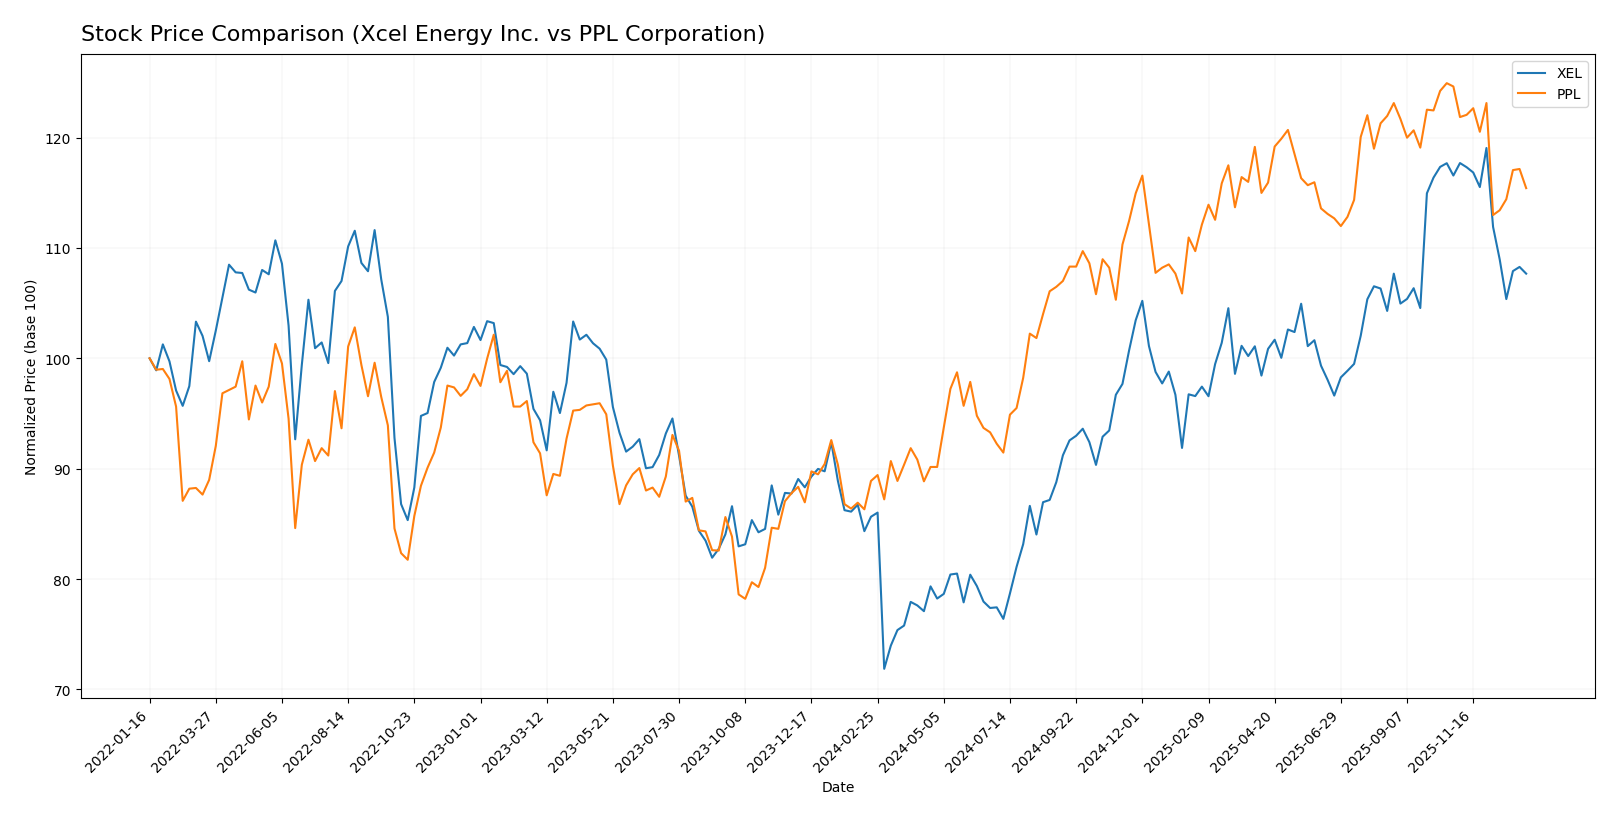
The stock prices of Xcel Energy Inc. (XEL) and PPL Corporation (PPL) have shown significant bullish trends over the past 12 months, with both experiencing deceleration in momentum and recent downward corrections from late 2025 to early 2026.
Trend Analysis
Xcel Energy Inc. (XEL) demonstrated a 25.72% price increase over the past year, confirming a bullish trend despite deceleration in growth and a recent 7.63% decline from October 2025 to January 2026.
PPL Corporation (PPL) posted a 29.84% price increase over the same period, also bullish with decelerating momentum, followed by a recent 7.39% drop between late 2025 and early 2026.
Comparing both stocks, PPL delivered the highest market performance over the past year, outperforming XEL by approximately 4 percentage points.
Target Prices
Analysts provide a clear target price consensus for Xcel Energy Inc. and PPL Corporation.
| Company | Target High | Target Low | Consensus |
|---|---|---|---|
| Xcel Energy Inc. | 96 | 81 | 87 |
| PPL Corporation | 45 | 36 | 41.29 |
The consensus targets for both companies exceed their current stock prices, indicating moderate upside potential based on analyst expectations. Xcel Energy’s target consensus is about 17% above its current price of 74.26 USD, while PPL’s is roughly 19% above its current price of 34.59 USD.
Analyst Opinions Comparison
This section compares analysts’ ratings and grades for Xcel Energy Inc. and PPL Corporation:
Rating Comparison
Xcel Energy Inc. Rating
- Rating: C+ with a very favorable status
- Discounted Cash Flow Score: 4, favorable valuation
- ROE Score: 3, moderate efficiency generating profit
- ROA Score: 2, moderate asset utilization
- Debt To Equity Score: 1, very unfavorable financial risk
- Overall Score: 2, moderate financial standing
PPL Corporation Rating
- Rating: C+ with a very favorable status
- Discounted Cash Flow Score: 1, very unfavorable valuation
- ROE Score: 3, moderate efficiency generating profit
- ROA Score: 3, moderate asset utilization
- Debt To Equity Score: 2, moderate financial risk
- Overall Score: 2, moderate financial standing
Which one is the best rated?
Both companies share the same overall rating of C+ and moderate overall scores. However, Xcel Energy shows a stronger discounted cash flow score, while PPL has better asset utilization and lower financial risk, reflecting mixed strengths.
Scores Comparison
Here is a comparison of the Altman Z-Score and Piotroski Score for Xcel Energy Inc. and PPL Corporation:
XEL Scores
- Altman Z-Score: 0.89, indicating distress zone risk
- Piotroski Score: 5, reflecting average financial strength
PPL Scores
- Altman Z-Score: 0.97, indicating distress zone risk
- Piotroski Score: 6, reflecting average financial strength
Which company has the best scores?
Based strictly on the data, PPL has slightly higher scores in both Altman Z-Score and Piotroski Score compared to XEL. Both are in the distress zone for bankruptcy risk but show average financial strength.
Grades Comparison
Here is a detailed comparison of the recent grades assigned to Xcel Energy Inc. and PPL Corporation by reputable grading companies:
Xcel Energy Inc. Grades
The following table summarizes the latest grades given by recognized financial institutions to Xcel Energy Inc.:
| Grading Company | Action | New Grade | Date |
|---|---|---|---|
| UBS | Maintain | Neutral | 2025-12-17 |
| Keybanc | Maintain | Overweight | 2025-12-12 |
| JP Morgan | Maintain | Overweight | 2025-12-11 |
| Barclays | Maintain | Overweight | 2025-11-05 |
| Citigroup | Maintain | Buy | 2025-11-03 |
| UBS | Maintain | Neutral | 2025-10-31 |
| Mizuho | Maintain | Outperform | 2025-10-27 |
| Jefferies | Maintain | Buy | 2025-10-16 |
| Keybanc | Maintain | Overweight | 2025-10-15 |
| BMO Capital | Maintain | Outperform | 2025-10-15 |
The overall trend for Xcel Energy Inc. shows consistent positive sentiment, with multiple overweight and buy ratings maintained over recent months.
PPL Corporation Grades
Below is the summary of recent grades awarded to PPL Corporation by established financial firms:
| Grading Company | Action | New Grade | Date |
|---|---|---|---|
| UBS | Maintain | Neutral | 2025-12-17 |
| Wells Fargo | Maintain | Overweight | 2025-12-12 |
| JP Morgan | Maintain | Overweight | 2025-12-11 |
| BMO Capital | Maintain | Outperform | 2025-10-21 |
| B of A Securities | Maintain | Buy | 2025-10-16 |
| Barclays | Maintain | Equal Weight | 2025-10-14 |
| UBS | Maintain | Neutral | 2025-10-10 |
| Morgan Stanley | Maintain | Overweight | 2025-09-25 |
| Barclays | Maintain | Equal Weight | 2025-07-01 |
| Morgan Stanley | Maintain | Overweight | 2025-06-18 |
PPL Corporation’s grades indicate a generally positive outlook, with several overweight and buy ratings, though a few equal weight ratings suggest some caution.
Which company has the best grades?
Both Xcel Energy Inc. and PPL Corporation have received predominantly positive grades, with consensus ratings of “Buy.” Xcel Energy shows a slightly higher concentration of buy and outperform grades, potentially signaling stronger analyst confidence. This may affect investor sentiment by suggesting relatively better near-term prospects for Xcel Energy compared to PPL.
Strengths and Weaknesses
Below is a comparison of key strengths and weaknesses of Xcel Energy Inc. (XEL) and PPL Corporation (PPL) based on the most recent financial and operational data.
| Criterion | Xcel Energy Inc. (XEL) | PPL Corporation (PPL) |
|---|---|---|
| Diversification | Primarily focused on regulated electric (22.3B USD) and natural gas (4.5B USD) segments with limited other segments revenue | Concentrated in regulated utilities across Kentucky, Pennsylvania, and Rhode Island with no significant diversification outside regulated markets |
| Profitability | Net margin favorable at 14.4%, but ROIC (4.59%) below WACC (5.1%) indicates value destruction despite improving profitability | Net margin favorable at 10.5%, but ROIC (3.59%) below WACC (5.5%) signals value destruction though profitability is rising |
| Innovation | Moderate innovation; growing ROIC trend (+10%) suggests improving operational efficiency | Similar innovation level; stronger ROIC growth (+19%) indicates improving capital returns but still below cost of capital |
| Global presence | Mainly US-focused with no international exposure | Primarily US-regulated markets, with prior international segments divested or minimal |
| Market Share | Large market share in regulated electric and natural gas sectors in key regions | Strong regional market share in Kentucky, Pennsylvania, Rhode Island utilities |
Key takeaways: Both companies show improving profitability trends with growing ROIC, yet both are currently destroying value as ROIC remains below WACC. Xcel Energy has a larger and more diversified regulated portfolio, while PPL has a strong regional focus but higher ROIC growth. Investors should weigh improving operational trends against existing value destruction risks.
Risk Analysis
Below is a comparative table highlighting key risk factors for Xcel Energy Inc. (XEL) and PPL Corporation (PPL) as of 2024 financial data:
| Metric | Xcel Energy Inc. (XEL) | PPL Corporation (PPL) |
|---|---|---|
| Market Risk | Low beta 0.47, less volatile | Moderate beta 0.72, higher volatility |
| Debt level | High leverage, Debt/Equity 1.55 (unfavorable) | High leverage, Debt/Equity 1.19 (unfavorable) |
| Regulatory Risk | Significant, as a regulated utility | Significant, operates in US and UK markets |
| Operational Risk | Medium, diverse energy sources and infrastructure | Medium, regulated electric and gas services |
| Environmental Risk | Exposure to fossil fuels and renewables transition | Exposure to coal and gas, with renewables presence |
| Geopolitical Risk | Low, US-focused operations | Moderate, with UK exposure |
The most impactful and likely risks for both companies are their high debt levels combined with regulatory risks inherent in the utility sector. Both are in the distress zone for bankruptcy risk per Altman Z-Score, indicating financial vulnerability. Market volatility is lower for XEL, but both face operational challenges amid energy transitions and environmental regulations. Careful monitoring of debt management and regulatory changes is essential.
Which Stock to Choose?
Xcel Energy Inc. (XEL) shows a mixed income evolution with a favorable net margin of 14.4% and positive growth in net income and EPS over five years, but with a slightly unfavorable global financial ratios evaluation and a moderate overall rating of C+. Its debt level is high with a net debt to EBITDA above 5, and the company is classified as slightly unfavorable in terms of economic moat.
PPL Corporation (PPL) displays a favorable income statement with a 10.49% net margin and positive recent growth in EBIT and EPS, yet overall net income has declined over the longer term. Financial ratios are more unfavorable compared to XEL, especially with a higher PE ratio and moderate debt metrics, while its rating is also C+ with moderate overall scores and a slightly unfavorable economic moat.
Investors focused on income growth and stronger recent profitability might see XEL as more attractive, while those prioritizing stability with moderate financial risk might consider PPL; both companies have similar overall ratings but differ in financial ratio profiles and income trends, suggesting the choice could depend on risk tolerance and investment strategy.
Disclaimer: Investment carries a risk of loss of initial capital. The past performance is not a reliable indicator of future results. Be sure to understand risks before making an investment decision.
Go Further
I encourage you to read the complete analyses of Xcel Energy Inc. and PPL Corporation to enhance your investment decisions: