WEC Energy Group, Inc. and PPL Corporation are two prominent players in the regulated electric utility sector, each serving millions of customers across key U.S. regions. Both companies focus on generating and distributing electricity and natural gas, blending traditional and renewable energy sources to drive innovation. This comparison explores their market positions and strategies to help you, the investor, identify the more compelling opportunity for your portfolio.

Table of contents
Companies Overview
I will begin the comparison between WEC Energy Group and PPL Corporation by providing an overview of these two companies and their main differences.
WEC Overview
WEC Energy Group, Inc. operates as a regulated electric utility in the United States, providing natural gas, electricity, and renewable energy services through six segments. The company generates power from diverse sources, including coal, natural gas, oil, hydroelectric, wind, solar, and biomass. It maintains extensive infrastructure with tens of thousands of miles of distribution lines and natural gas mains, serving millions of customers primarily in the Midwest.
PPL Overview
PPL Corporation is a utility holding company delivering electricity and natural gas in the US and UK, serving over 2 million customers across Kentucky, Pennsylvania, and parts of Virginia. Its operations are divided into Kentucky and Pennsylvania regulated segments. PPL generates electricity from coal, gas, hydro, and solar sources, and it also sells wholesale electricity to municipalities. Founded in 1920, it is headquartered in Allentown, Pennsylvania.
Key similarities and differences
Both companies operate in the regulated electric utility sector, focusing on electricity and natural gas distribution and generation. WEC has a broader energy mix with additional renewable and nonregulated segments, while PPL emphasizes its regional regulated markets in Kentucky and Pennsylvania, including international presence in the UK. WEC’s infrastructure appears more extensive, whereas PPL offers wholesale electricity sales and operates fewer segments.
Income Statement Comparison
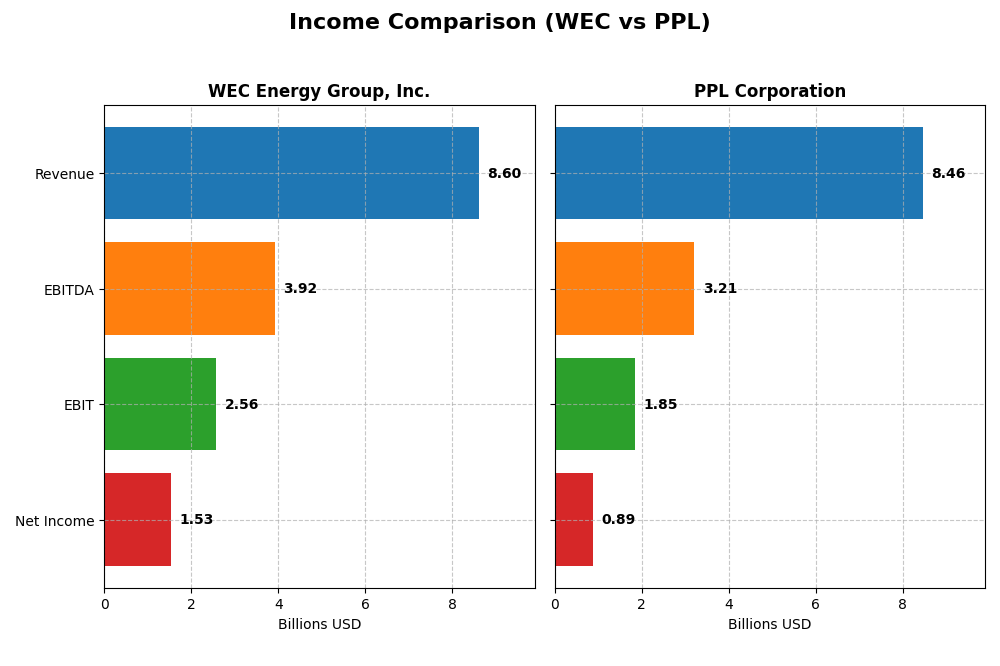
This table presents a side-by-side comparison of key income statement metrics for WEC Energy Group, Inc. and PPL Corporation for the fiscal year 2024.
| Metric | WEC Energy Group, Inc. | PPL Corporation |
|---|---|---|
| Market Cap | 33.5B | 25.6B |
| Revenue | 8.60B | 8.46B |
| EBITDA | 3.92B | 3.21B |
| EBIT | 2.56B | 1.85B |
| Net Income | 1.53B | 888M |
| EPS | 4.81 | 1.20 |
| Fiscal Year | 2024 | 2024 |
Income Statement Interpretations
WEC Energy Group, Inc.
WEC Energy Group displayed overall revenue growth of 18.76% from 2020 to 2024, with net income rising 27.25% over the same period. Margins improved, supported by a gross margin of 44.02% and a net margin of 17.77%, both deemed favorable. In 2024, revenue declined by 3.3%, but net margin and earnings per share grew substantially, indicating improved profitability despite lower top-line figures.
PPL Corporation
PPL Corporation’s revenue increased 54.59% between 2020 and 2024, while net income declined by 39.55%, reflecting mixed performance. Its gross margin stood at 40.1% and net margin at 10.49%, both labeled favorable. In 2024, revenue grew modestly by 1.8%, with notable improvements in EBIT and net margin, though its overall net income and EPS growth over the period were unfavorable.
Which one has the stronger fundamentals?
WEC Energy Group demonstrates stronger fundamentals with consistent revenue and net income growth, favorable margin expansions, and solid profitability improvements in the latest year. PPL shows significant revenue growth but suffers from declining net income and margin deterioration over the period. WEC’s higher margin stability and positive earnings trends suggest a more resilient income statement profile.
Financial Ratios Comparison
The table below presents the most recent financial ratios for WEC Energy Group, Inc. and PPL Corporation as of fiscal year 2024, facilitating a side-by-side comparison of key performance and financial health metrics.
| Ratios | WEC Energy Group, Inc. | PPL Corporation |
|---|---|---|
| ROE | 12.30% | 6.31% |
| ROIC | 4.14% | 3.59% |
| P/E | 19.46 | 26.97 |
| P/B | 2.39 | 1.70 |
| Current Ratio | 0.60 | 0.86 |
| Quick Ratio | 0.43 | 0.71 |
| D/E | 1.64 | 1.19 |
| Debt-to-Assets | 42.92% | 40.92% |
| Interest Coverage | 2.64 | 2.36 |
| Asset Turnover | 0.18 | 0.21 |
| Fixed Asset Turnover | 0.25 | 0.26 |
| Payout ratio | 69.10% | 84.12% |
| Dividend yield | 3.55% | 3.12% |
Interpretation of the Ratios
WEC Energy Group, Inc.
WEC shows a mixed ratio profile with favorable net margin (17.77%) and dividend yield (3.55%), but several weaknesses including a low current ratio (0.6), high debt-to-equity (1.64), and poor asset turnover (0.18). Return on equity is neutral at 12.3%. The dividend appears solid, supported by consistent payouts, yet cash flow coverage may be a concern.
PPL Corporation
PPL presents favorable net margin (10.49%) and dividend yield (3.12%), but weaker metrics such as low return on equity (6.31%), unfavorable price-to-earnings ratio (26.97), and somewhat weak liquidity with a current ratio of 0.86. Debt levels and asset turnover also appear unfavorable, suggesting operational challenges despite dividend payments.
Which one has the best ratios?
Comparing the two, WEC holds a slightly more favorable overall ratio profile with stronger profitability and dividend yield, albeit with liquidity and efficiency concerns. PPL’s ratios are generally less robust, showing more unfavorable indicators, especially in profitability and valuation metrics, leading to a less favorable assessment overall.
Strategic Positioning
This section compares the strategic positioning of WEC Energy Group and PPL Corporation, focusing on market position, key segments, and exposure to technological disruption:
WEC Energy Group, Inc.
- Strong regional presence with diversified segments in Wisconsin, Illinois, and others; regulated electric industry.
- Key segments include Wisconsin (largest), Illinois, Non-Utility Energy Infrastructure, and Other States.
- Operates with a mix of coal, natural gas, oil, hydro, wind, solar, biomass; includes electric transmission services.
PPL Corporation
- Focused on regulated electric and natural gas in Kentucky, Pennsylvania, and Rhode Island; utility holding company.
- Key segments are Kentucky Regulated, Pennsylvania Regulated, and Rhode Island Regulated electric services.
- Generates electricity using coal, gas, hydro, solar; serves US and UK markets, with regulated segments dominant.
WEC Energy Group, Inc. vs PPL Corporation Positioning
WEC exhibits a more diversified geographic and business segment approach, including non-utility infrastructure. PPL is more concentrated in regulated electric and gas markets in specific US states and the UK. WEC’s broader portfolio offers multiple revenue drivers, while PPL’s focus may enhance operational efficiency in its core regions.
Which has the best competitive advantage?
Both companies are shedding value but show growing ROIC trends, indicating improving profitability. Neither currently demonstrates a strong economic moat, but WEC’s slightly less negative ROIC compared to WACC suggests a marginally more stable competitive advantage.
Stock Comparison
The stock price movements of WEC Energy Group, Inc. and PPL Corporation over the past 12 months show notable bullish trends with decelerating momentum, followed by recent short-term declines reflecting shifting trading dynamics.

Trend Analysis
WEC Energy Group, Inc. exhibited a 34.05% price increase over the past year, indicating a bullish trend with deceleration. The stock ranged between 77.85 and 116.84, showing moderate volatility (std deviation 11.44). Recently, it declined 9.65% with lower volatility.
PPL Corporation’s stock rose 29.84% over the same period, also bullish with deceleration and lower volatility (std deviation 3.24). The price varied from 26.14 to 37.44. Its recent 7.39% decline was accompanied by mild volatility decrease.
Comparing both, WEC delivered the highest market performance with a larger overall gain and higher volatility, while PPL showed a slightly lower but still strong price appreciation.
Target Prices
Analysts provide a clear target price consensus for both WEC Energy Group, Inc. and PPL Corporation.
| Company | Target High | Target Low | Consensus |
|---|---|---|---|
| WEC Energy Group, Inc. | 136 | 105 | 122.67 |
| PPL Corporation | 45 | 36 | 41.29 |
The consensus target prices for WEC and PPL suggest moderate upside potential, trading below their respective consensus targets of 122.67 and 41.29 compared to current prices of 104.65 and 34.59 USD.
Analyst Opinions Comparison
This section compares analysts’ ratings and grades for WEC Energy Group, Inc. and PPL Corporation:
Rating Comparison
WEC Rating
- Rating: B- rating considered very favorable.
- Discounted Cash Flow Score: 1, indicating very unfavorable.
- ROE Score: 4, classified as favorable for profit efficiency.
- ROA Score: 4, favorable asset utilization.
- Debt To Equity Score: 2, moderate financial risk.
- Overall Score: 3, moderate overall financial standing.
PPL Rating
- Rating: C+ rating also considered very favorable.
- Discounted Cash Flow Score: 1, indicating very unfavorable.
- ROE Score: 3, moderate efficiency in generating profit.
- ROA Score: 3, moderate asset utilization.
- Debt To Equity Score: 2, moderate financial risk.
- Overall Score: 2, moderate overall financial standing.
Which one is the best rated?
Based on the data, WEC holds a higher overall score (3) compared to PPL (2), with superior ROE and ROA scores indicating better profitability and asset use. Both have equally unfavorable DCF scores and similar debt-to-equity ratings.
Scores Comparison
Here is a comparison of the Altman Z-Score and Piotroski Score for WEC and PPL:
WEC Scores
- Altman Z-Score: 1.14, indicating financial distress.
- Piotroski Score: 6, showing average financial health.
PPL Scores
- Altman Z-Score: 0.97, indicating financial distress.
- Piotroski Score: 6, showing average financial health.
Which company has the best scores?
Both WEC and PPL are in the distress zone based on Altman Z-Score, with PPL slightly lower. Their Piotroski Scores are equal at 6, indicating average financial strength for both companies.
Grades Comparison
Here is the detailed comparison of the grades assigned to WEC Energy Group, Inc. and PPL Corporation by leading grading companies:
WEC Energy Group, Inc. Grades
The table below presents recent grades and actions from reputable grading companies for WEC Energy Group, Inc.:
| Grading Company | Action | New Grade | Date |
|---|---|---|---|
| B of A Securities | Maintain | Neutral | 2025-12-31 |
| UBS | Maintain | Neutral | 2025-12-17 |
| Barclays | Maintain | Underweight | 2025-12-16 |
| Keybanc | Maintain | Overweight | 2025-12-12 |
| JP Morgan | Maintain | Neutral | 2025-12-11 |
| Scotiabank | Maintain | Sector Outperform | 2025-10-31 |
| BMO Capital | Maintain | Market Perform | 2025-10-21 |
| Barclays | Maintain | Equal Weight | 2025-10-21 |
| Keybanc | Maintain | Overweight | 2025-10-15 |
| UBS | Maintain | Neutral | 2025-10-10 |
WEC’s grades show a mixed trend, with several neutral and overweight ratings alongside some underweight and sector outperform assessments.
PPL Corporation Grades
The table below presents recent grades and actions from reputable grading companies for PPL Corporation:
| Grading Company | Action | New Grade | Date |
|---|---|---|---|
| UBS | Maintain | Neutral | 2025-12-17 |
| Wells Fargo | Maintain | Overweight | 2025-12-12 |
| JP Morgan | Maintain | Overweight | 2025-12-11 |
| BMO Capital | Maintain | Outperform | 2025-10-21 |
| B of A Securities | Maintain | Buy | 2025-10-16 |
| Barclays | Maintain | Equal Weight | 2025-10-14 |
| UBS | Maintain | Neutral | 2025-10-10 |
| Morgan Stanley | Maintain | Overweight | 2025-09-25 |
| Barclays | Maintain | Equal Weight | 2025-07-01 |
| Morgan Stanley | Maintain | Overweight | 2025-06-18 |
PPL Corporation’s grades predominantly indicate positive outlooks, with multiple overweight, outperform, and buy ratings.
Which company has the best grades?
PPL Corporation has received generally stronger grades, including several overweight and buy recommendations, compared to WEC Energy Group’s more mixed neutral and underweight ratings. This discrepancy may influence investors’ perception of relative growth prospects and risk profiles.
Strengths and Weaknesses
The table below summarizes the key strengths and weaknesses for WEC Energy Group, Inc. (WEC) and PPL Corporation (PPL) based on their diversification, profitability, innovation, global presence, and market share using the latest available data.
| Criterion | WEC Energy Group, Inc. (WEC) | PPL Corporation (PPL) |
|---|---|---|
| Diversification | Focused on U.S. regional utility markets, mainly Wisconsin and Illinois, with limited non-utility infrastructure exposure | Primarily U.S. regulated markets with concentration in Kentucky, Pennsylvania, and Rhode Island; limited international exposure |
| Profitability | Net margin strong at 17.8%, ROIC slightly below WACC indicating value erosion but improving trend | Lower net margin at 10.5%, ROIC also below WACC but with a stronger growth trend in profitability |
| Innovation | Moderate innovation with steady ROIC improvement but no major disruptive initiatives reported | Similar trend of improving ROIC, but no significant innovation breakthroughs documented |
| Global presence | Limited to U.S. regional markets with no notable international business | Minimal international presence after divestment of UK assets; focused on domestic regulated markets |
| Market Share | Dominant in Wisconsin and Illinois utility sectors | Strong regional presence in Kentucky and Pennsylvania, but smaller scale compared to WEC in key markets |
Key takeaways: Both WEC and PPL are regional utility companies with concentrated geographic footprints and moderate profitability challenges. While both firms show improving profitability trends, they currently operate below their capital cost benchmarks, signaling cautious investment. WEC’s stronger net margin and focused market leadership contrast with PPL’s more diverse state-level presence but weaker profitability metrics. Investors should weigh these factors carefully against risk tolerance and sector outlook.
Risk Analysis
Below is a comparative table highlighting key risks for WEC Energy Group, Inc. and PPL Corporation as of 2024, aiding investors in their risk assessment.
| Metric | WEC Energy Group, Inc. | PPL Corporation |
|---|---|---|
| Market Risk | Beta 0.573 (low volatility) | Beta 0.716 (moderate volatility) |
| Debt level | Debt/Equity 1.64 (unfavorable) | Debt/Equity 1.19 (unfavorable) |
| Regulatory Risk | High (regulated utilities sector) | High (regulated utilities sector) |
| Operational Risk | Moderate (diverse energy sources, aging infrastructure) | Moderate (regional utility operations) |
| Environmental Risk | Significant (coal and gas reliance, transition to renewables) | Significant (coal and gas reliance, renewable integration) |
| Geopolitical Risk | Low (US focused) | Moderate (US and UK operations) |
The most impactful risks for both companies stem from their debt levels and regulatory environment, common in regulated utilities. WEC’s higher leverage and exposure to an aging infrastructure slightly increase its financial risk. Both companies face environmental transition challenges due to reliance on fossil fuels, crucial for long-term sustainability. PPL’s UK exposure adds moderate geopolitical risk. Investors should weigh these risks carefully against dividend yields and sector stability.
Which Stock to Choose?
WEC Energy Group, Inc. shows a generally favorable income statement with strong net margin growth and stable profitability, despite a slight revenue decline recently. Its financial ratios are slightly unfavorable overall, weighed down by liquidity and asset turnover metrics, though dividend yield and tax burden are positive. The company carries moderate debt and holds a very favorable B- rating.
PPL Corporation displays a mixed income evolution with favorable recent revenue growth but significant declines in net income and margins over the longer term. Its financial ratios are predominantly unfavorable, especially regarding profitability and valuation metrics, with moderate debt levels. PPL holds a very favorable C+ rating but shows weaker return metrics than WEC.
For investors, WEC might appear more suitable for those prioritizing income quality and consistent profitability, while PPL could be seen as fitting for those willing to tolerate higher risk for potential growth. Both companies exhibit slightly unfavorable economic moats due to ROIC below WACC, though their profitability trends are improving.
Disclaimer: Investment carries a risk of loss of initial capital. The past performance is not a reliable indicator of future results. Be sure to understand risks before making an investment decision.
Go Further
I encourage you to read the complete analyses of WEC Energy Group, Inc. and PPL Corporation to enhance your investment decisions: