Investors seeking stability and growth in the utility sector often compare The Southern Company and PPL Corporation, two key players in regulated electric services. Both firms operate extensive electricity and natural gas networks, yet differ in scale and regional focus. Their shared commitment to innovation and renewable energy makes this comparison essential. Join me as we analyze these companies to identify which presents the most promising opportunity for your investment portfolio.
Table of contents
Companies Overview
I will begin the comparison between The Southern Company and PPL Corporation by providing an overview of these two companies and their main differences.
The Southern Company Overview
The Southern Company is a leading utility firm engaged in the generation, transmission, and distribution of electricity and natural gas. With a diversified asset base including renewable and conventional energy sources, it serves approximately 8.7M customers across several US states. Its operations also extend to digital wireless communications and fiber optics, positioning it as a broad-based energy and infrastructure provider headquartered in Atlanta.
PPL Corporation Overview
PPL Corporation is a utility holding company focused on delivering electricity and natural gas in the US and UK markets. It operates primarily in Kentucky, Pennsylvania, and parts of Virginia, serving over 2.6M customers. PPL generates electricity from coal, gas, hydro, and solar sources, and provides wholesale electricity sales. Founded in 1920, it is headquartered in Allentown, Pennsylvania, with a concentrated regional presence.
Key similarities and differences
Both companies operate in the regulated electric industry and provide electricity and natural gas services, with diversified energy generation including renewables. Southern Company is significantly larger, with nearly 29K employees and a broader geographic and operational scope, including fiber optics. PPL is more regionally focused with about 6.6K employees, serving fewer customers but extending operations internationally to the UK. Their business models overlap in regulated utilities but differ in scale and diversification.
Income Statement Comparison
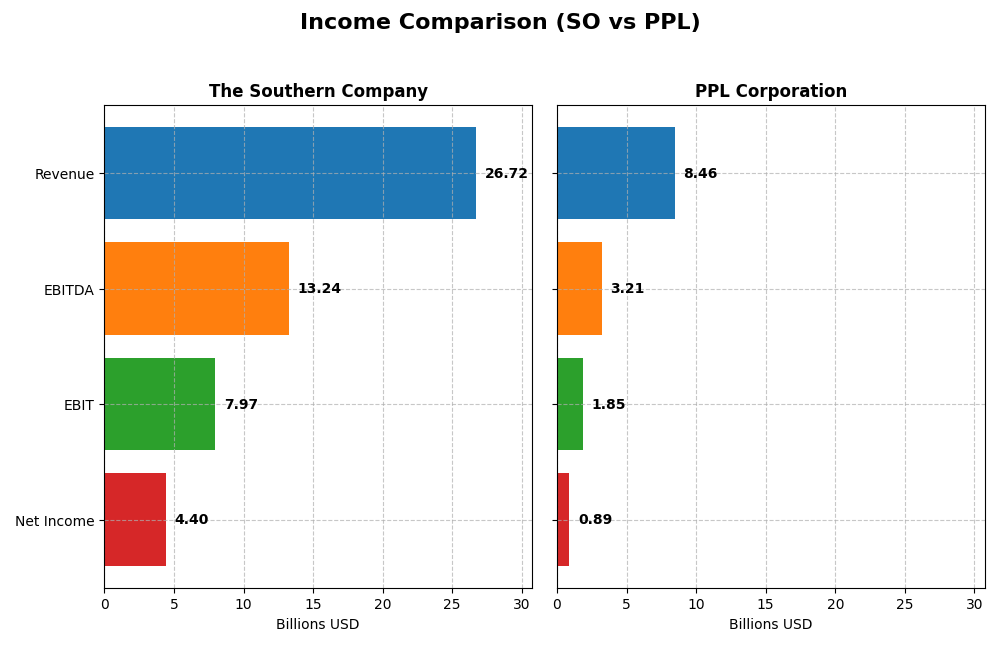
This table presents a side-by-side comparison of The Southern Company and PPL Corporation’s key income statement metrics for their most recent fiscal year, 2024.
| Metric | The Southern Company (SO) | PPL Corporation (PPL) |
|---|---|---|
| Market Cap | 95.7B | 25.6B |
| Revenue | 26.7B | 8.46B |
| EBITDA | 13.2B | 3.21B |
| EBIT | 7.97B | 1.85B |
| Net Income | 4.40B | 886M |
| EPS | 4.02 | 1.20 |
| Fiscal Year | 2024 | 2024 |
Income Statement Interpretations
The Southern Company
The Southern Company showed consistent revenue growth from 2020 to 2024, with a 31.16% increase overall and a 5.83% rise in the last year. Net income grew favorably by 40.43% over the period, with a 4.6% net margin increase in the latest year. Gross and EBIT margins improved, reflecting efficient cost management despite slightly higher operating expenses relative to revenue.
PPL Corporation
PPL Corporation experienced a 54.59% revenue increase over 2020-2024 but only a 1.8% growth in the last year, signaling a slowdown. Net income and margins declined significantly over the full period, with a net income drop of 39.55% and a 60.9% net margin contraction. However, recent EBIT and net margin growth showed a favorable rebound in 2024, alongside improved earnings per share.
Which one has the stronger fundamentals?
The Southern Company exhibits stronger fundamentals with favorable growth in revenue, net income, and margins sustained across multiple years. Its higher gross and EBIT margins and consistent EPS growth provide stability. PPL’s recent improvements are positive but offset by its overall declining net income and margins, indicating more volatility and risk over the longer term.
Financial Ratios Comparison
The table below presents a side-by-side comparison of key financial ratios for The Southern Company (SO) and PPL Corporation (PPL) based on the most recent fiscal year 2024 data.
| Ratios | The Southern Company (SO) | PPL Corporation (PPL) |
|---|---|---|
| ROE | 13.25% | 6.31% |
| ROIC | 4.25% | 3.59% |
| P/E | 20.5 | 26.97 |
| P/B | 2.72 | 1.70 |
| Current Ratio | 0.67 | 0.86 |
| Quick Ratio | 0.46 | 0.71 |
| D/E (Debt-to-Equity) | 2.00 | 1.19 |
| Debt-to-Assets | 45.7% | 40.9% |
| Interest Coverage | 2.58 | 2.36 |
| Asset Turnover | 0.18 | 0.21 |
| Fixed Asset Turnover | 0.25 | 0.26 |
| Payout Ratio | 67.1% | 84.1% |
| Dividend Yield | 3.27% | 3.12% |
Interpretation of the Ratios
The Southern Company
The Southern Company shows a mix of favorable and unfavorable ratios. Its net margin of 16.47% and dividend yield at 3.27% are positive signs, but the low current and quick ratios (0.67 and 0.46) indicate liquidity concerns. Return on invested capital at 4.25% is weak, and debt levels are high with a debt-to-equity ratio of 2.0. The company maintains consistent dividends with a solid payout, backed by relatively stable free cash flow, though risks include high leverage.
PPL Corporation
PPL Corporation has a favorable net margin of 10.49% and a dividend yield of 3.12%, but its return on equity is low at 6.31%, and return on invested capital is also weak at 3.59%. Liquidity ratios remain below 1, with a current ratio of 0.86 and quick ratio of 0.71, reflecting potential short-term funding challenges. The debt-to-equity ratio of 1.19 is lower than its peer’s but still flagged as unfavorable. Dividend payments appear supported but carry risks due to weaker profitability metrics.
Which one has the best ratios?
Comparing both, The Southern Company and PPL Corporation share similar favorable dividend yields and net margins. However, The Southern Company has a slightly better return on equity and a lower weighted average cost of capital, while PPL faces more unfavorable ratios, especially in profitability and valuation multiples. Overall, The Southern Company’s ratios appear marginally stronger, though both face notable liquidity and leverage challenges.
Strategic Positioning
This section compares the strategic positioning of The Southern Company and PPL Corporation, focusing on market position, key segments, and exposure to technological disruption:
The Southern Company
- Large market cap of 96B USD with low beta, facing regulated electric competition.
- Diverse segments including gas distribution, pipeline investments, wholesale gas, and multiple power generation assets.
- Owns and operates various renewable and traditional energy assets, including hydro, solar, wind, nuclear, and battery storage.
PPL Corporation
- Smaller market cap of 26B USD with moderate beta, operating in regulated utilities.
- Concentrated primarily in regulated electric and gas segments across Kentucky, Pennsylvania, and Rhode Island.
- Generates electricity mainly from coal, gas, hydro, and solar, with regulated focus in US and UK markets.
The Southern Company vs PPL Corporation Positioning
The Southern Company pursues a diversified business model spanning electricity generation, gas distribution, and renewable assets, offering broad exposure but complexity. PPL maintains a more concentrated approach focused on regulated electric and gas markets, providing regional specialization but less segment diversity.
Which has the best competitive advantage?
Both companies are slightly unfavorable in MOAT evaluation, shedding value despite growing ROIC trends. Southern Company’s larger scale and asset diversity contrast with PPL’s regional regulatory focus, but neither currently demonstrates a strong sustainable competitive advantage.
Stock Comparison
The stock prices of The Southern Company (SO) and PPL Corporation (PPL) have exhibited strong bullish trends over the past year, with both showing notable gains but recent deceleration and short-term declines in price levels.

Trend Analysis
The Southern Company’s stock rose by 30.88% over the past 12 months, indicating a bullish trend with decelerating momentum. The highest price reached 98.29, and recent weeks show a short-term bearish correction of -9.25%.
PPL Corporation’s stock increased by 29.84% over the past year, also demonstrating a bullish but decelerating trend. Its highest price was 37.44, with a recent modest decline of -7.39%, reflecting a mild short-term pullback.
Comparing both stocks, The Southern Company delivered a slightly higher market performance over the year. Both stocks faced recent downward corrections, but SO showed a more pronounced short-term decrease than PPL.
Target Prices
Here is the current target price consensus from verified analysts for The Southern Company and PPL Corporation.
| Company | Target High | Target Low | Consensus |
|---|---|---|---|
| The Southern Company | 103 | 76 | 93.1 |
| PPL Corporation | 45 | 36 | 41.29 |
Analysts expect moderate upside for both utilities, with Southern Company’s consensus target about 7% above its current price of $87.01, while PPL’s target suggests roughly 19% potential upside from $34.59.
Analyst Opinions Comparison
This section compares analysts’ ratings and grades for The Southern Company and PPL Corporation:
Rating Comparison
The Southern Company Rating
- Rating: B-, considered very favorable by analysts.
- Discounted Cash Flow Score: Moderate at 3.
- ROE Score: Favorable at 4, showing strong profit efficiency.
- ROA Score: Moderate at 3, indicating average asset use.
- Debt To Equity Score: Very unfavorable at 1, indicating high financial risk.
- Overall Score: Moderate at 3.
PPL Corporation Rating
- Rating: C+, also considered very favorable.
- Discounted Cash Flow Score: Very unfavorable at 1.
- ROE Score: Moderate at 3, showing average profit efficiency.
- ROA Score: Moderate at 3, indicating average asset use.
- Debt To Equity Score: Moderate at 2, indicating moderate financial risk.
- Overall Score: Moderate at 2.
Which one is the best rated?
Based strictly on the provided data, The Southern Company holds a higher rating (B-) with stronger scores in ROE and discounted cash flow, despite a weaker debt to equity score. PPL Corporation has a lower overall rating (C+) and weaker DCF score but a better debt to equity rating.
Scores Comparison
The following table compares the Altman Z-Score and Piotroski Score for The Southern Company and PPL Corporation:
SO Scores
- Altman Z-Score: 0.98, indicating financial distress zone.
- Piotroski Score: 6, reflecting average financial strength.
PPL Scores
- Altman Z-Score: 0.97, indicating financial distress zone.
- Piotroski Score: 6, reflecting average financial strength.
Which company has the best scores?
Both SO and PPL have similar scores, with Altman Z-Scores in the distress zone and identical Piotroski Scores of 6, indicating average financial strength for both companies.
Grades Comparison
The following is a comparison of the recent grades assigned to The Southern Company and PPL Corporation by reputable financial institutions:
The Southern Company Grades
This table summarizes recent grades and actions from major grading firms for The Southern Company:
| Grading Company | Action | New Grade | Date |
|---|---|---|---|
| UBS | Maintain | Neutral | 2025-12-17 |
| JP Morgan | Maintain | Neutral | 2025-12-15 |
| Jefferies | Maintain | Neutral | 2025-12-15 |
| RBC Capital | Maintain | Sector Perform | 2025-12-12 |
| Keybanc | Maintain | Underweight | 2025-12-12 |
| Mizuho | Maintain | Neutral | 2025-12-11 |
| Barclays | Maintain | Equal Weight | 2025-11-20 |
| Jefferies | Downgrade | Neutral | 2025-11-05 |
| Ladenburg Thalmann | Downgrade | Neutral | 2025-10-17 |
| Keybanc | Maintain | Underweight | 2025-10-15 |
Overall, grades for The Southern Company mainly indicate a neutral to cautious stance, with multiple firms maintaining or downgrading to neutral or underweight ratings.
PPL Corporation Grades
This table displays the latest grades and recommendations for PPL Corporation from established grading companies:
| Grading Company | Action | New Grade | Date |
|---|---|---|---|
| UBS | Maintain | Neutral | 2025-12-17 |
| Wells Fargo | Maintain | Overweight | 2025-12-12 |
| JP Morgan | Maintain | Overweight | 2025-12-11 |
| BMO Capital | Maintain | Outperform | 2025-10-21 |
| B of A Securities | Maintain | Buy | 2025-10-16 |
| Barclays | Maintain | Equal Weight | 2025-10-14 |
| UBS | Maintain | Neutral | 2025-10-10 |
| Morgan Stanley | Maintain | Overweight | 2025-09-25 |
| Barclays | Maintain | Equal Weight | 2025-07-01 |
| Morgan Stanley | Maintain | Overweight | 2025-06-18 |
PPL Corporation shows a stronger positive bias, with several firms maintaining overweight, outperform, or buy ratings consistently over recent months.
Which company has the best grades?
PPL Corporation has received generally more favorable grades than The Southern Company, with multiple overweight and buy ratings versus The Southern Company’s predominantly neutral to underweight grades. This suggests a more optimistic outlook from analysts for PPL, potentially reflecting better growth or risk-return prospects for investors.
Strengths and Weaknesses
Below is a comparison of key strengths and weaknesses of The Southern Company (SO) and PPL Corporation (PPL) based on their recent financial and operational data.
| Criterion | The Southern Company (SO) | PPL Corporation (PPL) |
|---|---|---|
| Diversification | Strong diversification in gas and electric utilities with Southern Company Gas and Electric Utilities segments generating significant revenue | Moderate diversification mainly across regional regulated utilities in Kentucky, Pennsylvania, and Rhode Island |
| Profitability | Net margin favorable at 16.47%, but ROIC (4.25%) below WACC (4.96%), indicating slight value destruction | Lower net margin at 10.49%, ROIC (3.59%) also below WACC (5.5%), showing more pronounced value destruction |
| Innovation | Limited explicit innovation focus; traditional utility business with stable but slow growth | Similar to SO, operates mainly in regulated utilities with limited innovation drivers |
| Global presence | Primarily US-focused with strong regional presence, limited international exposure | Mainly regional US operations, with historical UK exposure now reduced |
| Market Share | Large market share in southeastern US utilities, with multiple segments contributing to scale | Smaller scale with regional concentration, less market share compared to SO |
Key takeaways: Both companies face challenges in creating value as their ROICs remain below their costs of capital, although improving trends suggest growing profitability. Southern Company benefits from broader diversification and stronger margins, while PPL’s regional focus results in somewhat less favorable financial metrics. Investors should weigh growth potential against current value destruction risks.
Risk Analysis
The table below summarizes key risks for The Southern Company (SO) and PPL Corporation (PPL) based on the latest available data from 2024.
| Metric | The Southern Company (SO) | PPL Corporation (PPL) |
|---|---|---|
| Market Risk | Low beta (0.447) indicates less volatility | Moderate beta (0.716) suggests medium volatility |
| Debt level | High debt-to-equity ratio (2.0) and 45.65% debt-to-assets; unfavorable leverage | Moderate debt-to-equity (1.19) and 40.92% debt-to-assets; still risky |
| Regulatory Risk | Significant due to regulated utilities sector and multi-state operations | Similar regulatory exposure in US and UK markets |
| Operational Risk | Complex operations with diverse generation assets and large pipeline network | Regional operations with coal, gas, hydro, and solar; less diversified |
| Environmental Risk | Exposure from fossil fuel and nuclear plants; increasing renewable investments | Coal and gas generation pose transition risks; ongoing renewable integration |
| Geopolitical Risk | Mostly US-focused, limited international exposure | Some UK exposure adds moderate geopolitical risk |
In synthesis, both companies face significant debt-related risks, with Southern Company’s higher leverage posing a greater financial strain. Regulatory and environmental risks remain impactful due to their utility operations and fossil fuel assets. Market risk is lower for SO due to its stability, while PPL shows moderate volatility. Both are in financial distress zones per Altman Z-scores (below 1.8), requiring cautious risk management.
Which Stock to Choose?
The Southern Company (SO) shows a favorable income statement with strong revenue and net income growth over 2020-2024. Its financial ratios are slightly unfavorable overall, with a moderate return on equity of 13.25% and high debt levels. The company carries a very favorable B- rating, despite some weaknesses in liquidity and asset turnover.
PPL Corporation (PPL) also presents a favorable income statement but with mixed growth trends, including a notable decline in net income and margins over the period. Its financial ratios are unfavorable overall, with lower profitability metrics and moderate debt. The company holds a very favorable C+ rating but with a less robust discounted cash flow score compared to SO.
For investors, SO might appear more suitable for those prioritizing growth and profitability given its solid income performance and higher rating. Conversely, PPL could be interpreted as more appropriate for investors focused on income stability or value, despite its lower profitability and higher risks. Both companies show growing ROIC trends but remain slightly unfavorable in value creation terms.
Disclaimer: Investment carries a risk of loss of initial capital. The past performance is not a reliable indicator of future results. Be sure to understand risks before making an investment decision.
Go Further
I encourage you to read the complete analyses of The Southern Company and PPL Corporation to enhance your investment decisions: