In the evolving landscape of regulated electric utilities, Public Service Enterprise Group Incorporated (PEG) and PPL Corporation (PPL) stand out as prominent players. Both companies operate in the energy sector with a focus on electricity transmission and distribution, serving millions of customers across the United States. They also pursue innovation through renewable energy integration and efficiency programs. This article will guide you through a detailed comparison to identify which company offers the most compelling investment opportunity in 2026.

Table of contents
Companies Overview
I will begin the comparison between Public Service Enterprise Group Incorporated and PPL Corporation by providing an overview of these two companies and their main differences.
Public Service Enterprise Group Incorporated Overview
Public Service Enterprise Group Incorporated (PEG) is an energy company operating primarily in the Northeastern and Mid-Atlantic United States. Its mission focuses on electricity transmission and distribution, natural gas services, and investments in solar generation and energy efficiency programs. PEG operates a vast electric and gas infrastructure, serving residential, commercial, and industrial customers with a strong emphasis on regulated electric utilities.
PPL Corporation Overview
PPL Corporation (PPL) is a utility holding company delivering electricity and natural gas in the US and UK. It serves over 2.7 million customers across Kentucky, Pennsylvania, and parts of Virginia, generating electricity from coal, gas, hydro, and solar sources. PPL operates through Kentucky and Pennsylvania regulated segments, focusing on integrated power delivery and wholesale electricity sales to municipalities.
Key similarities and differences
Both PEG and PPL operate in the regulated electric utility sector, providing electricity and natural gas services with a regional focus in the US. PEG has a larger market cap and workforce, emphasizing solar and energy efficiency projects, while PPL also operates internationally and relies on diverse generation sources including coal and hydro. PEG’s infrastructure scale exceeds PPL’s, reflecting different operational footprints and customer bases.
Income Statement Comparison
The table below presents a side-by-side comparison of key income statement metrics for Public Service Enterprise Group Incorporated (PEG) and PPL Corporation (PPL) for the fiscal year 2024.

| Metric | Public Service Enterprise Group Incorporated (PEG) | PPL Corporation (PPL) |
|---|---|---|
| Market Cap | 39.3B | 25.6B |
| Revenue | 10.29B | 8.46B |
| EBITDA | 4.04B | 3.21B |
| EBIT | 2.67B | 1.85B |
| Net Income | 1.77B | 888M |
| EPS | 3.56 | 1.20 |
| Fiscal Year | 2024 | 2024 |
Income Statement Interpretations
Public Service Enterprise Group Incorporated
From 2020 to 2024, PEG’s revenue showed a modest overall increase of 7.15%, but net income declined by 6.98%, reflecting challenges in profitability. Margins have weakened, with net margin dropping by 13.19%. In 2024, revenue fell 8.43% year-over-year, and net income declined sharply by 30.99%, indicating a slowdown with deteriorating profitability despite solid gross and EBIT margins.
PPL Corporation
PPL experienced strong revenue growth of 54.59% over 2020-2024, although net income dropped 39.55%. Margins were generally stable, with a favorable gross margin of 40.1% and an EBIT margin of 21.91%. In 2024, revenue grew slightly by 1.8%, while net income and margins improved significantly, with net margin increasing 17.87% and EPS up 20%, signaling better recent operational performance.
Which one has the stronger fundamentals?
PPL displays stronger fundamentals with favorable trends in revenue growth, margin improvements, and recent earnings growth, supported by a positive overall income statement evaluation. PEG, however, faces unfavorable trends in net income and margins with a significant recent decline. PPL’s greater proportion of favorable financial indicators suggests comparatively healthier income statement fundamentals.
Financial Ratios Comparison
The table below presents a side-by-side comparison of key financial ratios for Public Service Enterprise Group Incorporated (PEG) and PPL Corporation (PPL) based on their most recent fiscal year 2024 data.
| Ratios | Public Service Enterprise Group (PEG) | PPL Corporation (PPL) |
|---|---|---|
| ROE | 11.0% | 6.3% |
| ROIC | 4.4% | 3.6% |
| P/E | 23.7 | 27.0 |
| P/B | 2.61 | 1.70 |
| Current Ratio | 0.65 | 0.86 |
| Quick Ratio | 0.48 | 0.71 |
| D/E (Debt-to-Equity) | 1.42 | 1.19 |
| Debt-to-Assets | 41.9% | 40.9% |
| Interest Coverage | 2.80 | 2.36 |
| Asset Turnover | 0.19 | 0.21 |
| Fixed Asset Turnover | 0.26 | 0.26 |
| Payout Ratio | 67.5% | 84.1% |
| Dividend Yield | 2.84% | 3.12% |
Interpretation of the Ratios
Public Service Enterprise Group Incorporated
Public Service Enterprise Group shows a mix of strong and weak ratios, with a favorable net margin at 17.22% but an unfavorable return on invested capital at 4.4%. The company’s current and quick ratios are low, indicating liquidity concerns, while leverage ratios are somewhat high. Its dividend yield is 2.84%, supported by a moderate payout, though risks include negative free cash flow coverage.
PPL Corporation
PPL Corporation presents a lower net margin of 10.49% and an unfavorable return on equity at 6.31%, reflecting weaker profitability. The firm’s liquidity ratios remain below 1, suggesting some short-term financial strain, and leverage ratios are high. Despite a higher dividend yield of 3.12%, the payout is pressured by less favorable valuation multiples and free cash flow constraints.
Which one has the best ratios?
Comparing both, Public Service Enterprise Group has a slightly more balanced profile with a stronger net margin and better dividend coverage, while PPL’s ratios indicate more pronounced weaknesses in profitability and valuation. Overall, PEG’s global ratios evaluation is slightly unfavorable, whereas PPL’s is unfavorable, suggesting PEG holds relatively better financial metrics.
Strategic Positioning
This section compares the strategic positioning of PEG and PPL, focusing on Market position, Key segments, and exposure to technological disruption:
Public Service Enterprise Group Incorporated (PEG)
- Leading regulated electric utility in Northeastern and Mid-Atlantic US with moderate competitive pressure.
- Key segments include electric transmission, gas distribution, solar projects, and appliance services.
- Invests in solar generation and energy efficiency programs, indicating moderate exposure to tech disruption.
PPL Corporation (PPL)
- Utility holding serving US and UK markets, facing competitive pressures in regulated segments.
- Operates Kentucky and Pennsylvania regulated segments, plus electric generation and wholesale sales.
- Generates electricity from coal, gas, hydro, solar; exposure to technological shifts in energy sources.
PEG vs PPL Positioning
PEG has a more diversified portfolio with electric and gas distribution plus solar investments, while PPL focuses on regulated electricity markets across US regions and the UK. PEG’s broader segment base contrasts with PPL’s geographic and regulatory concentration.
Which has the best competitive advantage?
Both PEG and PPL show slightly unfavorable MOAT evaluations, shedding value despite growing ROIC trends. PEG’s and PPL’s investments improve profitability, but neither currently demonstrates a strong sustainable competitive advantage.
Stock Comparison
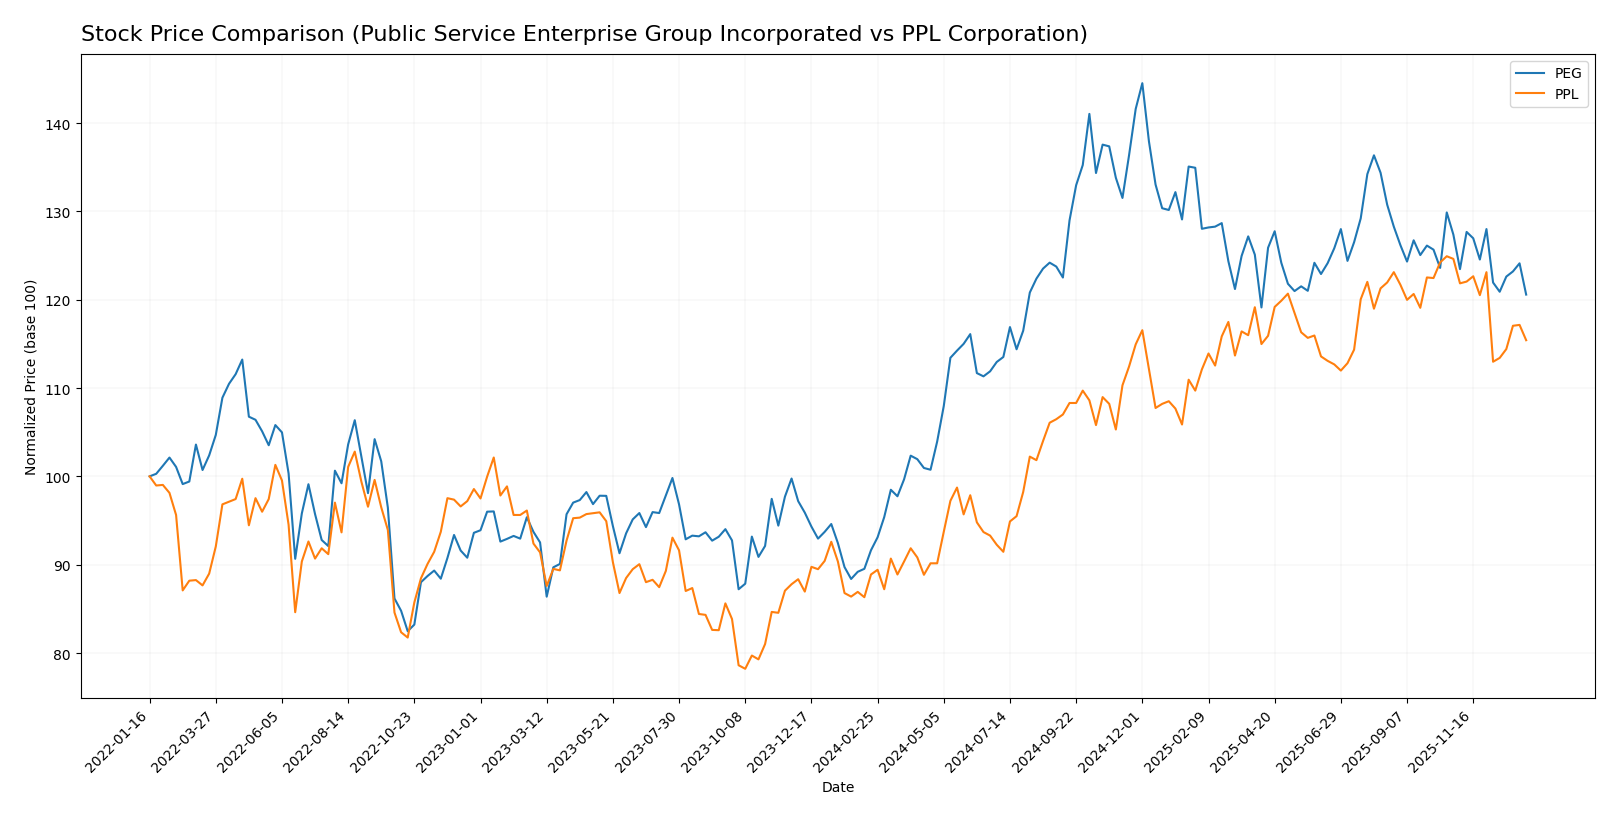
The stock price chart over the past 12 months highlights strong bullish trends for both Public Service Enterprise Group Incorporated and PPL Corporation, with notable deceleration in momentum and recent downward corrections.
Trend Analysis
Public Service Enterprise Group Incorporated (PEG) experienced a bullish trend with a 31.59% gain over the past year, accompanied by a deceleration in upward momentum and a high volatility level of 7.17. Recent weeks show a mild bearish correction of -5.33%.
PPL Corporation (PPL) also posted a bullish trend, rising by 29.84% in 12 months, with decelerating gains and lower volatility at 3.24. The latest period reveals a sharper downward move of -7.39%, indicating a short-term bearish pullback.
Comparing the two, PEG delivered the higher overall market performance with a 31.59% increase versus PPL’s 29.84%, despite both showing recent short-term declines.
Target Prices
Analysts present a clear target consensus for both Public Service Enterprise Group Incorporated and PPL Corporation.
| Company | Target High | Target Low | Consensus |
|---|---|---|---|
| Public Service Enterprise Group Incorporated | 98 | 83 | 89 |
| PPL Corporation | 45 | 36 | 41.29 |
The target consensus for PEG is significantly above its current price of 78.68 USD, indicating positive analyst expectations. Similarly, PPL’s consensus target of 41.29 USD suggests upside potential compared to the current price of 34.59 USD.
Analyst Opinions Comparison
This section compares analysts’ ratings and grades for Public Service Enterprise Group Incorporated (PEG) and PPL Corporation (PPL):
Rating Comparison
PEG Rating
- Rating: B-, classified as Very Favorable overall financial standing.
- Discounted Cash Flow Score: 1, indicating a Very Unfavorable valuation outlook.
- Return on Equity Score: 4, rated Favorable for efficient profit generation.
- Return on Assets Score: 4, Favorable for effective asset utilization.
- Debt To Equity Score: 2, Moderate risk with balanced financial leverage.
- Overall Score: 3, Moderate overall financial strength.
PPL Rating
- Rating: C+, also classified as Very Favorable overall financial standing.
- Discounted Cash Flow Score: 1, indicating a Very Unfavorable valuation outlook.
- Return on Equity Score: 3, rated Moderate for profit generation efficiency.
- Return on Assets Score: 3, Moderate for asset utilization.
- Debt To Equity Score: 2, Moderate risk with balanced financial leverage.
- Overall Score: 2, Moderate overall financial strength.
Which one is the best rated?
PEG is better rated than PPL based on the provided data, holding a higher overall rating (B- vs. C+) and superior scores in return on equity and assets, while both share similar discounted cash flow and debt to equity scores.
Scores Comparison
This section compares the Altman Z-Score and Piotroski Score of both companies:
PEG Scores
- Altman Z-Score: 1.32, indicating financial distress
- Piotroski Score: 7, reflecting strong financial health
PPL Scores
- Altman Z-Score: 0.97, indicating financial distress
- Piotroski Score: 6, reflecting average financial health
Which company has the best scores?
PEG has a higher Piotroski Score of 7 compared to PPL’s 6, indicating stronger financial health. Both companies are in the Altman Z-Score distress zone, but PEG’s score is slightly higher than PPL’s.
Grades Comparison
Here is a comparison of the recent grades assigned to Public Service Enterprise Group Incorporated and PPL Corporation:
Public Service Enterprise Group Incorporated Grades
This table summarizes the latest official grades from recognized financial institutions for PEG:
| Grading Company | Action | New Grade | Date |
|---|---|---|---|
| Ladenburg Thalmann | Buy | Buy | 2026-01-07 |
| UBS | Maintain | Buy | 2025-12-17 |
| JP Morgan | Maintain | Overweight | 2025-12-12 |
| Jefferies | Upgrade | Buy | 2025-11-06 |
| TD Cowen | Maintain | Buy | 2025-11-05 |
| BMO Capital | Maintain | Market Perform | 2025-11-04 |
| Barclays | Maintain | Equal Weight | 2025-10-21 |
| BMO Capital | Maintain | Market Perform | 2025-10-20 |
| Morgan Stanley | Maintain | Overweight | 2025-09-25 |
| BMO Capital | Maintain | Market Perform | 2025-08-06 |
The overall trend for PEG shows predominantly buy and overweight ratings, with several institutions maintaining positive views and a recent upgrade by Ladenburg Thalmann.
PPL Corporation Grades
This table displays the most recent official grades awarded to PPL Corporation by reputable grading firms:
| Grading Company | Action | New Grade | Date |
|---|---|---|---|
| UBS | Maintain | Neutral | 2025-12-17 |
| Wells Fargo | Maintain | Overweight | 2025-12-12 |
| JP Morgan | Maintain | Overweight | 2025-12-11 |
| BMO Capital | Maintain | Outperform | 2025-10-21 |
| B of A Securities | Maintain | Buy | 2025-10-16 |
| Barclays | Maintain | Equal Weight | 2025-10-14 |
| UBS | Maintain | Neutral | 2025-10-10 |
| Morgan Stanley | Maintain | Overweight | 2025-09-25 |
| Barclays | Maintain | Equal Weight | 2025-07-01 |
| Morgan Stanley | Maintain | Overweight | 2025-06-18 |
PPL’s grades reveal a solid pattern of overweight and buy ratings, accompanied by neutral and equal weight assessments, indicating a generally favorable but more mixed outlook.
Which company has the best grades?
Both PEG and PPL maintain a consensus “Buy” rating, though PEG shows more recent upgrades and multiple buy ratings, while PPL presents a balance of overweight and neutral views. This suggests PEG may currently receive slightly stronger endorsement from analysts, potentially influencing investor confidence in favor of PEG’s momentum.
Strengths and Weaknesses
Below is a comparison of key strengths and weaknesses for Public Service Enterprise Group Incorporated (PEG) and PPL Corporation (PPL) based on the most recent data.
| Criterion | Public Service Enterprise Group Incorporated (PEG) | PPL Corporation (PPL) |
|---|---|---|
| Diversification | Moderate diversification with strong utility segments including gas distribution and electric transmission, revenue of ~$10.5B in 2024 | Primarily focused on regulated utilities in Kentucky, Pennsylvania, and Rhode Island, with ~8.5B revenue in 2024, less diversified geographically |
| Profitability | Net margin at 17.22% (favorable); ROIC 4.4% (unfavorable) but growing; slightly unfavorable overall moat due to value destruction | Net margin at 10.49% (favorable); ROIC 3.59% (unfavorable) but improving; slightly unfavorable moat with value destruction |
| Innovation | Limited indicators of high innovation focus; utility sector constraints | Similar limited innovation focus typical of regulated utility companies |
| Global presence | Mainly US-focused, with no significant international exposure | Reduced international footprint after UK exit; focused on US regional markets |
| Market Share | Strong regional market share in New Jersey with integrated electric and gas operations | Leading presence in regulated markets of Kentucky and Pennsylvania, but smaller scale than PEG |
Key takeaways: Both PEG and PPL show improving profitability trends despite currently shedding value relative to capital costs. PEG benefits from greater diversification and scale, while PPL is more regionally concentrated with a less favorable financial ratio profile. Investors should weigh improving ROIC trends against current value destruction risks and sector-specific regulatory challenges.
Risk Analysis
Below is a comparison of key risk factors for Public Service Enterprise Group Incorporated (PEG) and PPL Corporation (PPL) based on the most recent data from 2024-2026.
| Metric | Public Service Enterprise Group Incorporated (PEG) | PPL Corporation (PPL) |
|---|---|---|
| Market Risk | Beta 0.61, relatively low volatility but market fluctuations can impact valuation | Beta 0.72, moderate volatility with some exposure to market swings |
| Debt level | Debt-to-Equity 1.42 (unfavorable), Debt-to-Assets 41.9% (neutral), interest coverage moderate (3.17) | Debt-to-Equity 1.19 (unfavorable), Debt-to-Assets 40.9% (neutral), interest coverage weaker (2.51) |
| Regulatory Risk | Operating in regulated electric & gas markets in US Northeast and Mid-Atlantic; subject to regulatory changes | US and UK utility operations subject to differing regulatory regimes, increasing complexity |
| Operational Risk | Large infrastructure with 25,000 circuit miles electric system and extensive gas mains; risks from outages and maintenance | Diverse operations across Kentucky, Pennsylvania, and UK; operational complexity and aging assets pose risks |
| Environmental Risk | Active investments in solar generation and energy efficiency programs; transition risks from fossil fuels | Generates electricity from coal, gas, hydro, solar; carbon regulation and transition risks present |
| Geopolitical Risk | Primarily US-focused, minimal direct geopolitical exposure | Exposure to UK market adds currency and geopolitical uncertainty |
Synthesis: Both PEG and PPL face significant debt-related risks with leverage levels considered unfavorable, which could constrain financial flexibility. PEG benefits from a lower beta, indicating less market volatility. Regulatory and environmental risks are key due to the utilities’ transition to cleaner energy, with PPL facing added geopolitical risk from UK exposure. PEG’s stronger operational scale and investments in renewables mitigate some risks. Investors should watch debt management and regulatory developments closely.
Which Stock to Choose?
Public Service Enterprise Group Incorporated (PEG) shows a declining income trend with unfavorable overall income growth and a slightly unfavorable global ratios evaluation, marked by moderate profitability, high debt levels, and a very favorable B- rating. Its MOAT status is slightly unfavorable as the company is shedding value despite a growing ROIC.
PPL Corporation (PPL) demonstrates a more favorable income statement with positive recent income growth but unfavorable long-term net income trends. The financial ratios present a generally unfavorable picture with moderate profitability and debt concerns, though the company holds a very favorable C+ rating. Its MOAT is also slightly unfavorable, reflecting value destruction but improving profitability.
Considering ratings and overall financial assessments, PEG’s moderate rating and stable profitability might appeal to investors seeking moderate risk and quality focus, whereas PPL’s favorable income trends and average financial strength could attract those with tolerance for variability and interest in growth potential. The choice might depend on whether the investor prioritizes stability and quality or is willing to accept some financial risk for potential income improvements.
Disclaimer: Investment carries a risk of loss of initial capital. The past performance is not a reliable indicator of future results. Be sure to understand risks before making an investment decision.
Go Further
I encourage you to read the complete analyses of Public Service Enterprise Group Incorporated and PPL Corporation to enhance your investment decisions: