In the evolving utilities sector, PPL Corporation and Pinnacle West Capital Corporation stand out as key players delivering regulated electric services. Both companies operate in the US market, focusing on electricity generation and distribution with a mix of traditional and renewable energy sources. Their innovation strategies and regional footprints invite a direct comparison. Join me as we analyze which company presents the most compelling investment opportunity for your portfolio.

Table of contents
Companies Overview
I will begin the comparison between PPL and Pinnacle West by providing an overview of these two companies and their main differences.
PPL Overview
PPL Corporation is a utility holding company delivering electricity and natural gas in the US and UK. It operates mainly in Kentucky, Pennsylvania, and southwestern Virginia, serving over 2.6M customers. The company generates electricity from coal, gas, hydro, and solar sources. Founded in 1920 and headquartered in Allentown, PA, PPL maintains a significant presence in regulated electric utilities with a market cap of approximately 25.6B USD.
Pinnacle West Overview
Pinnacle West Capital Corporation operates through its subsidiary Arizona Public Service Company, providing retail and wholesale electric services primarily in Arizona. It manages extensive transmission and distribution infrastructure and owns around 6,323 MW of regulated generation capacity using coal, nuclear, gas, oil, and solar sources. Incorporated in 1985 and based in Phoenix, AZ, Pinnacle West serves about 1.3M customers with a market cap near 10.7B USD.
Key similarities and differences
Both companies are in the regulated electric utility sector, focusing on electricity generation, transmission, and distribution with renewable and traditional energy sources. PPL operates in multiple states and the UK, serving a larger customer base than Pinnacle West, which is concentrated in Arizona. Pinnacle West has a higher market price per share and slightly fewer employees, reflecting differences in scale and geographic focus.
Income Statement Comparison
This table presents a side-by-side comparison of the key income statement metrics for PPL Corporation and Pinnacle West Capital Corporation for the fiscal year 2024.
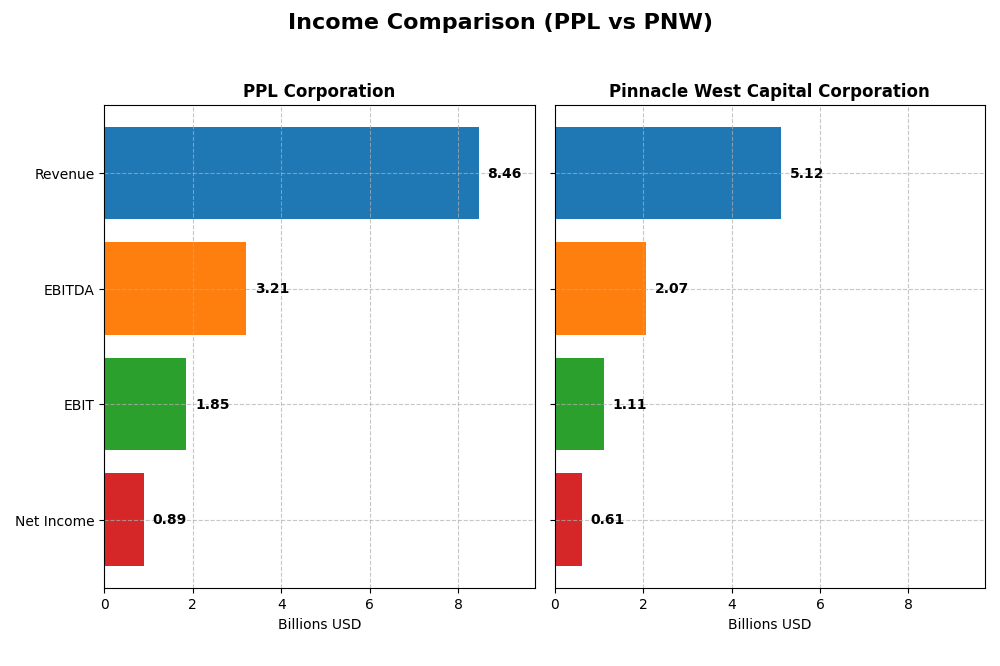
| Metric | PPL Corporation | Pinnacle West Capital Corporation |
|---|---|---|
| Market Cap | 25.6B | 10.7B |
| Revenue | 8.46B | 5.12B |
| EBITDA | 3.21B | 2.07B |
| EBIT | 1.85B | 1.11B |
| Net Income | 886M | 609M |
| EPS | 1.20 | 5.35 |
| Fiscal Year | 2024 | 2024 |
Income Statement Interpretations
PPL Corporation
PPL Corporation’s revenue showed a steady increase over 2020-2024, reaching $8.46B in 2024, up 54.6% overall. However, net income declined by 39.6% in the same period, with a net margin decrease of 60.9%. The latest year saw revenue growth slow to 1.8%, but EBIT and net margin improved significantly, indicating better operational efficiency despite stable interest expenses.
Pinnacle West Capital Corporation
Pinnacle West Capital delivered consistent revenue growth, reaching $5.12B in 2024, up 42.9% over five years, with net income rising 10.6%. Margins remained favorable, with a slight net margin contraction of 22.6% over the period. In 2024, revenue grew 9.1%, accompanied by strong EBIT and EPS growth, although operational expenses grew at the same pace as revenue, tempering margin expansion.
Which one has the stronger fundamentals?
Pinnacle West exhibits stronger fundamentals with more balanced growth in revenue and net income, supported by favorable gross and EBIT margins and robust EPS growth. PPL shows higher revenue growth but faces challenges with declining net income and margins over the period. Both maintain favorable overall income statements, yet Pinnacle West’s consistent profitability metrics indicate a more stable income profile.
Financial Ratios Comparison
The table below presents a side-by-side comparison of key financial ratios for PPL Corporation and Pinnacle West Capital Corporation, based on their most recent fiscal year 2024 data.
| Ratios | PPL Corporation | Pinnacle West Capital Corporation |
|---|---|---|
| ROE | 6.3% | 9.0% |
| ROIC | 3.6% | 3.5% |
| P/E | 27.0 | 15.9 |
| P/B | 1.70 | 1.43 |
| Current Ratio | 0.86 | 0.59 |
| Quick Ratio | 0.71 | 0.42 |
| D/E (Debt-to-Equity) | 1.19 | 1.64 |
| Debt-to-Assets | 41% | 42% |
| Interest Coverage | 2.36 | 2.68 |
| Asset Turnover | 0.21 | 0.20 |
| Fixed Asset Turnover | 0.26 | 0.25 |
| Payout Ratio | 84.1% | 64.8% |
| Dividend Yield | 3.12% | 4.09% |
Interpretation of the Ratios
PPL Corporation
PPL Corporation shows a mixed ratio profile with a favorable net margin of 10.49% and dividend yield at 3.12%, but weak returns on equity (6.31%) and invested capital (3.59%) raise concerns. The company’s liquidity ratios (current ratio 0.86, quick ratio 0.71) are below ideal levels, and leverage is high with a debt-to-equity of 1.19. PPL pays dividends, supported by a moderate payout, though coverage by free cash flow is negative, indicating potential distribution risks.
Pinnacle West Capital Corporation
Pinnacle West Capital Corporation displays a stronger net margin at 11.88% and a higher dividend yield of 4.09%, yet its return on equity (9.01%) and return on invested capital (3.48%) are also weak. Liquidity remains a concern with a current ratio of 0.59 and quick ratio of 0.42, while debt-to-equity is higher at 1.64. The company maintains dividend payments, but a negative free cash flow yield suggests possible sustainability challenges for distributions.
Which one has the best ratios?
Between the two, Pinnacle West Capital has relatively better profitability margins and dividend yield, although it struggles with liquidity and leverage similar to PPL. PPL’s ratios feature more unfavorable signals, particularly in returns and liquidity, despite a slightly better debt structure. Overall, both companies exhibit financial challenges, but Pinnacle West’s ratios are marginally more favorable.
Strategic Positioning
This section compares the strategic positioning of PPL Corporation and Pinnacle West Capital Corporation, including market position, key segments, and exposure to technological disruption:
PPL Corporation
- Operates in multiple US states and the UK, facing moderate competitive pressure in regulated electric markets.
- Revenue driven by Kentucky, Pennsylvania, and Rhode Island regulated segments, plus UK operations.
- Generates electricity from coal, gas, hydro, and solar, indicating some diversification amid potential energy transition.
Pinnacle West Capital Corporation
- Focuses primarily on Arizona’s regulated electric market with lower competitive pressure.
- Revenue mainly from electric service, transmission, and wholesale energy within Arizona.
- Relies on coal, nuclear, gas, oil, and solar generation, facing risks from evolving energy technologies.
PPL Corporation vs Pinnacle West Capital Corporation Positioning
PPL has a geographically diversified portfolio across multiple states and the UK, balancing various regulated segments. Pinnacle West is more geographically concentrated in Arizona, focusing on core electric and transmission services. Diversification may reduce regional risk but complicates operational focus.
Which has the best competitive advantage?
Both companies are currently shedding value, but PPL shows a growing ROIC trend, indicating improving profitability, while Pinnacle West’s declining ROIC trend suggests worsening value destruction and weaker competitive advantage.
Stock Comparison
The past year showed strong bullish trends for both PPL Corporation and Pinnacle West Capital Corporation, with notable price appreciations but recent decelerations and slight declines in the last quarter.

Trend Analysis
PPL Corporation experienced a 29.84% price increase over the past 12 months, indicating a bullish trend with decelerating momentum. The stock ranged from a low of 26.14 to a high of 37.44, with recent mild downward movement.
Pinnacle West Capital Corporation posted a 31.14% gain over the same period, also bullish with deceleration. Volatility was higher, reflected in a wider price range of 67.92 to 94.45, but recent weeks showed a slight negative slope.
Comparing both, Pinnacle West Capital delivered the highest market performance with a 31.14% gain, slightly outperforming PPL’s 29.84% over the past year.
Target Prices
The consensus target prices from recognized analysts suggest upside potential for both PPL Corporation and Pinnacle West Capital Corporation.
| Company | Target High | Target Low | Consensus |
|---|---|---|---|
| PPL Corporation | 45 | 36 | 41.29 |
| Pinnacle West Capital Corporation | 115 | 85 | 96.33 |
Analysts expect PPL’s shares to rise above the current price of 34.59 USD, indicating moderate appreciation potential. Pinnacle West’s consensus target also exceeds the current price of 89.07 USD, signaling positive outlooks from the market experts.
Analyst Opinions Comparison
This section compares analysts’ ratings and grades for PPL Corporation and Pinnacle West Capital Corporation:
Rating Comparison
PPL Rating
- Rating: C+, considered very favorable by analysts.
- Discounted Cash Flow Score: 1, indicating a very unfavorable valuation view.
- ROE Score: 3, reflecting moderate efficiency in generating profit from equity.
- ROA Score: 3, indicating moderate asset utilization effectiveness.
- Debt To Equity Score: 2, moderate financial risk level.
- Overall Score: 2, a moderate overall financial standing assessment.
PNW Rating
- Rating: C+, also rated very favorable by analysts.
- Discounted Cash Flow Score: 1, also very unfavorable for valuation.
- ROE Score: 3, showing moderate efficiency similar to PPL.
- ROA Score: 3, equally moderate in asset utilization.
- Debt To Equity Score: 1, indicating higher financial risk compared to PPL.
- Overall Score: 2, equally moderate in overall financial assessment.
Which one is the best rated?
Both PPL and PNW share the same overall rating of C+ and moderate overall scores. However, PPL has a better debt-to-equity score, indicating a relatively stronger balance sheet risk profile compared to PNW, which has a very unfavorable debt-to-equity rating.
Scores Comparison
Here is a comparison of the Altman Z-Score and Piotroski Score for PPL Corporation and Pinnacle West Capital Corporation:
PPL Scores
- Altman Z-Score of 0.97 indicates financial distress risk.
- Piotroski Score of 6 reflects an average financial strength.
PNW Scores
- Altman Z-Score of 0.73 indicates financial distress risk.
- Piotroski Score of 4 reflects an average financial strength.
Which company has the best scores?
Based on the provided data, PPL has a higher Altman Z-Score and Piotroski Score than PNW, indicating relatively better financial stability and strength. Both remain in financial distress with average Piotroski ratings.
Grades Comparison
Here is a comparison of the recent grades and ratings for PPL Corporation and Pinnacle West Capital Corporation:
PPL Corporation Grades
This table summarizes recent grades issued by recognized financial institutions for PPL Corporation.
| Grading Company | Action | New Grade | Date |
|---|---|---|---|
| UBS | Maintain | Neutral | 2025-12-17 |
| Wells Fargo | Maintain | Overweight | 2025-12-12 |
| JP Morgan | Maintain | Overweight | 2025-12-11 |
| BMO Capital | Maintain | Outperform | 2025-10-21 |
| B of A Securities | Maintain | Buy | 2025-10-16 |
| Barclays | Maintain | Equal Weight | 2025-10-14 |
| UBS | Maintain | Neutral | 2025-10-10 |
| Morgan Stanley | Maintain | Overweight | 2025-09-25 |
| Barclays | Maintain | Equal Weight | 2025-07-01 |
| Morgan Stanley | Maintain | Overweight | 2025-06-18 |
The overall consensus for PPL Corporation remains positive, with a majority of buy and overweight ratings and no sell recommendations.
Pinnacle West Capital Corporation Grades
This table presents recent grades from established grading companies for Pinnacle West Capital Corporation.
| Grading Company | Action | New Grade | Date |
|---|---|---|---|
| UBS | Maintain | Neutral | 2025-12-17 |
| Keybanc | Downgrade | Sector Weight | 2025-12-12 |
| Keybanc | Maintain | Overweight | 2025-10-15 |
| UBS | Maintain | Neutral | 2025-10-10 |
| Barclays | Maintain | Equal Weight | 2025-10-07 |
| Argus Research | Maintain | Buy | 2025-09-30 |
| Morgan Stanley | Maintain | Equal Weight | 2025-09-25 |
| UBS | Maintain | Neutral | 2025-09-12 |
| Mizuho | Downgrade | Neutral | 2025-09-09 |
| Barclays | Maintain | Equal Weight | 2025-08-13 |
Pinnacle West Capital Corporation’s grades show a more mixed trend, with a number of hold and neutral ratings and some recent downgrades, including a sector weight from Keybanc.
Which company has the best grades?
PPL Corporation has received predominantly buy and overweight grades, indicating stronger analyst confidence compared to Pinnacle West Capital Corporation, which shows more hold and neutral ratings with some downgrades. This difference may affect investor sentiment and portfolio positioning based on growth expectations and risk tolerance.
Strengths and Weaknesses
Below is a comparison table summarizing the key strengths and weaknesses of PPL Corporation and Pinnacle West Capital Corporation based on recent financial and operational data.
| Criterion | PPL Corporation | Pinnacle West Capital Corporation |
|---|---|---|
| Diversification | Moderate, focused on regulated utilities across several states including Kentucky, Pennsylvania, Rhode Island | Concentrated mainly in electric service and transmission in the U.S. Southwest region |
| Profitability | Net margin 10.49% (favorable), but ROIC 3.59% below WACC, indicating slight value destruction | Net margin 11.88% (favorable), ROIC 3.48% below WACC, showing value destruction with declining profitability |
| Innovation | Limited data; moderate focus on regulated segments with stable growth in ROIC trend (+19%) | Limited innovation indicated; declining ROIC (-5%) suggests challenges in growth and efficiency |
| Global presence | Presence in U.S. states and historically in the UK, though recent focus is domestic | Primarily regional U.S. presence, no significant international operations |
| Market Share | Significant share in regulated utilities in key states; revenue over $8B in 2024 | Strong regional utility player with revenues around $2.7B in 2024 |
Key takeaways: PPL Corporation shows improving profitability trends but still slightly destroys value overall, with moderate diversification in regulated markets. Pinnacle West faces more pronounced profitability challenges and declining efficiency, with a concentrated regional focus. Both companies require cautious evaluation due to value destruction signals despite stable revenues.
Risk Analysis
Below is a summary table highlighting key risks for PPL Corporation and Pinnacle West Capital Corporation as of 2024:
| Metric | PPL Corporation | Pinnacle West Capital Corporation |
|---|---|---|
| Market Risk | Moderate (Beta 0.72) | Lower (Beta 0.54) |
| Debt level | High (Debt/Equity 1.19) | Higher (Debt/Equity 1.64) |
| Regulatory Risk | Moderate (Utility Sector) | Moderate (Utility Sector) |
| Operational Risk | Moderate (Diverse sources) | Moderate (Broad generation mix) |
| Environmental Risk | Medium (Coal & Gas use) | Medium (Coal, Nuclear, Gas use) |
| Geopolitical Risk | Low (US & UK operations) | Low (US-focused, Arizona) |
The most impactful risks are the high debt levels and operational exposure to fossil fuels for both companies. Additionally, their Altman Z-scores place them in the distress zone, signaling elevated financial distress risk despite stable dividend yields. Regulatory and environmental factors remain relevant given the transition pressures in the utility sector.
Which Stock to Choose?
PPL Corporation shows a mixed financial profile with favorable income statement metrics including a 10.49% net margin and positive EBIT margin growth, but it struggles with several unfavorable financial ratios such as a low current ratio (0.86) and high net debt to EBITDA (5.14). Its overall rating is moderate (C+), though its Altman Z-Score indicates distress, and its MOAT evaluation suggests value destruction despite improving ROIC.
Pinnacle West Capital Corporation exhibits generally favorable income growth, with a 11.88% net margin and strong revenue growth of 9.13% in the past year. Financial ratios reveal a slightly better profile with a lower price-to-book ratio (1.43) and a higher dividend yield (4.09%), though it also faces challenges like a weak current ratio (0.59) and high debt-to-equity. Its rating matches PPL’s moderate C+ but with a more unfavorable debt-to-equity score and a very unfavorable MOAT due to declining profitability.
Investors focused on growth and income stability might find Pinnacle West’s stronger recent income growth and dividend yield appealing, while those attentive to improving profitability trends and a less negative ROIC trajectory might see PPL as a company with potential upside despite current weaknesses. The choice could depend on the investor’s risk tolerance and preference for either growth momentum or improving operational metrics.
Disclaimer: Investment carries a risk of loss of initial capital. The past performance is not a reliable indicator of future results. Be sure to understand risks before making an investment decision.
Go Further
I encourage you to read the complete analyses of PPL Corporation and Pinnacle West Capital Corporation to enhance your investment decisions: