Pacific Gas & Electric Co. (PCG) and PPL Corporation (PPL) are two prominent players in the regulated electric utilities sector, serving millions of customers across key U.S. regions. Both companies focus on delivering electricity and natural gas while integrating innovative energy solutions to meet evolving demands. This analysis will compare their market positions, innovation strategies, and growth potential to help you decide which utility stock could be the stronger addition to your portfolio.

Table of contents
Companies Overview
I will begin the comparison between Pacific Gas & Electric Co. and PPL Corporation by providing an overview of these two companies and their main differences.
Pacific Gas & Electric Co. Overview
Pacific Gas & Electric Co. operates as a regulated electric utility primarily serving northern and central California. The company generates, transmits, distributes, and sells electricity and natural gas from diverse sources including nuclear, hydroelectric, fossil fuels, and photovoltaics. Founded in 1905 and headquartered in San Francisco, it serves residential, commercial, industrial, and agricultural customers, emphasizing integrated smart grid technologies.
PPL Corporation Overview
PPL Corporation is a utility holding company providing electricity and natural gas in the United States and the United Kingdom. Its operations are segmented into Kentucky Regulated and Pennsylvania Regulated markets, serving over 2.7M customers. Founded in 1920 and based in Allentown, Pennsylvania, PPL generates electricity using coal, gas, hydro, and solar sources, and also sells wholesale electricity to municipalities in Kentucky.
Key similarities and differences
Both companies operate in the regulated electric utility sector and provide electricity and natural gas services. Pacific Gas & Electric focuses on California, while PPL serves regions in Kentucky, Pennsylvania, Virginia, and the UK. PG&E has a broader energy mix with nuclear and photovoltaic sources, whereas PPL emphasizes coal, gas, hydro, and solar. PG&E has a larger workforce and market cap, reflecting its larger geographic footprint and customer base.
Income Statement Comparison
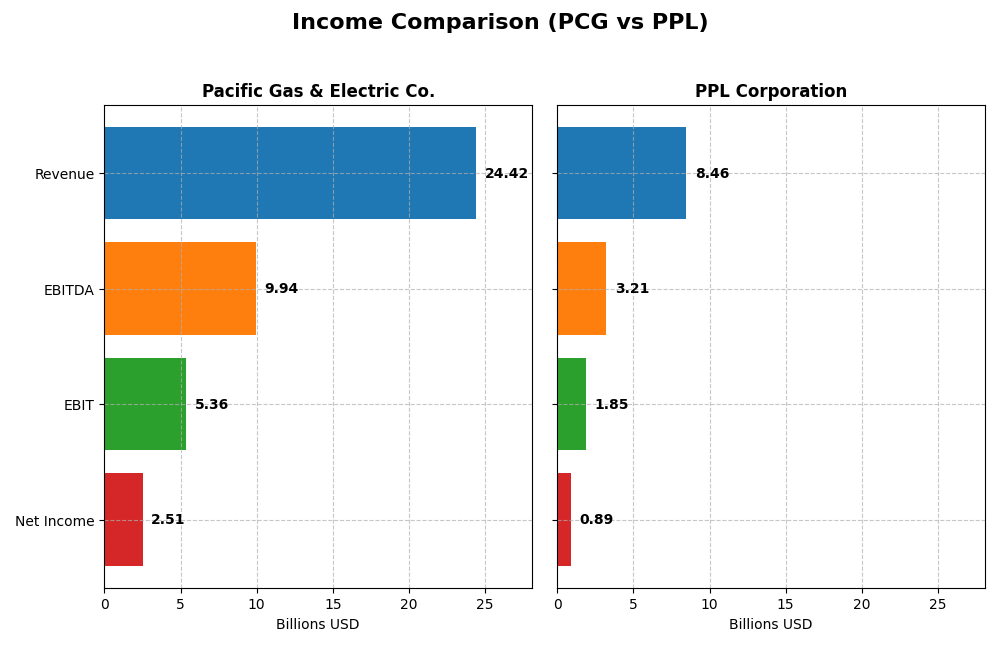
Below is the latest income statement comparison for Pacific Gas & Electric Co. and PPL Corporation, highlighting key financial metrics for the fiscal year 2024.
| Metric | Pacific Gas & Electric Co. (PCG) | PPL Corporation (PPL) |
|---|---|---|
| Market Cap | 34.8B | 25.6B |
| Revenue | 24.4B | 8.5B |
| EBITDA | 9.9B | 3.2B |
| EBIT | 5.4B | 1.9B |
| Net Income | 2.5B | 888M |
| EPS | 1.16 | 1.20 |
| Fiscal Year | 2024 | 2024 |
Income Statement Interpretations
Pacific Gas & Electric Co.
Pacific Gas & Electric Co. showed a favorable revenue growth of 32.22% from 2020 to 2024, with net income increasing substantially by 292.64%. Margins improved significantly, with a net margin of 10.29% and an EBIT margin of 21.96% in 2024. Although revenue slightly declined by 0.04% in the latest year, gross profit and net income margins improved, reflecting stronger operational efficiency.
PPL Corporation
PPL Corporation experienced a 54.59% revenue growth over the 2020-2024 period but suffered a 39.55% decline in net income. The 2024 gross margin stood at 40.1%, and the EBIT margin was 21.91%, both favorable. In the most recent year, revenue grew modestly by 1.8%, supported by improved EBIT and net margin growth, though net income and EPS have declined overall during the period.
Which one has the stronger fundamentals?
Pacific Gas & Electric Co. exhibits stronger fundamentals with consistent revenue and net income growth, alongside improving margins and EPS over the period. PPL shows solid revenue growth but weakening net income and margin trends. Despite both having favorable income statement evaluations, Pacific Gas & Electric’s higher proportion of favorable indicators and margin improvement suggest a more robust financial standing.
Financial Ratios Comparison
Below is a comparison of key financial ratios for Pacific Gas & Electric Co. (PCG) and PPL Corporation (PPL) based on their most recent fiscal year data ending December 31, 2024.
| Ratios | Pacific Gas & Electric Co. (PCG) | PPL Corporation (PPL) |
|---|---|---|
| ROE | 8.33% | 6.31% |
| ROIC | 3.98% | 3.59% |
| P/E | 17.20 | 26.97 |
| P/B | 1.43 | 1.70 |
| Current Ratio | 1.05 | 0.86 |
| Quick Ratio | 1.00 | 0.71 |
| D/E | 1.94 | 1.19 |
| Debt-to-Assets | 43.7% | 40.9% |
| Interest Coverage | 1.46 | 2.36 |
| Asset Turnover | 0.18 | 0.21 |
| Fixed Asset Turnover | 0.28 | 0.26 |
| Payout ratio | 3.42% | 84.1% |
| Dividend yield | 0.20% | 3.12% |
Interpretation of the Ratios
Pacific Gas & Electric Co.
Pacific Gas & Electric displays a mixed financial profile with favorable net margin (10.29%) and WACC (4.68%), but weak returns on equity (8.33%) and invested capital (3.98%). Its leverage ratios and interest coverage indicate some financial stress, while liquidity is moderate. The company pays a low dividend yield of 0.2%, reflecting cautious shareholder returns amid financial challenges.
PPL Corporation
PPL shows a slightly better net margin (10.49%) but suffers from low return on equity (6.31%) and invested capital (3.59%). Its valuation is high with a P/E of 26.97, considered unfavorable, and liquidity ratios are weak. PPL offers a significantly higher dividend yield of 3.12%, indicating a stronger focus on shareholder returns despite some operational weaknesses.
Which one has the best ratios?
Between the two, Pacific Gas & Electric has a slightly more balanced ratio profile with some favorable liquidity and valuation metrics, despite weak returns and coverage ratios. PPL has a higher dividend yield but overall weaker liquidity and more unfavorable valuation. Both companies face challenges, with Pacific Gas & Electric’s ratios being marginally less unfavorable.
Strategic Positioning
This section compares the strategic positioning of Pacific Gas & Electric Co. (PCG) and PPL Corporation (PPL) across Market position, Key segments, and Exposure to technological disruption:
Pacific Gas & Electric Co. (PCG)
- Large market cap (34.8B), low beta (0.38), faces regulated electric competition in California.
- Revenue driven by electricity (18.6B) and US regulated natural gas (6.6B) segments.
- Develops innovative personal microgrid backup power devices integrated with SmartMeter systems.
PPL Corporation (PPL)
- Smaller market cap (25.6B), moderate beta (0.72), operates in US and UK regulated electric markets.
- Revenue segmented mainly across Kentucky, Pennsylvania, and Rhode Island regulated electric markets.
- No explicit mention of technological disruption initiatives or innovations.
PCG vs PPL Positioning
PCG follows a diversified approach with electricity and natural gas in a large California market plus innovation in smart grid technology, offering broader business drivers. PPL has a more concentrated regional focus in the US and UK regulated electric utilities, with less emphasis on technological innovation.
Which has the best competitive advantage?
Both PCG and PPL show slightly unfavorable MOAT evaluations, shedding value despite growing ROIC trends. Neither currently demonstrates a strong sustainable competitive advantage based on ROIC versus WACC metrics.
Stock Comparison
The stock price movements of Pacific Gas & Electric Co. and PPL Corporation over the past year reflect contrasting trends, with PCG showing a mild bearish trajectory and PPL experiencing a strong bullish trend despite recent short-term declines.

Trend Analysis
Pacific Gas & Electric Co. (PCG) exhibited a bearish trend with a -3.53% price change over the past year, characterized by deceleration and a volatility standard deviation of 1.93. The stock’s price peaked at 21.63 and bottomed at 13.42.
PPL Corporation (PPL) showed a bullish trend with a 29.84% increase over the past year, though its upward momentum decelerated. Volatility was higher at a 3.24 standard deviation, with prices ranging from 26.14 to 37.44.
Comparing the two, PPL delivered the highest market performance with a significantly positive price change, while PCG trended downward, reflecting divergent investor sentiment and price dynamics.
Target Prices
Analysts present a positive target price consensus for Pacific Gas & Electric Co. and PPL Corporation.
| Company | Target High | Target Low | Consensus |
|---|---|---|---|
| Pacific Gas & Electric Co. | 25 | 18 | 21.5 |
| PPL Corporation | 45 | 36 | 41.29 |
The target consensus for PCG at 21.5 USD suggests upside potential from the current price of 15.85 USD. Similarly, PPL’s consensus target of 41.29 USD indicates expected growth above its current 34.59 USD market price.
Analyst Opinions Comparison
This section compares analysts’ ratings and financial scores for Pacific Gas & Electric Co. (PCG) and PPL Corporation (PPL):
Rating Comparison
PCG Rating
- Rating: B-, considered very favorable overall.
- Discounted Cash Flow Score: 1, rated very unfavorable, indicating potential valuation concerns.
- ROE Score: 3, moderate efficiency in generating profit from equity.
- ROA Score: 3, moderate asset utilization to generate earnings.
- Debt To Equity Score: 1, very unfavorable, indicating high financial risk.
- Overall Score: 3, moderate financial standing.
PPL Rating
- Rating: C+, considered very favorable overall.
- Discounted Cash Flow Score: 1, rated very unfavorable, indicating potential valuation concerns.
- ROE Score: 3, moderate efficiency in generating profit from equity.
- ROA Score: 3, moderate asset utilization to generate earnings.
- Debt To Equity Score: 2, moderate financial risk, less leverage than PCG.
- Overall Score: 2, moderate financial standing but lower than PCG.
Which one is the best rated?
Based strictly on the provided data, PCG holds a higher overall rating (B-) and score (3) compared to PPL’s C+ and score of 2. PCG’s debt risk is higher, but it outperforms PPL in overall rating and financial scores.
Scores Comparison
Here is a comparison of the Altman Z-Score and Piotroski Score for both companies:
PCG Scores
- Altman Z-Score of 0.48 places PCG in distress zone, indicating high bankruptcy risk.
- Piotroski Score of 5 indicates average financial strength and investment potential.
PPL Scores
- Altman Z-Score of 0.97 places PPL in distress zone, indicating high bankruptcy risk.
- Piotroski Score of 6 indicates average financial strength and investment potential.
Which company has the best scores?
Based on the provided scores, PPL has a higher Altman Z-Score and Piotroski Score than PCG, suggesting relatively better financial stability and strength, though both remain in the distress zone with average Piotroski ratings.
Grades Comparison
Here is the comparison of recent grades and ratings from reputable grading companies for Pacific Gas & Electric Co. and PPL Corporation:
Pacific Gas & Electric Co. Grades
The table below shows the latest grades and actions from well-known financial institutions for Pacific Gas & Electric Co.:
| Grading Company | Action | New Grade | Date |
|---|---|---|---|
| JP Morgan | Maintain | Overweight | 2025-12-12 |
| UBS | Maintain | Neutral | 2025-10-24 |
| Jefferies | Maintain | Buy | 2025-10-22 |
| BMO Capital | Maintain | Outperform | 2025-10-14 |
| Jefferies | Maintain | Buy | 2025-10-03 |
| Barclays | Maintain | Overweight | 2025-10-01 |
| Morgan Stanley | Maintain | Equal Weight | 2025-09-25 |
| Morgan Stanley | Upgrade | Equal Weight | 2025-09-18 |
| UBS | Maintain | Neutral | 2025-09-18 |
| Barclays | Maintain | Overweight | 2025-07-22 |
Pacific Gas & Electric Co.’s grades show a stable to positive trend with multiple Overweight and Buy ratings maintained by top firms.
PPL Corporation Grades
Below is the summary of recent grades and actions from recognized grading companies for PPL Corporation:
| Grading Company | Action | New Grade | Date |
|---|---|---|---|
| UBS | Maintain | Neutral | 2025-12-17 |
| Wells Fargo | Maintain | Overweight | 2025-12-12 |
| JP Morgan | Maintain | Overweight | 2025-12-11 |
| BMO Capital | Maintain | Outperform | 2025-10-21 |
| B of A Securities | Maintain | Buy | 2025-10-16 |
| Barclays | Maintain | Equal Weight | 2025-10-14 |
| UBS | Maintain | Neutral | 2025-10-10 |
| Morgan Stanley | Maintain | Overweight | 2025-09-25 |
| Barclays | Maintain | Equal Weight | 2025-07-01 |
| Morgan Stanley | Maintain | Overweight | 2025-06-18 |
PPL Corporation’s grades consistently reflect positive sentiment with several Overweight and Buy ratings from leading institutions.
Which company has the best grades?
Both Pacific Gas & Electric Co. and PPL Corporation exhibit strong buy-side sentiment, but PPL has a slightly higher number of Overweight and Buy ratings across multiple firms. This could suggest a marginally stronger market confidence in PPL, potentially impacting investor perception positively in terms of expected performance.
Strengths and Weaknesses
Below is a comparison of key strengths and weaknesses for Pacific Gas & Electric Co. (PCG) and PPL Corporation (PPL) based on their latest financial and operational data.
| Criterion | Pacific Gas & Electric Co. (PCG) | PPL Corporation (PPL) |
|---|---|---|
| Diversification | Moderate: Primarily electricity and natural gas in US regulated markets | Moderate: Focused on regional regulated markets (Kentucky, Pennsylvania, Rhode Island) |
| Profitability | Moderate net margin (10.29%) but ROIC below WACC indicates value destruction | Similar net margin (10.49%) but lower ROIC than WACC, also value destroying |
| Innovation | Limited evidence of innovation; traditional utility with growing ROIC | Also traditional utility; growing ROIC but still below cost of capital |
| Global presence | US-focused with no significant international operations | Mainly US regions, previous UK exposure divested |
| Market Share | Strong presence in California electricity and gas markets | Strong regional presence in regulated US markets |
Key takeaways: Both PCG and PPL operate mainly in regulated US utility markets with moderate diversification. Neither company currently creates value as ROIC is below WACC, but both show improving profitability trends. Investors should monitor their ability to convert growing ROIC into sustainable value creation.
Risk Analysis
Below is a comparative table summarizing key risks for Pacific Gas & Electric Co. (PCG) and PPL Corporation (PPL) based on the most recent 2024 data:
| Metric | Pacific Gas & Electric Co. (PCG) | PPL Corporation (PPL) |
|---|---|---|
| Market Risk | Low beta (0.379) suggests lower volatility but exposure to regulated utility sector risks | Moderate beta (0.716), moderate sensitivity to market swings |
| Debt level | High debt-to-equity ratio (1.94) and weak interest coverage (1.76) indicate elevated financial leverage risk | Moderate debt-to-equity (1.19) with better interest coverage (2.51), moderate leverage risk |
| Regulatory Risk | High, due to California’s stringent regulations and wildfire liabilities | Moderate, regulated in multiple US states and UK, with some regulatory complexity |
| Operational Risk | Significant operational challenges tied to legacy infrastructure and wildfire prevention costs | Moderate operational risks with diversified generation assets in US and UK |
| Environmental Risk | High, given wildfire exposure and transition to clean energy mandates | Moderate, with coal and gas assets facing transition risks |
| Geopolitical Risk | Low, focused primarily on California market | Moderate, US-UK operations expose it to currency and policy risks |
Synthesis: PCG’s most impactful risks stem from high financial leverage, regulatory pressures, and environmental challenges linked to California wildfires. PPL faces moderate financial and regulatory risks but benefits from geographic diversification. Both companies’ Altman Z-Scores place them in distress zones, highlighting bankruptcy risk concerns. Caution is advised, especially with PCG’s elevated debt and operational liabilities.
Which Stock to Choose?
Pacific Gas & Electric Co. (PCG) shows a favorable income statement with strong growth in net income and margins over 2020-2024, but mixed financial ratios with a slightly unfavorable overall rating. Its debt levels are high, and the company is shedding value despite growing ROIC.
PPL Corporation (PPL) presents a favorable income statement, especially revenue growth, though net income and margin trends over the period are unfavorable. Financial ratios are mostly unfavorable, with moderate debt and a slightly unfavorable moat, reflecting value destruction despite improving profitability.
Investors seeking growth might find PCG’s improving income metrics and growing profitability more appealing, while those prioritizing yield and moderate risk could view PPL’s stable dividend yield and recent bullish price trend as favorable. Both companies exhibit value destruction signs, requiring careful risk assessment depending on investor profiles.
Disclaimer: Investment carries a risk of loss of initial capital. The past performance is not a reliable indicator of future results. Be sure to understand risks before making an investment decision.
Go Further
I encourage you to read the complete analyses of Pacific Gas & Electric Co. and PPL Corporation to enhance your investment decisions: