Home > Comparison > Basic Materials > SHW vs PPG
The strategic rivalry between The Sherwin-Williams Company and PPG Industries defines the current trajectory of the specialty chemicals sector. Sherwin-Williams operates a capital-intensive, vertically integrated model focused on architectural and industrial coatings. PPG, by contrast, emphasizes diversified specialty materials and performance coatings with global industrial applications. This analysis explores which company’s structural advantages and capital allocation strategies deliver superior risk-adjusted returns for a balanced portfolio.
Table of contents
Companies Overview
The Sherwin-Williams Company and PPG Industries, Inc. are pivotal players in the specialty chemicals sector, shaping global coatings markets.
The Sherwin-Williams Company: Industry-Leading Paint and Coatings Specialist
The Sherwin-Williams Company dominates the specialty coatings industry through its diversified revenue streams across three segments: Americas Group, Consumer Brands, and Performance Coatings. It generates revenue by selling paints, stains, and industrial coatings primarily to professional contractors and retail customers. In 2026, Sherwin-Williams focuses on expanding its direct-to-consumer footprint with approximately 5,000 company-operated stores worldwide.
PPG Industries, Inc.: Diverse Global Coatings and Specialty Materials Provider
PPG Industries operates as a global leader in specialty coatings and materials, earning revenue by supplying coatings, adhesives, and specialty chemicals to automotive, aerospace, industrial, and consumer markets. Its strategic emphasis in 2026 remains on innovation and serving complex industrial end-markets, including aerospace and packaging, leveraging its broad product portfolio and technical expertise.
Strategic Collision: Similarities & Divergences
Both companies compete fiercely in the specialty coatings market but diverge in approach: Sherwin-Williams emphasizes a retail-led, direct-sales model, while PPG targets industrial and high-technology sectors with customized solutions. Their battle for market share centers on innovation versus scale. Investors will find Sherwin-Williams offers stability through its expansive retail presence, whereas PPG presents growth potential via specialized industrial markets.
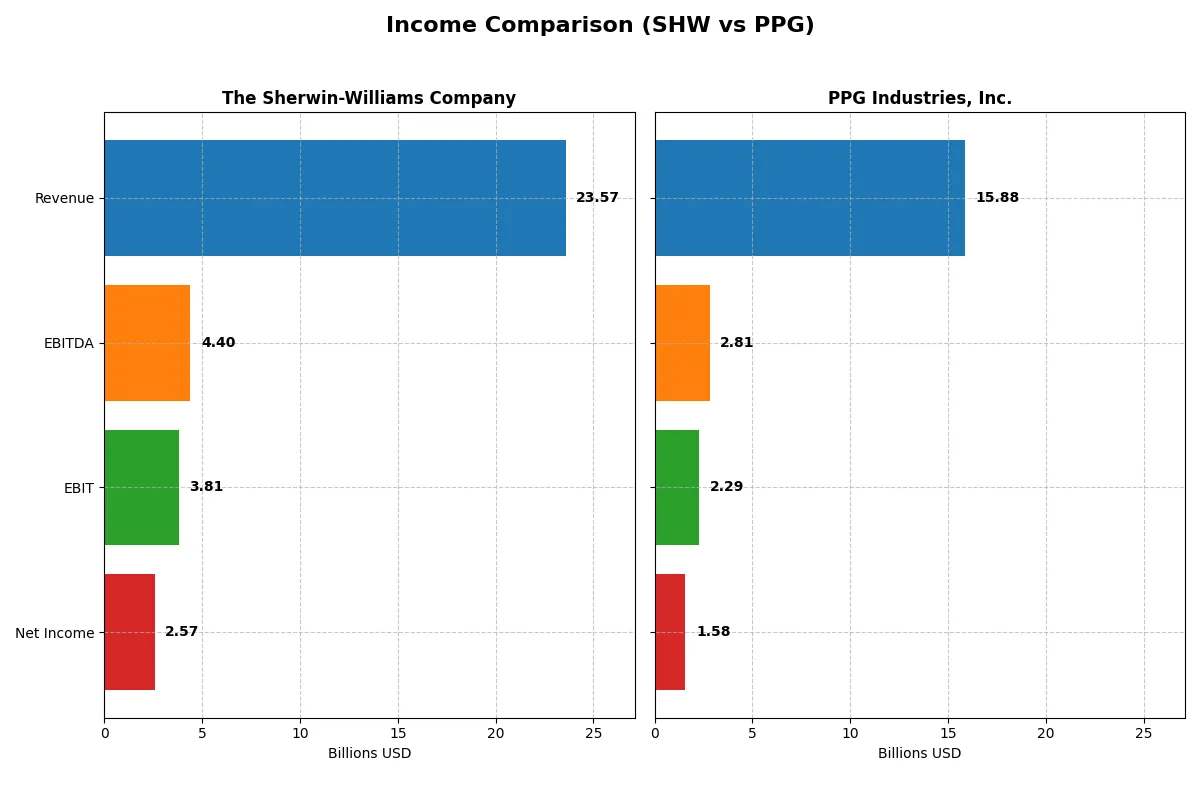
Income Statement Comparison
This data dissects the core profitability and scalability of both corporate engines to reveal who dominates the bottom line:
| Metric | The Sherwin-Williams Company (SHW) | PPG Industries, Inc. (PPG) |
|---|---|---|
| Revenue | 23.6B | 15.9B |
| Cost of Revenue | 12.0B | 9.8B |
| Operating Expenses | 7.7B | 3.9B |
| Gross Profit | 11.5B | 6.0B |
| EBITDA | 4.4B | 2.8B |
| EBIT | 3.8B | 2.3B |
| Interest Expense | 469M | 241M |
| Net Income | 2.6B | 1.6B |
| EPS | 10.38 | 6.96 |
| Fiscal Year | 2025 | 2025 |
Income Statement Analysis: The Bottom-Line Duel
This income statement comparison exposes which company runs the more efficient and profitable financial engine in the current market landscape.
The Sherwin-Williams Company Analysis
Sherwin-Williams steadily grew revenue by 18.2% over five years, reaching $23.6B in 2025, while net income rose 37.8% to $2.57B. Its gross margin remains robust at 48.9%, with a healthy net margin of 10.9%. However, recent momentum shows a slight revenue growth slowdown (2.1%) and a 6.1% net margin contraction, signaling margin pressure despite overall strength.
PPG Industries, Inc. Analysis
PPG’s revenue declined 5.5% over five years, settling at $15.9B in 2025, yet net income advanced 9.5% to $1.58B. The gross margin stands at 38.0%, lower than Sherwin-Williams, but PPG improved its net margin to 9.9%. PPG’s latest year shows modest revenue growth (0.2%) but strong EBIT and EPS gains (9.2% and 45.7%), highlighting improving operational efficiency and profitability.
Margin Power vs. Revenue Scale
Sherwin-Williams leads with superior scale, higher margins, and stronger absolute profits, but faces recent margin softness. PPG, while smaller with thinner margins, demonstrates solid operational momentum and margin expansion. Investors seeking scale and consistent profitability may favor Sherwin-Williams, whereas those prioritizing earnings growth and margin improvement might lean toward PPG’s profile.
Financial Ratios Comparison
These vital ratios act as a diagnostic tool to expose the underlying fiscal health, valuation premiums, and capital efficiency for each company:
| Ratios | The Sherwin-Williams Company (SHW) | PPG Industries, Inc. (PPG) |
|---|---|---|
| ROE | 55.9% | -44.5% |
| ROIC | 15.2% | 43.1% |
| P/E | 31.1 | 14.7 |
| P/B | 17.4 | -6.54 |
| Current Ratio | 0.87 | 1.62 |
| Quick Ratio | 0.53 | 1.22 |
| D/E | 2.81 | -2.10 |
| Debt-to-Assets | 50.0% | 93.6% |
| Interest Coverage | 8.11 | 9.00 |
| Asset Turnover | 0.91 | 1.99 |
| Fixed Asset Turnover | 3.84 | 0.00 |
| Payout Ratio | 30.3% | 39.8% |
| Dividend Yield | 0.98% | 2.71% |
| Fiscal Year | 2025 | 2025 |
Efficiency & Valuation Duel: The Vital Signs
Financial ratios act as the company’s DNA, exposing hidden risks and operational strengths that drive long-term shareholder value.
The Sherwin-Williams Company
Sherwin-Williams demonstrates a robust ROE of 55.9% and a solid net margin of 10.9%, signaling elite profitability. However, its elevated P/E of 31.1 and P/B of 17.4 indicate a stretched valuation. Dividend yield is modest at 0.98%, reflecting a conservative payout amid reinvestments in operational efficiency.
PPG Industries, Inc.
PPG posts a mixed profile: a strong ROIC of 43.1% and favorable P/E at 14.7, suggesting an attractively priced stock. Yet, its negative ROE at -44.5% flags profitability concerns. A higher dividend yield of 2.7% supports shareholder returns, compensating for uneven earnings performance.
Premium Valuation vs. Operational Safety
Sherwin-Williams offers exceptional profitability but trades at a premium with some liquidity red flags. PPG presents a more balanced valuation and stronger liquidity but struggles with negative returns on equity. Risk-tolerant investors may prefer Sherwin-Williams’ growth profile, while those favoring stability might lean toward PPG.
Which one offers the Superior Shareholder Reward?
I compare Sherwin-Williams (SHW) and PPG Industries (PPG) on dividends, payout ratios, and buybacks. SHW delivers a modest yield near 1% with a sustainable payout ratio around 30%. It complements dividends with steady buybacks, boosting total returns. PPG offers a higher dividend yield near 2.7% but at a riskier payout exceeding 55%, and negative free cash flow limits buyback capacity. SHW’s conservative distribution and consistent cash generation signal a more durable shareholder reward. I conclude Sherwin-Williams offers a superior total return profile for 2026 investors focused on sustainability and capital efficiency.
Comparative Score Analysis: The Strategic Profile
The radar chart reveals the fundamental DNA and trade-offs of The Sherwin-Williams Company and PPG Industries, Inc., highlighting their core financial strengths and valuation challenges:
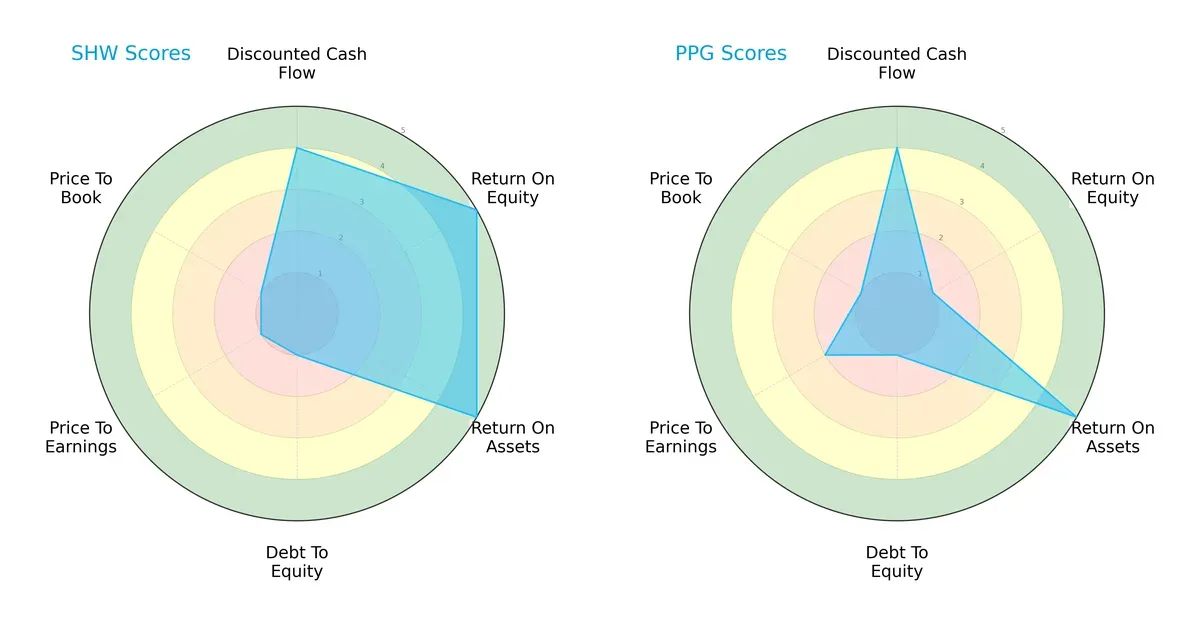
Sherwin-Williams posts a balanced profile with very favorable ROE and ROA scores, but suffers from weak valuation and leverage metrics. PPG relies heavily on asset efficiency but lags significantly in equity returns. Both firms share debt-related risks, yet Sherwin-Williams demonstrates a more robust profitability edge.
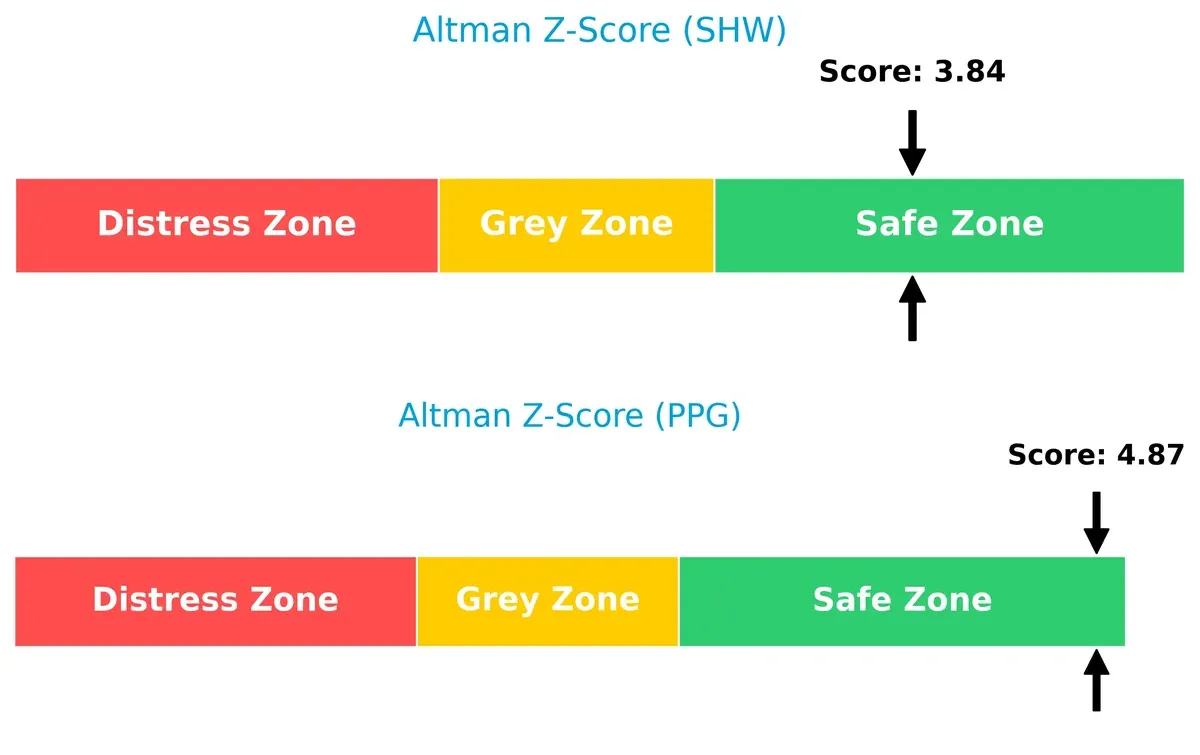
Bankruptcy Risk: Solvency Showdown
The Altman Z-Score gap shows both companies in the safe zone, with PPG holding a stronger buffer against bankruptcy risk in this cycle:
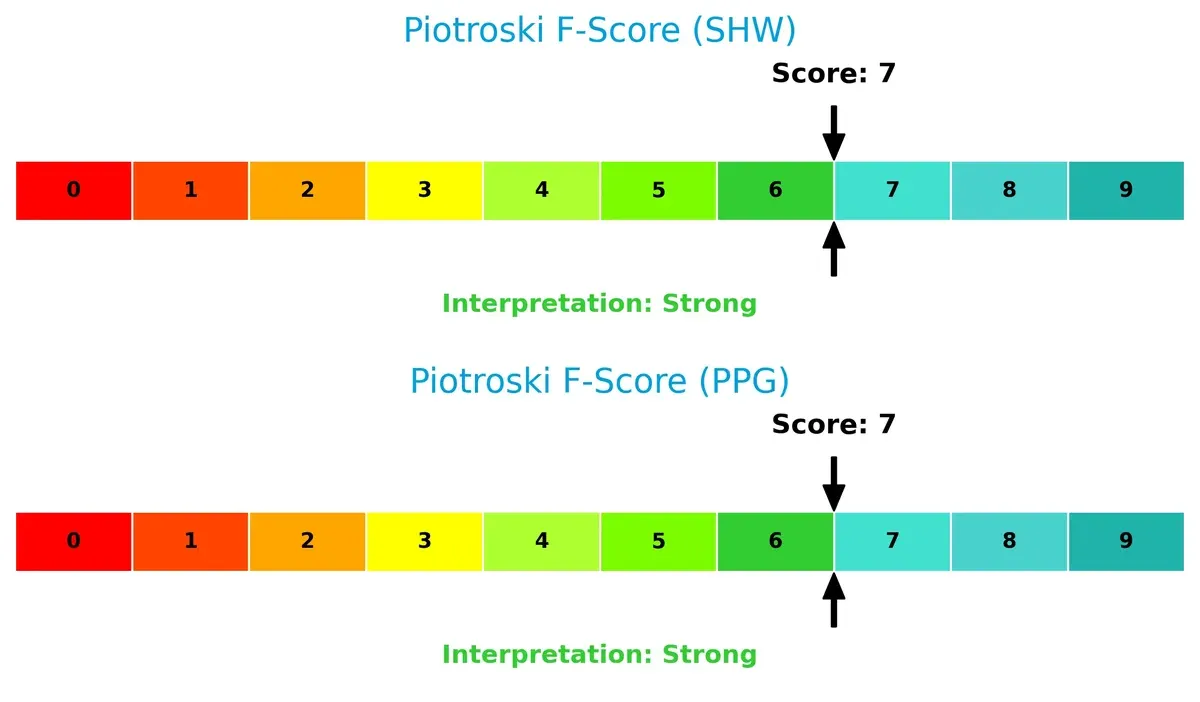
Financial Health: Quality of Operations
Both firms score a strong 7 on the Piotroski scale, indicating solid operational health and no immediate red flags in internal financial metrics:
How are the two companies positioned?
This section dissects SHW and PPG’s operational DNA by comparing revenue distribution and internal dynamics. The goal is to confront their economic moats to identify the most resilient competitive advantage today.
Revenue Segmentation: The Strategic Mix
The following visual comparison dissects how The Sherwin-Williams Company and PPG Industries, Inc. diversify their income streams and where their primary sector bets lie:
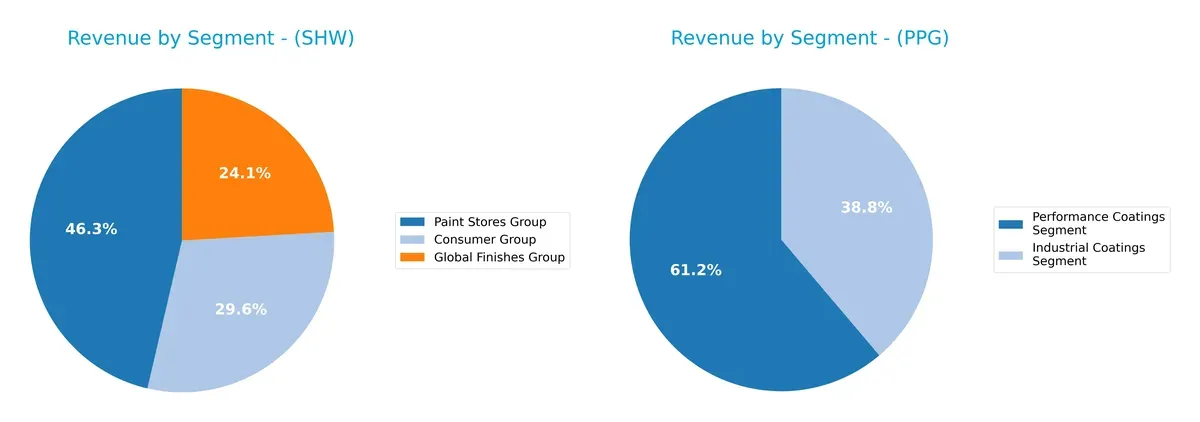
Sherwin-Williams anchors revenue in its Paint Stores Group at $13.2B, complemented by Consumer and Global Finishes groups at $8.4B and $6.9B respectively, showing moderate diversification. PPG Industries pivots between two segments: Performance Coatings at $11.2B and Industrial Coatings at $7.1B, reflecting a balanced but narrower focus. Sherwin-Williams’ retail dominance drives ecosystem lock-in, while PPG’s dual-segment approach mitigates concentration risk through industrial diversification.
Strengths and Weaknesses Comparison
This table compares the Strengths and Weaknesses of The Sherwin-Williams Company (SHW) and PPG Industries, Inc. (PPG):
SHW Strengths
- Favorable net margin at 10.9%
- High ROE of 55.86%
- Positive ROIC at 15.21%
- Strong fixed asset turnover at 3.84
- Diverse revenue from Consumer, Global Finishes, Paint Stores segments
PPG Strengths
- Favorable ROIC at 43.13%
- Lower WACC at 7.96%
- Attractive P/E of 14.71 and negative P/B
- Strong current and quick ratios above 1.2
- Higher dividend yield at 2.71%
- Global revenue from Asia Pacific, EMEA, Latin America, North America
SHW Weaknesses
- Unfavorable P/E at 31.08 and P/B at 17.36
- Low liquidity with current ratio 0.87 and quick ratio 0.53
- High debt to equity at 2.81
- Nearly 50% debt to assets ratio
- Slightly unfavorable overall ratio profile
PPG Weaknesses
- Negative ROE at -44.48%
- Extremely high debt to assets at 93.55%
- Fixed asset turnover at zero
- Unfavorable high leverage despite favorable interest coverage
Both companies show distinct financial profiles. SHW excels in profitability metrics but struggles with liquidity and valuation ratios. PPG displays better liquidity and cost of capital metrics but faces challenges in equity returns and high leverage. Their strategies must address these contrasting financial strengths and weaknesses.
The Moat Duel: Analyzing Competitive Defensibility
A structural moat is the only barrier protecting long-term profits from relentless competitive erosion. Let’s dissect the moats of two industry leaders:
The Sherwin-Williams Company: Switching Costs and Brand Loyalty
Sherwin-Williams commands a durable moat driven by strong switching costs and brand loyalty, reflected in a 48.9% gross margin and stable EBIT margin near 16%. Despite slow recent revenue growth, its expanding ROIC signals efficient capital use and deepening advantage with product innovation in 2026.
PPG Industries, Inc.: Scale and Innovation Synergy
PPG’s moat stems from scale economies and innovation synergy across diverse coatings markets, distinct from Sherwin’s focus on professional channels. Its ROIC surged sharply over five years, surpassing Sherwin’s, indicating superior capital allocation. PPG’s global footprint and R&D pipeline promise robust expansion and disruption potential in 2026.
Scale Economies vs. Switching Costs: The Competitive Moat Battle
Both firms show very favorable moats, but PPG’s explosive ROIC growth and global scale create a wider moat. Sherwin’s switching costs provide stability, yet PPG is better positioned to defend and extend market share amid evolving industry dynamics.
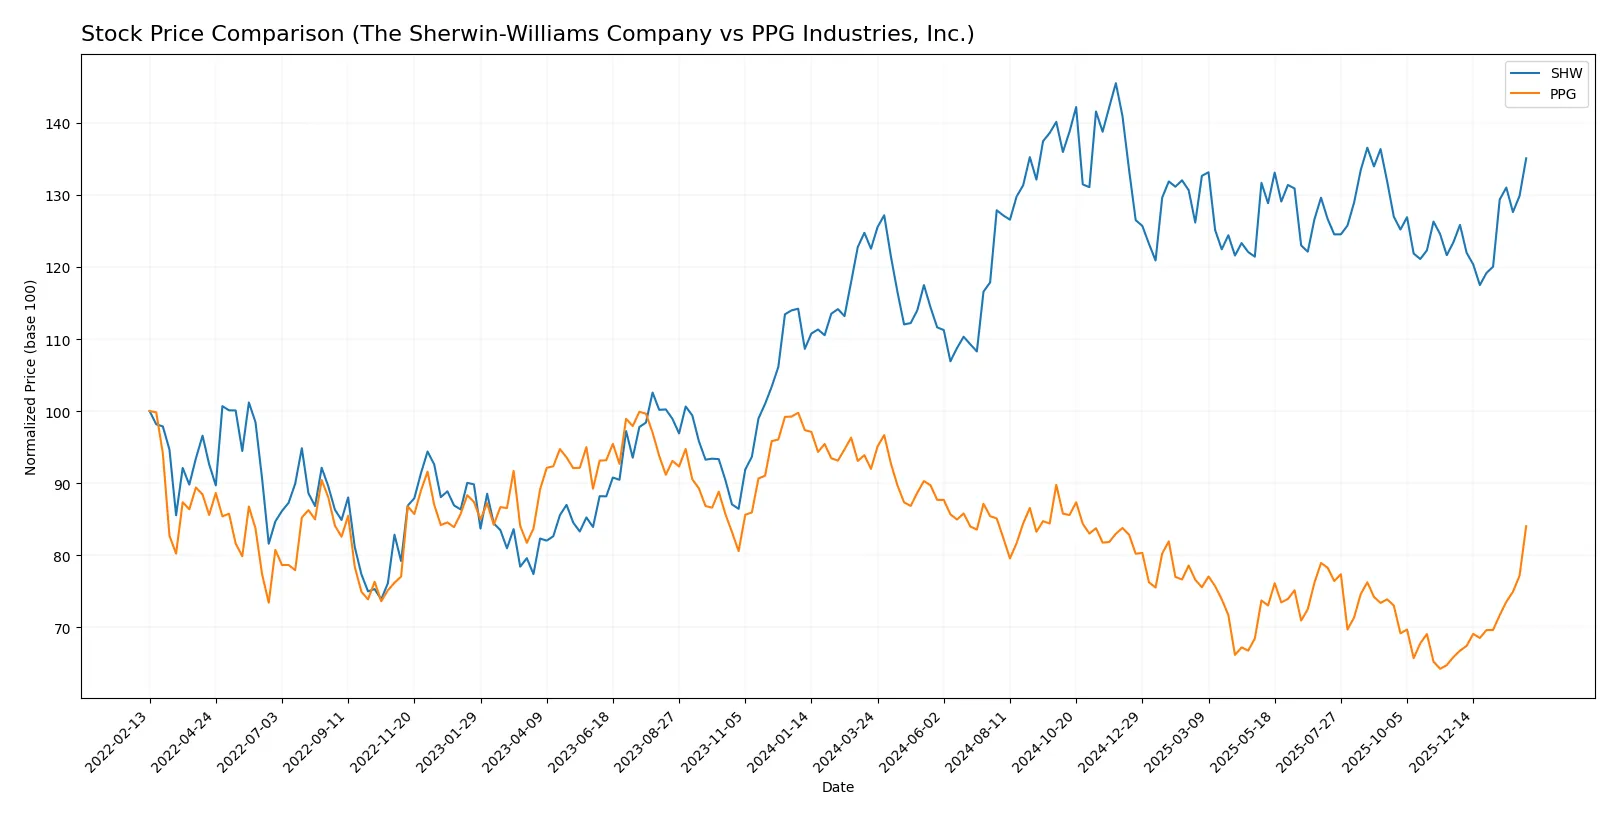
Which stock offers better returns?
The past year shows divergent price dynamics with SHW gaining steadily while PPG declined overall but surged recently, reflecting contrasting investor sentiment and momentum shifts.
Trend Comparison
The Sherwin-Williams Company (SHW) posted a 10.23% price increase over 12 months, marking a bullish trend with accelerating gains and a 22.58 volatility, hitting a high of 397.4.
PPG Industries, Inc. (PPG) saw an 8.64% price decline over the same period, indicating a bearish trend despite recent acceleration and a 27.61% jump in the last quarter with lower volatility at 7.47.
SHW outperformed PPG over the full year, delivering positive returns versus a negative total change, despite PPG’s strong recent rally.
Target Prices
Analysts present a constructive consensus on Sherwin-Williams and PPG Industries with moderate upside potential.
| Company | Target Low | Target High | Consensus |
|---|---|---|---|
| The Sherwin-Williams Company | 371 | 420 | 393.5 |
| PPG Industries, Inc. | 115 | 135 | 126 |
Sherwin-Williams trades slightly below its consensus target, signaling modest appreciation potential. PPG’s target consensus aligns closely with its current price, indicating limited near-term upside.

Don’t Let Luck Decide Your Entry Point
Optimize your entry points with our advanced ProRealTime indicators. You’ll get efficient buy signals with precise price targets for maximum performance. Start outperforming now!
How do institutions grade them?
Here is a summary of recent institutional grades for The Sherwin-Williams Company and PPG Industries, Inc.:
The Sherwin-Williams Company Grades
The following table lists recent grades from reputable financial institutions for Sherwin-Williams:
| Grading Company | Action | New Grade | Date |
|---|---|---|---|
| RBC Capital | Maintain | Outperform | 2026-01-30 |
| UBS | Maintain | Buy | 2026-01-12 |
| Citigroup | Upgrade | Buy | 2025-12-18 |
| Mizuho | Maintain | Outperform | 2025-12-18 |
| Citigroup | Maintain | Neutral | 2025-10-30 |
| JP Morgan | Maintain | Overweight | 2025-10-29 |
| UBS | Maintain | Buy | 2025-10-29 |
| RBC Capital | Maintain | Outperform | 2025-10-29 |
| Wells Fargo | Maintain | Overweight | 2025-10-29 |
| B of A Securities | Maintain | Neutral | 2025-10-14 |
PPG Industries, Inc. Grades
Below is a summary of recent grades from credible financial firms for PPG Industries:
| Grading Company | Action | New Grade | Date |
|---|---|---|---|
| Wells Fargo | Maintain | Overweight | 2026-01-29 |
| Jefferies | Maintain | Hold | 2026-01-29 |
| UBS | Maintain | Neutral | 2026-01-29 |
| Citigroup | Maintain | Buy | 2026-01-29 |
| Goldman Sachs | Maintain | Buy | 2026-01-29 |
| JP Morgan | Maintain | Overweight | 2026-01-29 |
| RBC Capital | Maintain | Sector Perform | 2026-01-29 |
| Mizuho | Maintain | Outperform | 2026-01-28 |
| Citigroup | Maintain | Buy | 2025-12-18 |
| JP Morgan | Maintain | Overweight | 2025-11-21 |
Which company has the best grades?
Sherwin-Williams consistently receives outperform and buy ratings with occasional upgrades. PPG has more mixed grades, including hold and neutral alongside buy and outperform. Sherwin-Williams’ stronger grades may indicate more institutional confidence, potentially influencing investor sentiment positively.
Risks specific to each company
The following categories identify the critical pressure points and systemic threats facing both firms in the 2026 market environment:
1. Market & Competition
The Sherwin-Williams Company
- Dominates with strong brand presence in architectural and industrial coatings; faces stiff competition in specialty segments.
PPG Industries, Inc.
- Broad product portfolio with specialized coatings; competes aggressively in automotive and industrial markets.
2. Capital Structure & Debt
The Sherwin-Williams Company
- High debt-to-equity ratio (2.81) signals elevated financial risk despite solid interest coverage.
PPG Industries, Inc.
- Negative debt-to-equity ratio indicates complex capital structure; very high debt-to-assets (93.55%) raises leverage concerns.
3. Stock Volatility
The Sherwin-Williams Company
- Beta at 1.26 suggests above-market volatility; stock price range is relatively narrow.
PPG Industries, Inc.
- Beta at 1.16 indicates moderate volatility; wider trading range reflects investor uncertainty.
4. Regulatory & Legal
The Sherwin-Williams Company
- Operating globally, exposed to evolving environmental regulations impacting chemical manufacturing.
PPG Industries, Inc.
- Extensive coatings for aerospace and military increase exposure to stringent defense and export controls.
5. Supply Chain & Operations
The Sherwin-Williams Company
- Relies on vertically integrated stores and distribution networks; supply disruptions could affect product availability.
PPG Industries, Inc.
- Complex global supply chain for diverse specialty materials; susceptible to raw material price fluctuations.
6. ESG & Climate Transition
The Sherwin-Williams Company
- Faces pressure to reduce carbon footprint in coatings production; emerging sustainability regulations.
PPG Industries, Inc.
- High focus on sustainable coatings and materials; must innovate to meet climate transition demands.
7. Geopolitical Exposure
The Sherwin-Williams Company
- Moderate international operations with some vulnerability to trade tensions and tariffs.
PPG Industries, Inc.
- Greater reliance on international aerospace and military clients exposes it to geopolitical risks.
Which company shows a better risk-adjusted profile?
Sherwin-Williams’ most impactful risk is its high leverage, which strains financial flexibility despite strong profitability. PPG’s critical risk lies in its extreme debt levels paired with uneven returns on equity. I see PPG offering a better risk-adjusted profile overall, supported by a safer Altman Z-Score (4.87 vs. 3.84) and more favorable liquidity ratios. However, Sherwin-Williams’ dominant market position and superior ROE (56%) provide some offset to its debt concerns. Investors should weigh PPG’s capital structure risks against Sherwin-Williams’ valuation premiums and operational scale.
Final Verdict: Which stock to choose?
The Sherwin-Williams Company’s superpower lies in its ability to generate consistently high returns on invested capital, reflecting a strong and growing economic moat. Its efficiency in capital allocation drives above-average profitability. However, a point of vigilance remains its weak liquidity ratios, signaling potential short-term financial stress. It fits well in an Aggressive Growth portfolio focused on durable competitive advantages.
PPG Industries, Inc. boasts a strategic moat rooted in its strong return on invested capital and a healthier liquidity profile than Sherwin-Williams. Its lower valuation multiples and favorable debt metrics offer a margin of safety, appealing to investors seeking a balance between growth and risk mitigation. PPG suits a GARP (Growth at a Reasonable Price) portfolio aiming for stability with upside potential.
If you prioritize long-term value creation through superior capital efficiency and can tolerate liquidity risks, Sherwin-Williams outshines with its growing profitability and robust moat. However, if you seek better financial stability and a more conservative exposure with reasonable growth prospects, PPG offers better safety and valuation appeal. Both present compelling analytical scenarios depending on your risk tolerance and investment horizon.
Disclaimer: Investment carries a risk of loss of initial capital. The past performance is not a reliable indicator of future results. Be sure to understand risks before making an investment decision.
Go Further
I encourage you to read the complete analyses of The Sherwin-Williams Company and PPG Industries, Inc. to enhance your investment decisions: