W.W. Grainger, Inc. and Pool Corporation are two prominent players in the industrial distribution sector, each specializing in distinct yet overlapping markets. Grainger focuses on maintenance, repair, and operating products, while Pool Corporation dominates the pool supplies and leisure equipment niche. Comparing their market strategies and innovation approaches offers valuable insights for investors seeking opportunities in industrial distribution. This article will help you identify which company holds the most promising potential for your portfolio.
Table of contents
Companies Overview
I will begin the comparison between W.W. Grainger, Inc. and Pool Corporation by providing an overview of these two companies and their main differences.
W.W. Grainger, Inc. Overview
W.W. Grainger, Inc. distributes maintenance, repair, and operating (MRO) products and services across the US, Japan, Canada, the UK, and internationally. Operating since 1927, it offers a broad range of safety supplies, material handling equipment, plumbing, and tools, alongside inventory management and technical support. The company serves businesses, government entities, and other institutions through sales representatives and ecommerce channels.
Pool Corporation Overview
Pool Corporation distributes swimming pool supplies, equipment, and leisure products in North America, Europe, and Australia. Founded in 1993, it offers maintenance chemicals, pool accessories, repair parts, fiberglass pools, and building materials for pool construction and remodeling. Pool Corp serves pool builders, specialty retailers, repair businesses, irrigation contractors, and commercial customers like hotels and universities from 410 sales centers globally.
Key similarities and differences
Both companies operate in the industrial distribution sector, serving niche markets with specialized products and services. Grainger focuses on MRO products for a wide range of industries worldwide, while Pool Corp specializes in swimming pool supplies and related outdoor living products primarily in North America and select international regions. Grainger is significantly larger with 23,500 employees and a $49B market cap, compared to Pool’s 6,000 employees and $9.3B market cap.
Income Statement Comparison
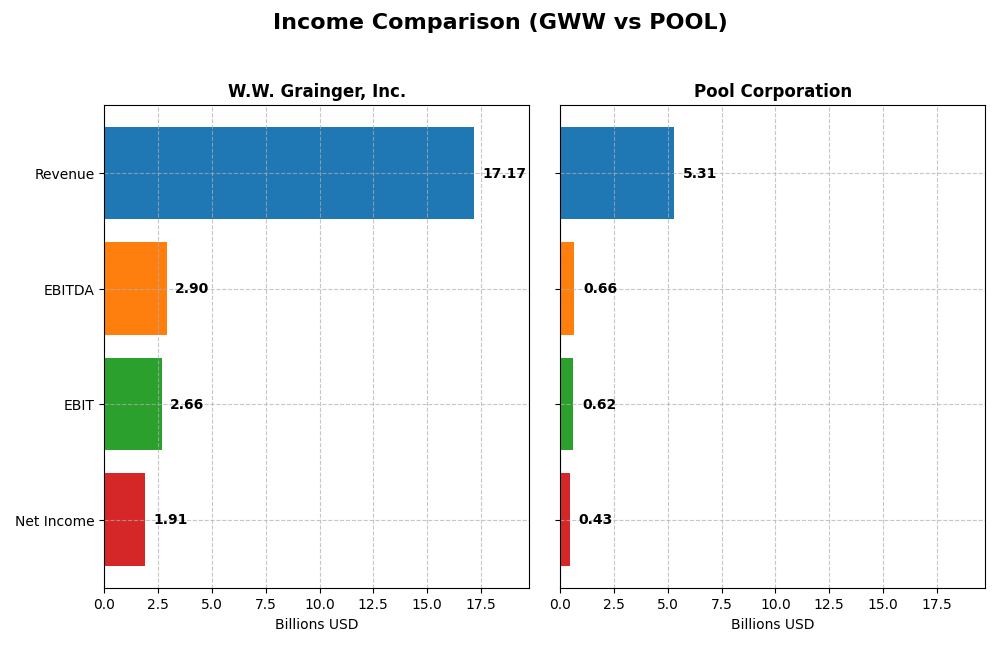
The following table compares the key income statement metrics for W.W. Grainger, Inc. and Pool Corporation for the fiscal year 2024, providing a snapshot of their financial performance.
| Metric | W.W. Grainger, Inc. | Pool Corporation |
|---|---|---|
| Market Cap | 49.1B | 9.3B |
| Revenue | 17.2B | 5.3B |
| EBITDA | 2.9B | 663M |
| EBIT | 2.7B | 617M |
| Net Income | 1.9B | 434M |
| EPS | 39.04 | 11.37 |
| Fiscal Year | 2024 | 2024 |
Income Statement Interpretations
W.W. Grainger, Inc.
From 2020 to 2024, W.W. Grainger, Inc. showed a steady increase in revenue, rising from $11.8B to $17.2B, with net income growing significantly from $695M to $1.9B. Gross and EBIT margins remained favorable, at 38.96% and 15.5% respectively. In 2024, revenue growth slowed to 4.19%, but margins and EPS growth remained positive, indicating stable profitability.
Pool Corporation
Pool Corporation experienced revenue growth from $3.9B in 2020 to $5.3B in 2024, with net income increasing from $367M to $434M overall. However, in 2024, revenues declined by 4.16% and net income fell by 13.39%, with margins compressing. Despite favorable margins over the period, recent performance shows weakening profitability and shrinking EBIT and net margins.
Which one has the stronger fundamentals?
W.W. Grainger exhibits stronger fundamentals, with a higher market cap and consistent revenue and net income growth, alongside expanding margins. Pool Corporation’s fundamentals are mixed; while it has grown over the longer term, recent declines in revenue and profitability, coupled with margin contraction, suggest more volatility. Overall, Grainger’s financials present a more favorable and stable income statement profile.
Financial Ratios Comparison
The table below presents key financial ratios for W.W. Grainger, Inc. (GWW) and Pool Corporation (POOL) based on their most recent fiscal year 2024 data, facilitating a straightforward comparison of operational efficiency, profitability, liquidity, and leverage.
| Ratios | W.W. Grainger, Inc. (GWW) | Pool Corporation (POOL) |
|---|---|---|
| ROE | 56.8% | 34.1% |
| ROIC | 28.6% | 17.7% |
| P/E | 27.0 | 29.8 |
| P/B | 15.3 | 10.2 |
| Current Ratio | 2.49 | 2.05 |
| Quick Ratio | 1.49 | 0.52 |
| D/E (Debt-to-Equity) | 0.95 | 1.00 |
| Debt-to-Assets | 36.1% | 37.8% |
| Interest Coverage | 34.2 | 12.3 |
| Asset Turnover | 1.94 | 1.58 |
| Fixed Asset Turnover | 7.47 | 9.38 |
| Payout Ratio | 22.1% | 41.4% |
| Dividend Yield | 0.82% | 1.39% |
Interpretation of the Ratios
W.W. Grainger, Inc.
W.W. Grainger, Inc. presents a solid set of financial ratios with strong returns on equity (56.85%) and invested capital (28.58%), complemented by a favorable current ratio of 2.49 and robust interest coverage at 34.56. However, valuation metrics such as a high P/E of 27.0 and P/B of 15.35 are less favorable. The company pays dividends, but the yield is low at 0.82%, indicating limited income return despite consistent payouts.
Pool Corporation
Pool Corporation shows moderately strong ratios with favorable returns on equity (34.11%) and invested capital (17.69%), alongside a decent current ratio of 2.05. The quick ratio of 0.52 is a concern, reflecting potential liquidity constraints. Valuation multiples remain elevated with a P/E of 29.84 and P/B of 10.18. It pays dividends with a 1.39% yield, suggesting a moderate income component for shareholders, supported by stable coverage.
Which one has the best ratios?
W.W. Grainger, Inc. exhibits a higher proportion of favorable ratios (57.14%) and stronger profitability metrics compared to Pool Corporation’s 42.86%, despite both facing valuation challenges. Grainger’s superior liquidity and interest coverage add to its financial resilience, while Pool’s liquidity and yield are less robust, leading to a slightly favorable overall rating for Pool versus a favorable rating for Grainger.
Strategic Positioning
This section compares the strategic positioning of W.W. Grainger, Inc. and Pool Corporation, focusing on market position, key segments, and exposure to technological disruption:
W.W. Grainger, Inc.
- Leading distributor in industrial MRO products facing competitive pressure in global markets.
- Two main segments: High-Touch Solutions N.A. (~$13.7B) and Endless Assortment (~$3.1B) driving business.
- No explicit mention of disruption risks or technological shifts in operations or market.
Pool Corporation
- Distributor specializing in swimming pool supplies with competition in North America and internationally.
- Operates a single reportable segment focused on pool and leisure product distribution (~$5.3B).
- No explicit exposure to technological disruption detailed in business description.
W.W. Grainger, Inc. vs Pool Corporation Positioning
W.W. Grainger operates a diversified business model with multiple segments across several countries, while Pool Corporation concentrates on swimming pool supply distribution. Grainger’s broad offering may provide stability, whereas Pool’s focus could imply vulnerability to sector-specific trends.
Which has the best competitive advantage?
W.W. Grainger demonstrates a very favorable economic moat with growing profitability, indicating strong competitive advantage. Pool Corporation creates value but shows a declining ROIC trend, suggesting a weaker yet positive competitive position.
Stock Comparison
The stock prices of W.W. Grainger, Inc. and Pool Corporation over the past year reveal contrasting dynamics, with W.W. Grainger showing steady gains and Pool Corporation facing significant declines amid varying buyer-seller activity.
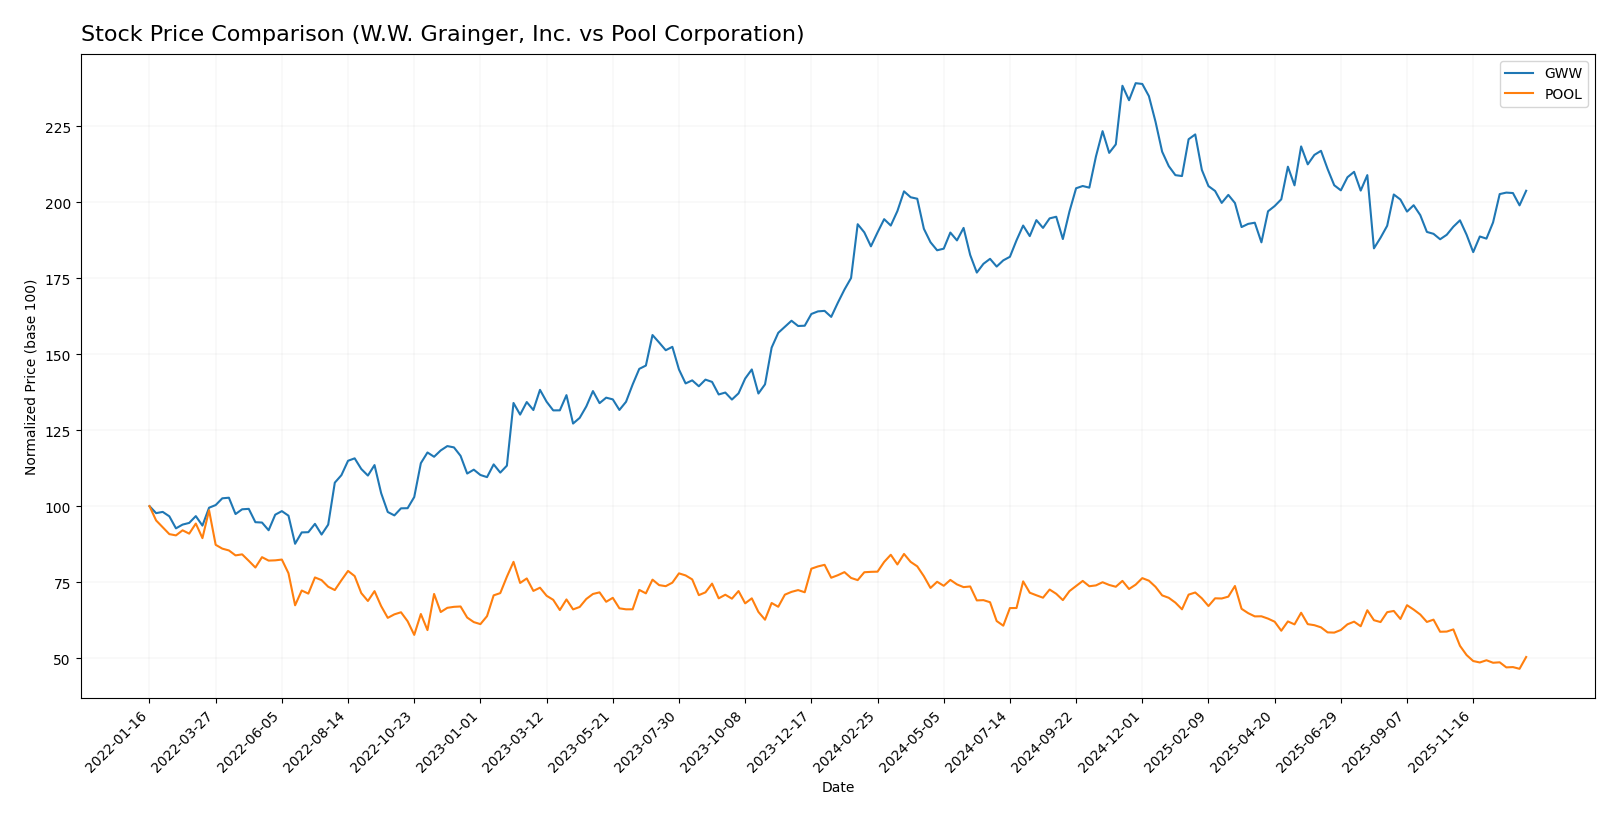
Trend Analysis
W.W. Grainger, Inc. exhibits a bullish trend over the past 12 months with a 9.86% price increase and accelerating momentum, reaching a high of 1206.65 and a low of 892.25 amid high volatility (std deviation 70.06).
Pool Corporation displays a bearish trend with a 35.74% decline over the year and decelerating downward pressure, hitting a peak of 416.38 and a low of 229.71, while volatility remains moderate (std deviation 43.46).
Comparing both, W.W. Grainger has delivered the strongest market performance, significantly outperforming Pool Corporation’s considerable losses during the same period.
Target Prices
Here is the current consensus on target prices for W.W. Grainger, Inc. and Pool Corporation from verified analysts.
| Company | Target High | Target Low | Consensus |
|---|---|---|---|
| W.W. Grainger, Inc. | 1200 | 950 | 1050.17 |
| Pool Corporation | 360 | 250 | 314.75 |
Analysts expect W.W. Grainger’s price to modestly exceed its current 1031.64 USD, while Pool Corporation’s consensus target price is significantly above its current 249.34 USD. This reflects moderate upside potential for both stocks.
Analyst Opinions Comparison
This section compares analysts’ ratings and financial scores for W.W. Grainger, Inc. (GWW) and Pool Corporation (POOL):
Rating Comparison
GWW Rating
- B+ rating categorized as very favorable by analysts.
- Moderate discounted cash flow score of 3 indicates balanced valuation.
- Very favorable return on equity score of 5 reflects efficient profit generation.
- Very favorable return on assets score of 5 shows effective asset utilization.
- Moderate debt to equity score of 3 implies average financial risk.
- Moderate overall score of 3 represents a balanced financial standing.
POOL Rating
- B+ rating categorized as very favorable by analysts.
- Favorable discounted cash flow score of 4 suggests better valuation.
- Very favorable return on equity score of 5 reflects efficient profit generation.
- Very favorable return on assets score of 5 shows effective asset utilization.
- Very unfavorable debt to equity score of 1 indicates higher financial risk.
- Moderate overall score of 3 represents a balanced financial standing.
Which one is the best rated?
Both companies share the same overall moderate score and B+ rating, but POOL has a higher discounted cash flow score, indicating better valuation prospects, while GWW has a stronger debt to equity score, reflecting lower financial risk.
Scores Comparison
The scores comparison between W.W. Grainger, Inc. and Pool Corporation is as follows:
W.W. Grainger, Inc. Scores
- Altman Z-Score: 11.58, indicating a safe zone with very low bankruptcy risk.
- Piotroski Score: 7, classified as strong financial health.
Pool Corporation Scores
- Altman Z-Score: 5.39, indicating a safe zone with low bankruptcy risk.
- Piotroski Score: 7, classified as strong financial health.
Which company has the best scores?
Based strictly on the data, W.W. Grainger, Inc. has a higher Altman Z-Score, indicating stronger financial stability, while both companies share the same Piotroski Score of 7, reflecting equally strong financial health.
Grades Comparison
Here is a comparison of recent grades assigned to W.W. Grainger, Inc. and Pool Corporation by major financial institutions:
W.W. Grainger, Inc. Grades
The following table summarizes recent grades from reputable grading firms for W.W. Grainger, Inc.:
| Grading Company | Action | New Grade | Date |
|---|---|---|---|
| Morgan Stanley | Maintain | Equal Weight | 2025-11-25 |
| Barclays | Maintain | Underweight | 2025-11-07 |
| RBC Capital | Maintain | Sector Perform | 2025-11-03 |
| RBC Capital | Maintain | Sector Perform | 2025-10-16 |
| JP Morgan | Maintain | Neutral | 2025-10-15 |
| JP Morgan | Maintain | Neutral | 2025-09-04 |
| Loop Capital | Maintain | Hold | 2025-08-04 |
| RBC Capital | Maintain | Sector Perform | 2025-08-04 |
| Morgan Stanley | Maintain | Equal Weight | 2025-07-11 |
| JP Morgan | Maintain | Neutral | 2025-05-27 |
The overall trend in grades for W.W. Grainger, Inc. is predominantly neutral to hold, indicating a cautious stance by analysts without strong upward or downward signals.
Pool Corporation Grades
The following table presents recent grades from established grading companies for Pool Corporation:
| Grading Company | Action | New Grade | Date |
|---|---|---|---|
| CFRA | Upgrade | Buy | 2025-12-23 |
| Stifel | Maintain | Hold | 2025-12-16 |
| Wells Fargo | Maintain | Equal Weight | 2025-12-15 |
| William Blair | Downgrade | Market Perform | 2025-10-15 |
| Oppenheimer | Maintain | Outperform | 2025-07-29 |
| Baird | Maintain | Neutral | 2025-07-25 |
| Wells Fargo | Maintain | Equal Weight | 2025-07-08 |
| Oppenheimer | Maintain | Outperform | 2025-04-28 |
| Stephens & Co. | Maintain | Overweight | 2025-04-28 |
| Baird | Maintain | Neutral | 2025-04-25 |
The grades for Pool Corporation show a generally positive trend with upgrades and several outperform or overweight ratings, suggesting favorable analyst sentiment.
Which company has the best grades?
Pool Corporation has received stronger and more positive grades compared to W.W. Grainger, Inc., including recent upgrades and outperform ratings. This contrast may influence investors seeking growth potential versus those favoring stability or caution.
Strengths and Weaknesses
Below is a comparison of key strengths and weaknesses for W.W. Grainger, Inc. (GWW) and Pool Corporation (POOL) based on their latest financial and operational data.
| Criterion | W.W. Grainger, Inc. (GWW) | Pool Corporation (POOL) |
|---|---|---|
| Diversification | Strong product diversification with $13.7B in High-Touch Solutions and $3.13B in Endless Assortment | Less diversified, focused primarily on pool products with $5.31B revenue in one segment |
| Profitability | High profitability: ROIC 28.6%, Net Margin 11.12%, ROE 56.85% | Moderate profitability: ROIC 17.7%, Net Margin 8.18%, ROE 34.11% |
| Innovation | Demonstrates durable competitive advantage with growing ROIC (+73%) | Creating value but profitability declining (ROIC down -37.5%) |
| Global presence | Extensive North American footprint with diverse product lines | Primarily North American market focus |
| Market Share | Large market share in industrial supply distribution | Leading market share in pool equipment distribution |
Key takeaways: W.W. Grainger exhibits stronger diversification, higher and growing profitability, and a durable competitive moat. Pool Corporation remains profitable but faces declining returns and less diversification, suggesting higher risk and more focus on a niche market. Investors seeking stability and growth may favor Grainger, while those targeting a specialized sector could consider Pool with caution.
Risk Analysis
Below is a comparative risk table for W.W. Grainger, Inc. (GWW) and Pool Corporation (POOL) based on their most recent financial and operational data from 2024-2026.
| Metric | W.W. Grainger, Inc. (GWW) | Pool Corporation (POOL) |
|---|---|---|
| Market Risk | Beta 1.13; moderate stock volatility | Beta 1.22; slightly higher volatility |
| Debt level | Debt-to-Equity ~0.95; neutral risk | Debt-to-Equity ~1.0; moderate leverage risk |
| Regulatory Risk | Moderate; operates mainly in stable regulatory environments | Moderate; international operations add complexity |
| Operational Risk | Strong operational efficiency; high asset turnover | Strong asset turnover; quick ratio low, indicating liquidity risk |
| Environmental Risk | Moderate; industrial sector with some exposure | Moderate; supply chain and manufacturing impacts |
| Geopolitical Risk | Low to moderate; diversified global presence | Moderate; exposure in North America, Europe, Australia |
Both companies demonstrate solid financial health with Altman Z-Scores well in the safe zone and strong Piotroski scores. Market risk is manageable but slightly higher for POOL due to its beta. POOL’s lower quick ratio signals potential short-term liquidity concerns. Debt levels are moderate and comparable, but POOL carries a slightly higher leverage risk. Regulatory and environmental risks remain moderate for both given their industrial distribution focus. Overall, market volatility and liquidity risks are the most likely and impactful factors to monitor closely.
Which Stock to Choose?
W.W. Grainger, Inc. (GWW) shows a favorable income evolution with 45.53% revenue growth and 174.68% net income growth over 2020-2024. Financial ratios are largely favorable, including a strong 56.85% ROE and 28.58% ROIC, moderate debt levels, and a very favorable B+ rating.
Pool Corporation (POOL) exhibits mixed income trends with 34.91% revenue growth but a 12.22% decline in net margin over the same period. Financial ratios are slightly favorable overall, with a solid 34.11% ROE and 17.69% ROIC, higher debt, and a similarly rated B+ score.
For investors, GWW’s very favorable rating, strong and growing profitability, and durable competitive advantage might appeal more to those prioritizing quality and stability. Conversely, POOL’s slightly favorable ratios and declining profitability could be more suited to risk-tolerant investors focusing on potential value recovery.
Disclaimer: Investment carries a risk of loss of initial capital. The past performance is not a reliable indicator of future results. Be sure to understand risks before making an investment decision.
Go Further
I encourage you to read the complete analyses of W.W. Grainger, Inc. and Pool Corporation to enhance your investment decisions: