Home > Comparison > Industrials > PONY vs URI
The strategic rivalry between Pony AI Inc. and United Rentals, Inc. shapes the evolution of the rental and leasing services sector. Pony AI leads with autonomous mobility solutions, blending advanced software and robotics, while United Rentals dominates traditional equipment rental with a vast physical network. This head-to-head pits innovation-driven growth against established scale and operational breadth. I will analyze which company offers the superior risk-adjusted profile for a diversified portfolio.
Table of contents
Companies Overview
Pony AI and United Rentals stand as leaders in rental and leasing services, shaping different corners of industrial demand.
Pony AI: Autonomous Mobility Innovator
Pony AI leads in autonomous mobility solutions, generating revenue by providing robotruck and robotaxi services in China and the US. Its core business extends to AV software deployment, vehicle integration, and road safety tech. In 2026, Pony AI sharpens its focus on expanding intelligent driving software and V2X products, aiming to revolutionize urban logistics and personal transport.
United Rentals: Equipment Rental Powerhouse
United Rentals dominates equipment rental with a vast network of 1,360 locations across North America, Europe, and Oceania. It earns primarily from general and specialty construction equipment rentals, plus sales of used machinery and maintenance services. Its 2026 strategy emphasizes broadening specialty rentals and enhancing customer service to support infrastructure projects and industrial clients worldwide.
Strategic Collision: Similarities & Divergences
Both firms operate within rental services but diverge sharply: Pony AI builds a tech-driven autonomous ecosystem, while United Rentals offers a tangible, broad equipment fleet. The primary battleground is industrial efficiency—Pony AI through automation, United Rentals via equipment availability. Their distinct investment profiles reflect this: Pony AI is a high-beta growth play, United Rentals a stable, cash-generative industry leader.
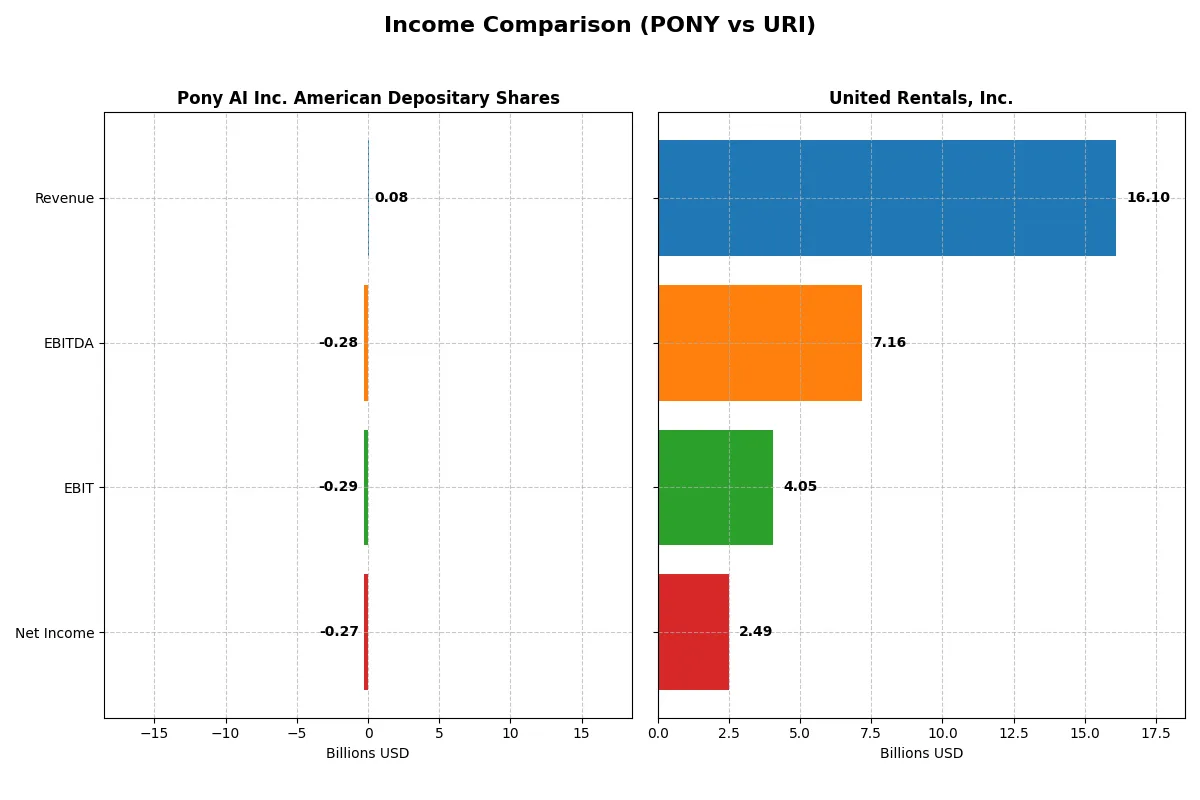
Income Statement Comparison
This data dissects the core profitability and scalability of both corporate engines to reveal who dominates the bottom line:
| Metric | Pony AI Inc. (PONY) | United Rentals, Inc. (URI) |
|---|---|---|
| Revenue | 75M | 16B |
| Cost of Revenue | 64M | 10.4B |
| Operating Expenses | 297M | 1.73B |
| Gross Profit | 11.4M | 5.71B |
| EBITDA | -277M | 7.16B |
| EBIT | -286M | 4.05B |
| Interest Expense | 0 | 716M |
| Net Income | -274M | 2.49B |
| EPS | -2.4 | 38.71 |
| Fiscal Year | 2024 | 2025 |
Income Statement Analysis: The Bottom-Line Duel
This income statement comparison reveals the true operational efficiency and profitability dynamics of two distinct corporate engines.
Pony AI Inc. American Depositary Shares Analysis
Pony AI’s revenue grew from $8.1M in 2021 to $75M in 2024, showing strong top-line momentum. However, net losses deepened to -$274M in 2024, driven by escalating R&D and operating expenses. Its gross margin slipped to 15.2%, reflecting cost pressures, while net margin remained deeply negative at -365%, signaling persistent inefficiency.
United Rentals, Inc. Analysis
United Rentals expanded revenue steadily from $9.7B in 2021 to $16.1B in 2025, maintaining robust scale. Gross margin held firm near 35%, and net income surged to $2.5B in 2025 with a 15.5% net margin. Despite slight margin erosion in the latest year, the company sustains strong profitability underpinned by disciplined cost control and capital allocation.
Margin Power vs. Revenue Scale
United Rentals clearly outperforms Pony AI in profitability, delivering positive margins and consistent net income growth. Pony AI’s revenue growth is impressive but overshadowed by mounting losses and negative margins. For investors, United Rentals’ stable profit profile offers a more attractive risk-return balance than Pony AI’s high-growth yet unprofitable trajectory.
Financial Ratios Comparison
These vital ratios act as a diagnostic tool to expose the underlying fiscal health, valuation premiums, and capital efficiency of the companies compared below:
| Ratios | Pony AI Inc. (PONY) | United Rentals, Inc. (URI) |
|---|---|---|
| ROE | -28.8% | 27.8% |
| ROIC | -29.1% | 11.7% |
| P/E | -5.98 | 18.1 |
| P/B | 1.72 | 5.42 |
| Current Ratio | 11.8 | 0.98 |
| Quick Ratio | 11.8 | 0.92 |
| D/E (Debt-to-Equity) | 0.015 | 1.72 |
| Debt-to-Assets | 1.3% | 53% |
| Interest Coverage | 0 | 5.9 |
| Asset Turnover | 0.071 | 0.54 |
| Fixed Asset Turnover | 2.05 | 0.89 |
| Payout Ratio | 0 | 17% |
| Dividend Yield | 0 | 0.93% |
| Fiscal Year | 2024 | 2024 |
Efficiency & Valuation Duel: The Vital Signs
Ratios act as a company’s DNA, revealing hidden risks and operational excellence that raw numbers alone cannot expose.
Pony AI Inc. American Depositary Shares
Pony AI shows deeply negative core profitability with ROE at -28.8% and margins unfavorable. Its valuation metrics, including a negative P/E, suggest a distressed or early-stage growth profile. The company carries minimal debt and a very high current ratio, but no dividends, instead focusing on heavy R&D reinvestment at 3.2% of revenue, signaling a growth priority over shareholder returns.
United Rentals, Inc.
United Rentals delivers solid profitability with a 27.8% ROE and a positive 15.5% net margin, demonstrating operational efficiency. Its P/E of 20.9 indicates a fairly valued stock, though a high price-to-book ratio of 5.81 and leverage ratios raise caution. The company pays a modest 0.89% dividend, balancing shareholder returns with ongoing capital expenditures.
Premium Valuation vs. Operational Safety
United Rentals offers a balanced risk-reward profile with positive returns and moderate valuation, while Pony AI’s metrics reflect high risk and heavy reinvestment without profitability. Investors seeking stability may favor United Rentals, whereas those with a higher risk appetite might consider Pony AI’s growth focus.
Which one offers the Superior Shareholder Reward?
Pony AI (PONY) pays no dividends and shows negative free cash flow, reflecting a reinvestment focus amid losses. United Rentals (URI) delivers a 0.9% yield with a modest 18.6% payout ratio and consistent buybacks, generating positive free cash flow of $10.3/share in 2025. Historically, URI’s balanced distribution strategy combines dividends and buybacks, sustaining long-term value. PONY’s zero payout and cash burn raise sustainability concerns. I conclude URI offers superior total shareholder reward in 2026.
Comparative Score Analysis: The Strategic Profile
The radar chart reveals the fundamental DNA and trade-offs of Pony AI Inc. and United Rentals, Inc., highlighting their distinct financial profiles:
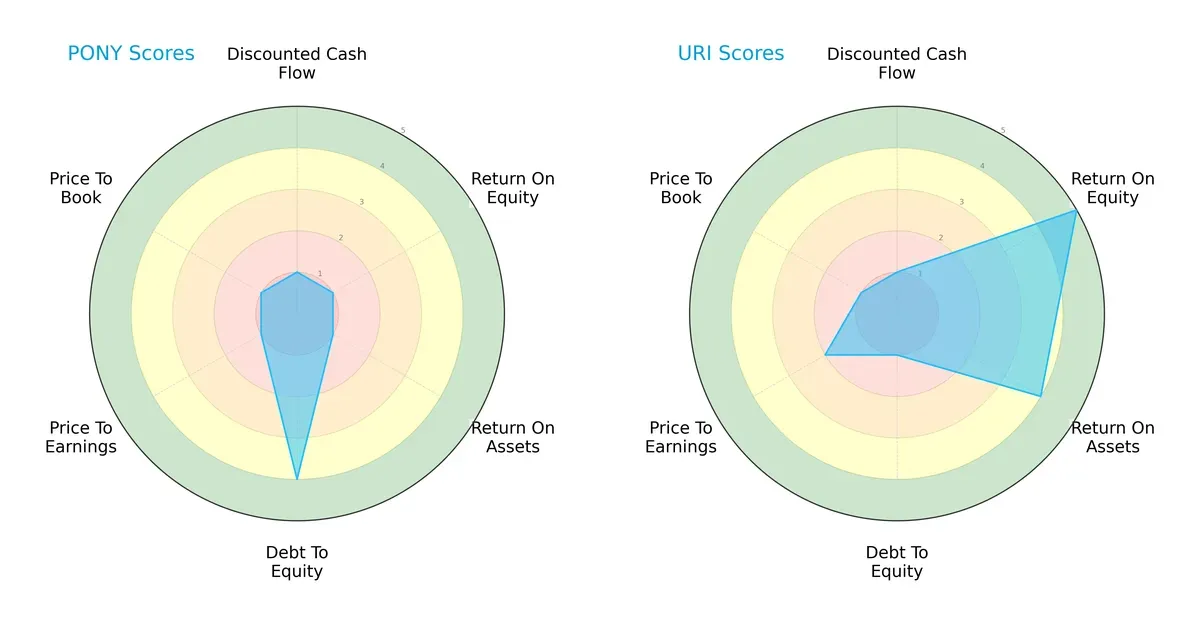
United Rentals shows a more balanced profile, excelling in Return on Equity (5 vs. 1) and Return on Assets (4 vs. 1). Pony AI relies on a stronger Debt/Equity score (4 vs. 1), indicating lower leverage but lags in profitability and valuation metrics. Uri’s higher ROE and ROA suggest superior operational efficiency, while Pony’s valuation scores remain very unfavorable.
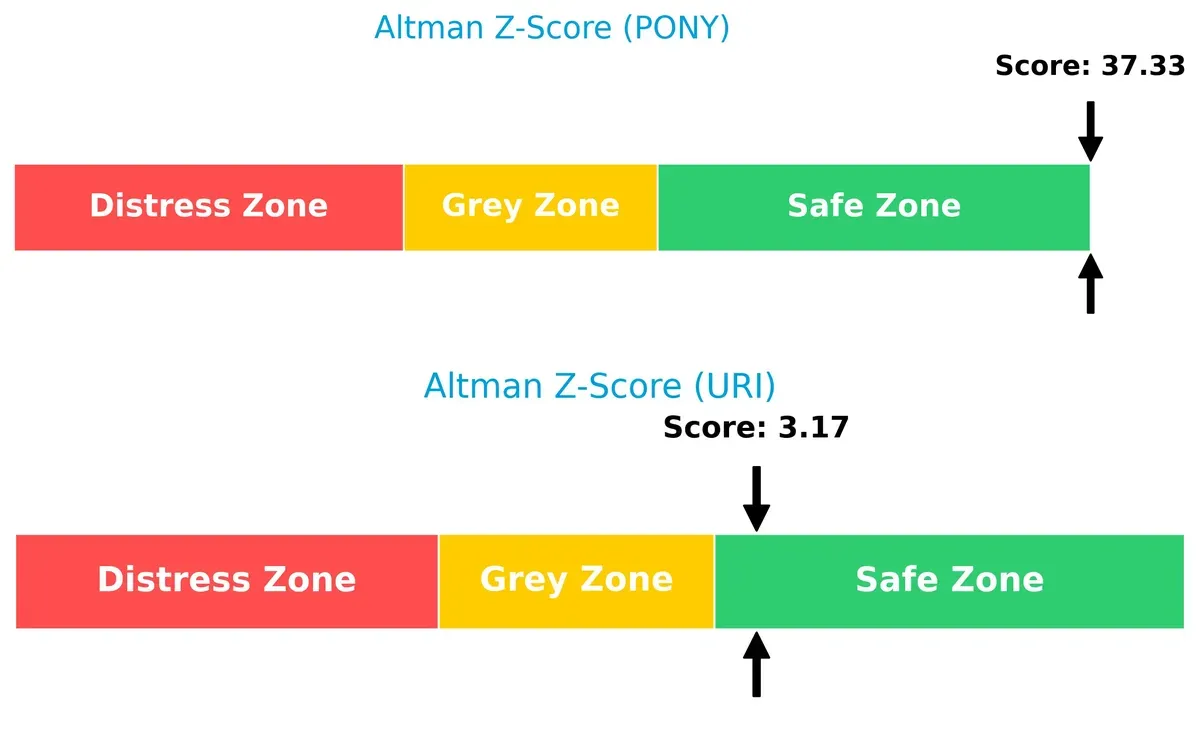
Bankruptcy Risk: Solvency Showdown
The Altman Z-Scores place both companies securely in the safe zone, but Pony AI’s score (37.3) far exceeds United Rentals’ (3.17), signaling vastly stronger solvency and lower bankruptcy risk in this cycle:
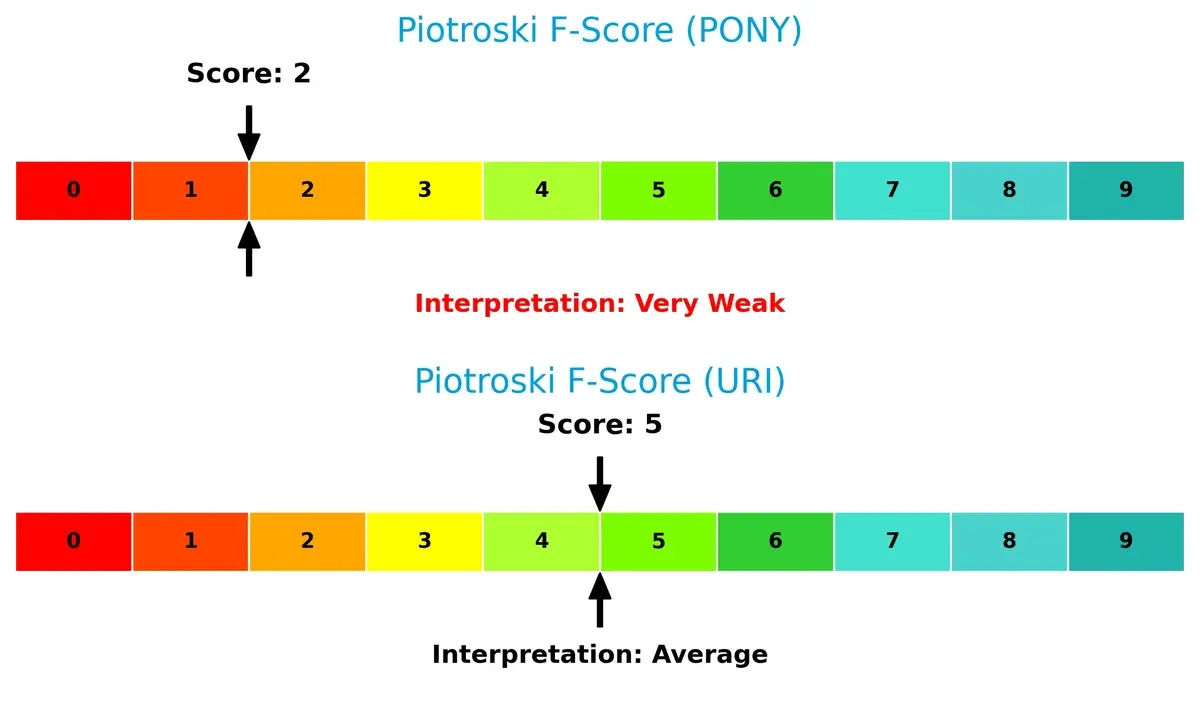
Financial Health: Quality of Operations
United Rentals outperforms Pony AI in Piotroski F-Score, scoring 5 versus 2. This indicates Uri’s internal metrics are healthier, while Pony signals red flags in profitability, leverage, or efficiency:
How are the two companies positioned?
This section dissects Pony AI and United Rentals’ operational DNA by comparing revenue distribution and internal dynamics. The goal is to confront their economic moats to identify which model offers the most resilient competitive advantage today.
Revenue Segmentation: The Strategic Mix
This comparison dissects how Pony AI Inc. and United Rentals diversify their income streams and where their primary sector bets lie:
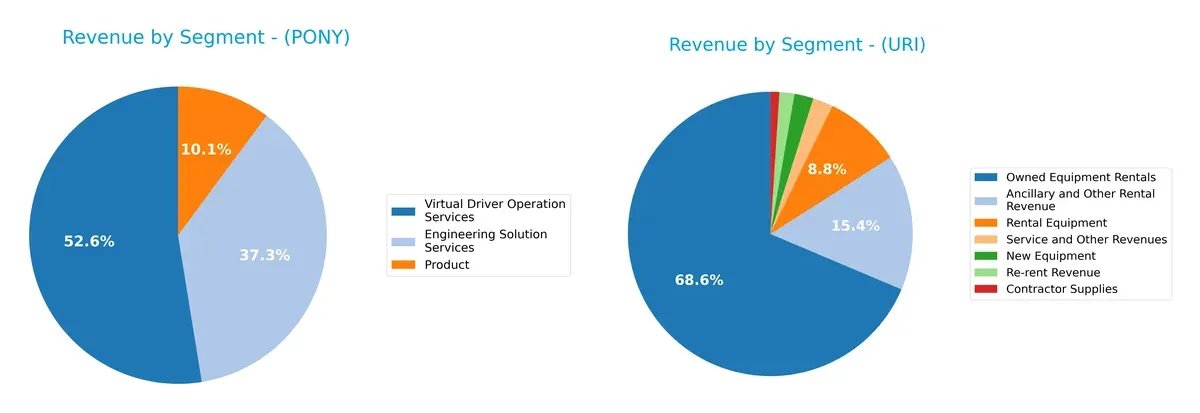
United Rentals anchors its revenue in Owned Equipment Rentals at $10.6B (2024), dwarfing other segments like Rental Equipment ($1.5B) and Service Revenues ($358M). Pony AI’s revenue is more balanced, pivoting between Virtual Driver Operation Services ($39.4M), Engineering Solution Services ($28M), and Product sales ($7.6M). United Rentals’ concentration signals infrastructure dominance but exposes it to equipment market cycles. Pony AI’s diversified tech services reduce concentration risk but face scale challenges.
Strengths and Weaknesses Comparison
This table compares the Strengths and Weaknesses of Pony AI Inc. and United Rentals, Inc.:
PONY Strengths
- Low debt-to-assets at 1.31%
- Very high quick ratio of 11.77 indicates liquidity
- Favorable PE ratio suggests market optimism
URI Strengths
- Strong profitability with 15.49% net margin
- High ROE of 27.81% signals efficient capital use
- Solid interest coverage at 5.66
- Large global presence with US and Non-US revenues
- Diverse revenue streams including rentals, equipment, and services
PONY Weaknesses
- Negative profitability metrics including net margin and ROIC
- Unfavorable WACC at 33.55% raises capital costs
- Extremely low asset turnover of 0.07
- No dividend yield and zero interest coverage
- Overly high current ratio at 11.77 may indicate inefficient asset use
URI Weaknesses
- Low current ratio of 0.94 may challenge short-term liquidity
- High debt-to-assets at 55.17% raises financial risk
- Elevated debt-to-equity at 1.84
- Unfavorable PB ratio at 5.81
- Dividend yield below 1%
Pony AI shows liquidity strengths and low leverage but suffers from severe profitability and efficiency challenges. United Rentals demonstrates robust profitability and global diversification but faces risks from elevated leverage and tight liquidity. These contrasts highlight differing strategic focuses and risk profiles.
The Moat Duel: Analyzing Competitive Defensibility
A structural moat is the only reliable shield protecting long-term profits from relentless competitive erosion. Let’s dissect the moats of Pony AI and United Rentals:
Pony AI Inc.: Emerging Technology Moat
Pony AI’s moat lies in its cutting-edge autonomous vehicle software and robotaxi services. Its financials show negative margins but improving profitability, reflecting early-stage investment. Expansion in AV markets could deepen this moat if operational efficiencies improve in 2026.
United Rentals, Inc.: Scale and Network Moat
United Rentals leverages a massive equipment rental network and broad geographic reach, generating strong margins and steady cash flow. Unlike Pony AI, URI’s moat manifests in consistent ROIC growth and operational scale, positioning it for incremental market share gains and international expansion.
Verdict: Technology Innovation vs. Scale Dominance
United Rentals’ wider moat stems from proven scale economies and margin stability, while Pony AI’s moat remains fragile despite growth potential. URI is better equipped today to defend and expand its market share amid competitive pressures.
Which stock offers better returns?
The past year saw Pony AI Inc. ADS gain modestly with accelerating momentum, while United Rentals, Inc. surged sharply amid high volatility and rising prices.
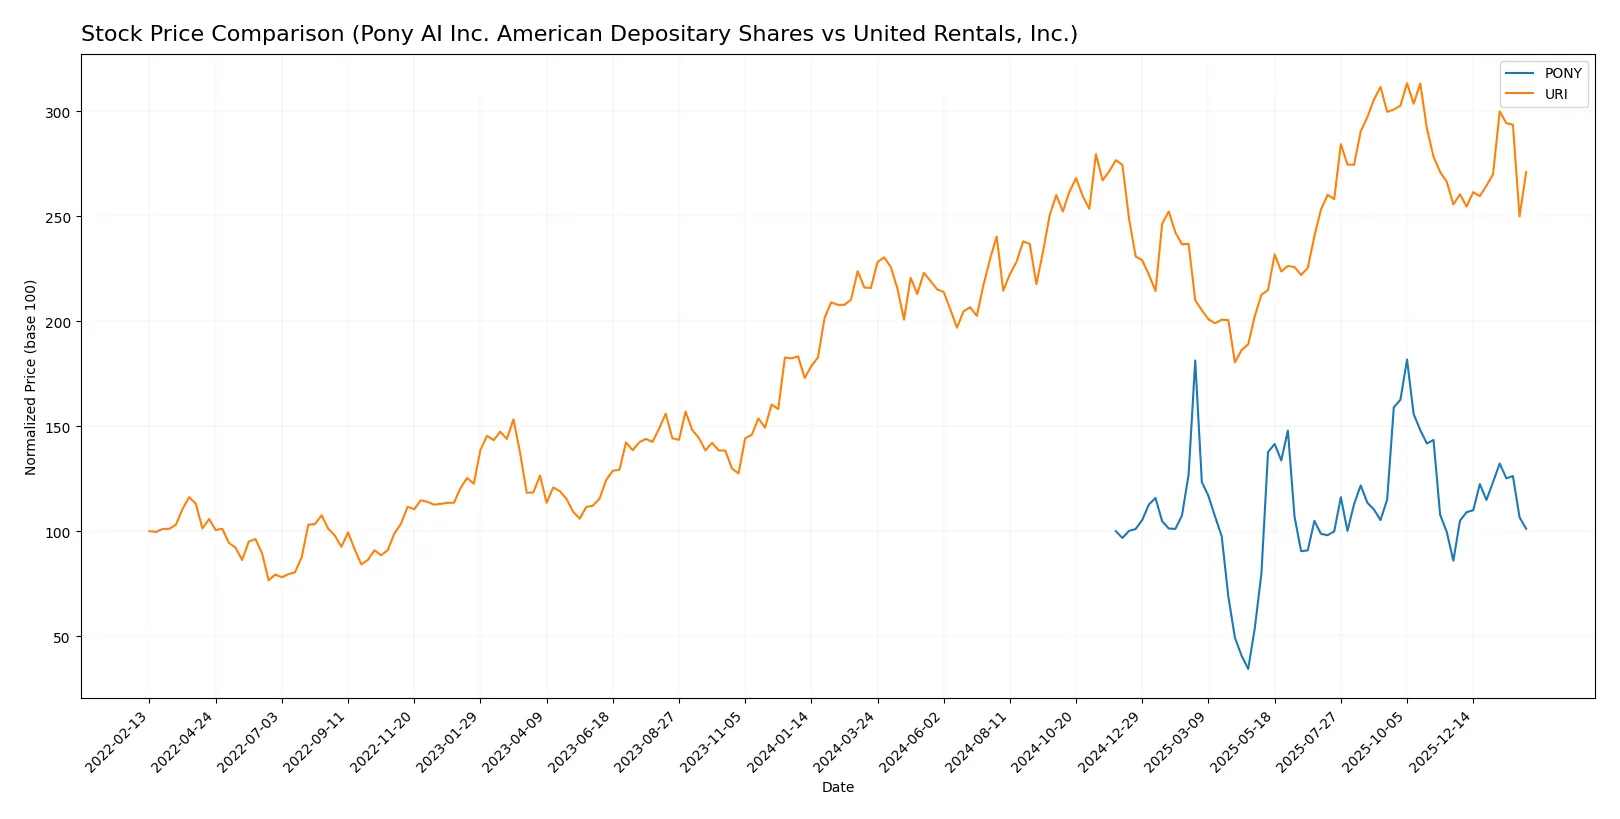
Trend Comparison
Pony AI’s stock rose 1.15% over 12 months, marking a bullish trend with acceleration. The price ranged between 4.48 and 23.67, showing steady gains amid moderate volatility.
United Rentals gained 25.54% in the same period, also bullish with acceleration but accompanied by extreme volatility. Prices spanned from 564.57 to 980.8, reflecting significant upward momentum.
United Rentals clearly outperformed Pony AI, delivering the highest market return with more pronounced price appreciation and volatility.
Target Prices
Analyst consensus projects significant upside potential for both Pony AI Inc. and United Rentals, Inc.
| Company | Target Low | Target High | Consensus |
|---|---|---|---|
| Pony AI Inc. American Depositary Shares | 15 | 32.8 | 25.6 |
| United Rentals, Inc. | 600 | 1071 | 942.9 |
Pony AI’s consensus target of 25.6 sits nearly double its current 13.17 share price, signaling strong growth expectations. United Rentals’ target consensus at 942.9 also exceeds its current 848.13 price, reflecting optimism despite recent valuation strength.

Don’t Let Luck Decide Your Entry Point
Optimize your entry points with our advanced ProRealTime indicators. You’ll get efficient buy signals with precise price targets for maximum performance. Start outperforming now!
How do institutions grade them?
The following tables summarize recent institutional grades for Pony AI Inc. and United Rentals, Inc.:
Pony AI Inc. American Depositary Shares Grades
This table shows the latest grade from a major financial institution for Pony AI Inc.:
| Grading Company | Action | New Grade | Date |
|---|---|---|---|
| Citigroup | Maintain | Buy | 2025-11-07 |
United Rentals, Inc. Grades
These grades reflect broad institutional coverage and recent actions for United Rentals, Inc.:
| Grading Company | Action | New Grade | Date |
|---|---|---|---|
| Citigroup | Maintain | Buy | 2026-02-02 |
| JP Morgan | Maintain | Overweight | 2026-01-30 |
| RBC Capital | Maintain | Outperform | 2026-01-30 |
| Wells Fargo | Maintain | Overweight | 2026-01-23 |
| Citigroup | Maintain | Buy | 2026-01-13 |
| UBS | Upgrade | Buy | 2026-01-05 |
| Truist Securities | Maintain | Buy | 2025-12-18 |
| Citigroup | Maintain | Buy | 2025-12-11 |
| Keybanc | Maintain | Overweight | 2025-12-03 |
| RBC Capital | Maintain | Outperform | 2025-10-24 |
Which company has the best grades?
United Rentals, Inc. has received more frequent and varied positive grades, including upgrades and consistent “Buy,” “Overweight,” and “Outperform” ratings. Pony AI Inc. has a single “Buy” rating. This broader institutional support for United Rentals may suggest higher confidence among analysts, potentially affecting investor perception and demand.
Risks specific to each company
The following categories identify the critical pressure points and systemic threats facing both firms in the 2026 market environment:
1. Market & Competition
Pony AI Inc. American Depositary Shares
- Faces intense competition in autonomous mobility, a fast-evolving tech sector with high innovation demands.
United Rentals, Inc.
- Competes in a mature equipment rental market with strong scale advantages and established customer base.
2. Capital Structure & Debt
Pony AI Inc. American Depositary Shares
- Extremely low debt levels (D/E 0.01) indicate conservative leverage but raise questions about growth capital.
United Rentals, Inc.
- High leverage (D/E 1.84) increases financial risk but supports asset-heavy operations and expansion.
3. Stock Volatility
Pony AI Inc. American Depositary Shares
- Very high beta (6.35) signals extreme price swings and investor uncertainty.
United Rentals, Inc.
- Moderate beta (1.68) reflects typical industrial stock volatility with manageable market risk.
4. Regulatory & Legal
Pony AI Inc. American Depositary Shares
- Operates in China and US, exposing it to complex regulatory frameworks and evolving AV safety standards.
United Rentals, Inc.
- Subject to US and international equipment safety and environmental regulations, relatively stable legal environment.
5. Supply Chain & Operations
Pony AI Inc. American Depositary Shares
- Dependent on cutting-edge technology suppliers and vehicle integration, sensitive to component shortages.
United Rentals, Inc.
- Large, diversified rental fleet and global locations mitigate supply chain disruptions effectively.
6. ESG & Climate Transition
Pony AI Inc. American Depositary Shares
- Autonomous and electric mobility aligns with climate goals but requires heavy R&D investment and regulatory approval.
United Rentals, Inc.
- Faces pressure to reduce emissions from heavy equipment but benefits from gradual fleet electrification trends.
7. Geopolitical Exposure
Pony AI Inc. American Depositary Shares
- High exposure to US-China tensions impacting market access and technology transfer.
United Rentals, Inc.
- Primarily North America and Europe focused, less vulnerable to geopolitical shocks but sensitive to trade policies.
Which company shows a better risk-adjusted profile?
Pony AI’s biggest risk lies in extreme stock volatility and geopolitical exposure, while United Rentals faces leverage and regulatory pressures. URI’s stable market position and safer Altman Z-Score suggest a superior risk-adjusted profile. URI’s robust profitability and asset efficiency contrast sharply with Pony AI’s negative margins and weak financial health, underscoring Uri’s relative resilience.
Final Verdict: Which stock to choose?
Pony AI Inc. stands out with its superpower of ample liquidity and a growing return on invested capital, signaling potential turnaround strength. Its key point of vigilance is persistent negative profitability, reflecting ongoing challenges. Pony fits an aggressive growth portfolio willing to tolerate volatility for future payoff.
United Rentals’ strategic moat lies in its steady operational efficiency and resilient cash flow generation amid capital-intensive operations. Compared to Pony, it offers better income stability but carries higher leverage risk. United Rentals suits GARP investors seeking balanced growth with reasonable risk control.
If you prioritize high-growth potential and can weather near-term losses, Pony AI offers a compelling scenario due to its improving capital efficiency and strong liquidity. However, if you seek more stable earnings and established operational cash flow, United Rentals outshines as the safer choice, despite its leverage concerns. Both present distinct risk-reward profiles aligned with different investor appetites.
Disclaimer: Investment carries a risk of loss of initial capital. The past performance is not a reliable indicator of future results. Be sure to understand risks before making an investment decision.
Go Further
I encourage you to read the complete analyses of Pony AI Inc. American Depositary Shares and United Rentals, Inc. to enhance your investment decisions: