In the evolving landscape of regulated electric utilities, Xcel Energy Inc. (XEL) and Pinnacle West Capital Corporation (PNW) stand out as prominent players. Both companies focus on electricity generation, transmission, and distribution, balancing traditional and renewable energy sources while serving millions of customers. Their overlapping markets and commitment to innovation make them compelling choices for investors seeking stability and growth. Let’s explore which company presents the most attractive investment opportunity today.
Table of contents
Companies Overview
I will begin the comparison between Xcel Energy Inc. and Pinnacle West Capital Corporation by providing an overview of these two companies and their main differences.
Xcel Energy Inc. Overview
Xcel Energy Inc. operates in the regulated electric utility sector, serving approximately 3.7M electricity and 2.1M natural gas customers across several U.S. states. Its mission encompasses generating and distributing electricity through diverse sources including coal, nuclear, natural gas, and renewables. Headquartered in Minneapolis, Xcel focuses on a broad geographic footprint with integrated energy solutions involving natural gas infrastructure and renewable facility development.
Pinnacle West Capital Corporation Overview
Pinnacle West Capital Corporation, through Arizona Public Service, provides retail and wholesale electric services primarily in Arizona. It operates coal, nuclear, gas, oil, and solar generation facilities and maintains extensive transmission and distribution infrastructure. Serving about 1.3M customers, Pinnacle West emphasizes regulated generation and distribution within its localized market. The company is headquartered in Phoenix and focuses on serving its regional customer base efficiently.
Key similarities and differences
Both companies operate in the regulated electric utility industry with a focus on generation, transmission, and distribution of electricity. While Xcel Energy covers multiple states and offers natural gas services alongside electricity, Pinnacle West has a more concentrated regional presence exclusively in Arizona. Xcel’s energy mix is broader and includes additional natural gas infrastructure, whereas Pinnacle West maintains a substantial regulated generation capacity with a strong emphasis on transmission and distribution assets within a single state.
Income Statement Comparison
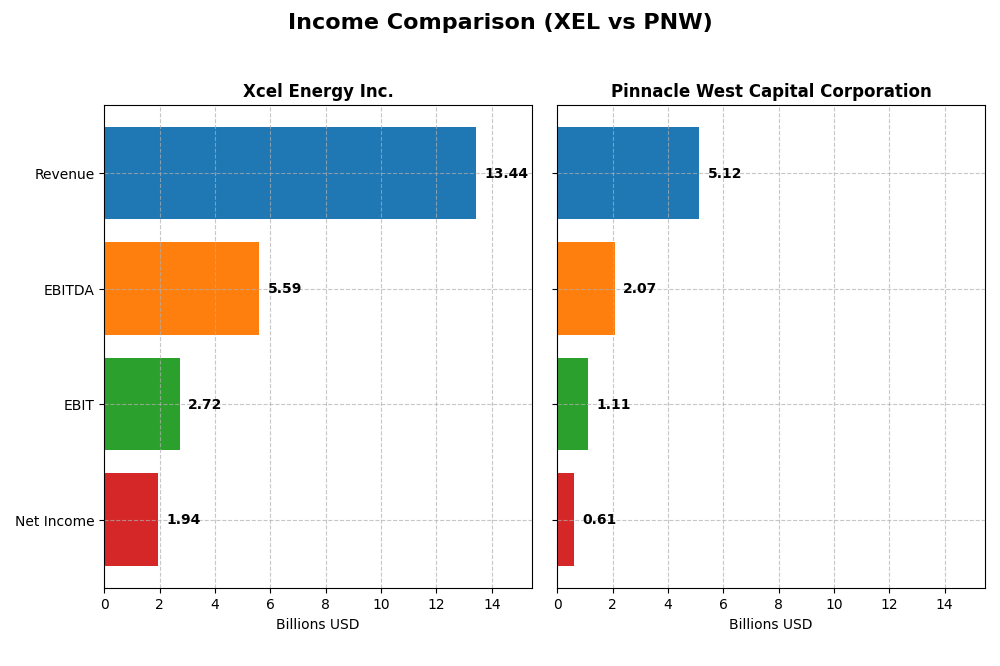
This table compares key income statement metrics for Xcel Energy Inc. and Pinnacle West Capital Corporation for the fiscal year 2024.
| Metric | Xcel Energy Inc. (XEL) | Pinnacle West Capital Corporation (PNW) |
|---|---|---|
| Market Cap | 43.9B | 10.7B |
| Revenue | 13.4B | 5.1B |
| EBITDA | 5.59B | 2.07B |
| EBIT | 2.72B | 1.11B |
| Net Income | 1.94B | 609M |
| EPS | 3.44 | 5.35 |
| Fiscal Year | 2024 | 2024 |
Income Statement Interpretations
Xcel Energy Inc.
Xcel Energy’s revenue showed overall growth of 16.6% from 2020 to 2024, despite a 5.4% decline in 2024. Net income increased 31.4% over the period, with a strong 14.4% net margin in 2024. Margins remained favorable, supported by a 20.2% EBIT margin. The latest year showed slower revenue but improved net margin and EPS growth, indicating efficiency gains amid softer sales.
Pinnacle West Capital Corporation
Pinnacle West’s revenue grew 42.9% from 2020 to 2024, with a 9.1% increase in the last year. Net income rose 10.6% overall, while net margin declined by 22.6% over five years, though it improved 11.2% in 2024 to 11.9%. EBIT margin remained solid at 21.7%. The recent year showed accelerated profit growth and margin expansion despite higher operating expenses relative to revenue growth.
Which one has the stronger fundamentals?
Both companies demonstrate favorable income statement fundamentals with solid margins and profit growth. Xcel Energy shows stronger net income growth and margin expansion over the long term, while Pinnacle West posts higher recent revenue growth and EBIT margin. Pinnacle West’s net margin decline over time contrasts with Xcel’s consistent margin improvement, highlighting nuanced strengths and risks in each firm’s profitability trajectory.
Financial Ratios Comparison
The table below presents the key financial ratios for Xcel Energy Inc. (XEL) and Pinnacle West Capital Corporation (PNW) based on their most recent fiscal year data from 2024.
| Ratios | Xcel Energy Inc. (XEL) | Pinnacle West Capital Corporation (PNW) |
|---|---|---|
| ROE | 9.9% | 9.0% |
| ROIC | 4.6% | 3.5% |
| P/E | 19.6 | 15.9 |
| P/B | 1.95 | 1.43 |
| Current Ratio | 0.67 | 0.59 |
| Quick Ratio | 0.57 | 0.42 |
| D/E | 1.55 | 1.64 |
| Debt-to-Assets | 43.1% | 42.3% |
| Interest Coverage | 2.02 | 2.68 |
| Asset Turnover | 0.19 | 0.20 |
| Fixed Asset Turnover | 0.23 | 0.25 |
| Payout ratio | 60.7% | 64.8% |
| Dividend yield | 3.1% | 4.1% |
Interpretation of the Ratios
Xcel Energy Inc.
Xcel Energy exhibits a mix of strong and weak ratios; net margin at 14.4% and dividend yield of 3.09% are favorable, while return on equity (9.92%) and return on invested capital (4.59%) are unfavorable. Liquidity ratios and asset turnover are also weak points, indicating potential operational inefficiencies. The company pays dividends consistently, supported by a moderate payout ratio, but free cash flow coverage is negative, which could pose risks for sustainability.
Pinnacle West Capital Corporation
Pinnacle West shows favorable net margin (11.88%) and dividend yield (4.09%), with price-to-book ratio also positive. However, return on equity (9.01%), return on invested capital (3.48%), and liquidity ratios are unfavorable, reflecting some financial constraints. Pinnacle West pays a solid dividend, but like its peer, it faces challenges with negative free cash flow coverage, raising concerns about the long-term support for its distributions.
Which one has the best ratios?
Both companies share similar challenges, notably in liquidity and returns on equity and capital. Pinnacle West edges slightly ahead in dividend yield and price-to-book ratio, while Xcel Energy benefits from a stronger net margin. Overall, both have slightly unfavorable global ratio profiles, suggesting a cautious outlook with no clear dominance in ratio strength.
Strategic Positioning
This section compares the strategic positioning of Xcel Energy Inc. and Pinnacle West Capital Corporation, including Market position, Key segments, and Exposure to technological disruption:
Xcel Energy Inc.
- Large US utility with 3.7M electricity and 2.1M gas customers, facing regulated electric competition.
- Diversified segments: Regulated Electric (~$22.3B), Regulated Natural Gas (~$4.5B) driving revenues.
- Uses multiple energy sources including coal, nuclear, gas, solar, hydro, and biomass, mitigating disruption risks.
Pinnacle West Capital Corporation
- Mid-sized regional utility focusing on Arizona with 1.3M electricity customers, regulated electric sector.
- Concentrated on Electric Service (~$2.6B) plus transmission and wholesale energy segments.
- Relies on coal, nuclear, gas, oil, and solar generation, with extensive transmission and distribution infrastructure.
Xcel Energy Inc. vs Pinnacle West Capital Corporation Positioning
Xcel Energy has a diversified portfolio spanning electric and natural gas utilities with broad geographic reach, while Pinnacle West is more concentrated in electric service within Arizona. Xcel’s wider energy mix offers broader business drivers but also complexity compared to Pinnacle West’s focused regional approach.
Which has the best competitive advantage?
Both companies are shedding value as ROIC is below WACC; however, Xcel shows a growing ROIC trend, suggesting improving profitability, whereas Pinnacle West’s declining ROIC indicates worsening financial efficiency and a weaker moat.
Stock Comparison
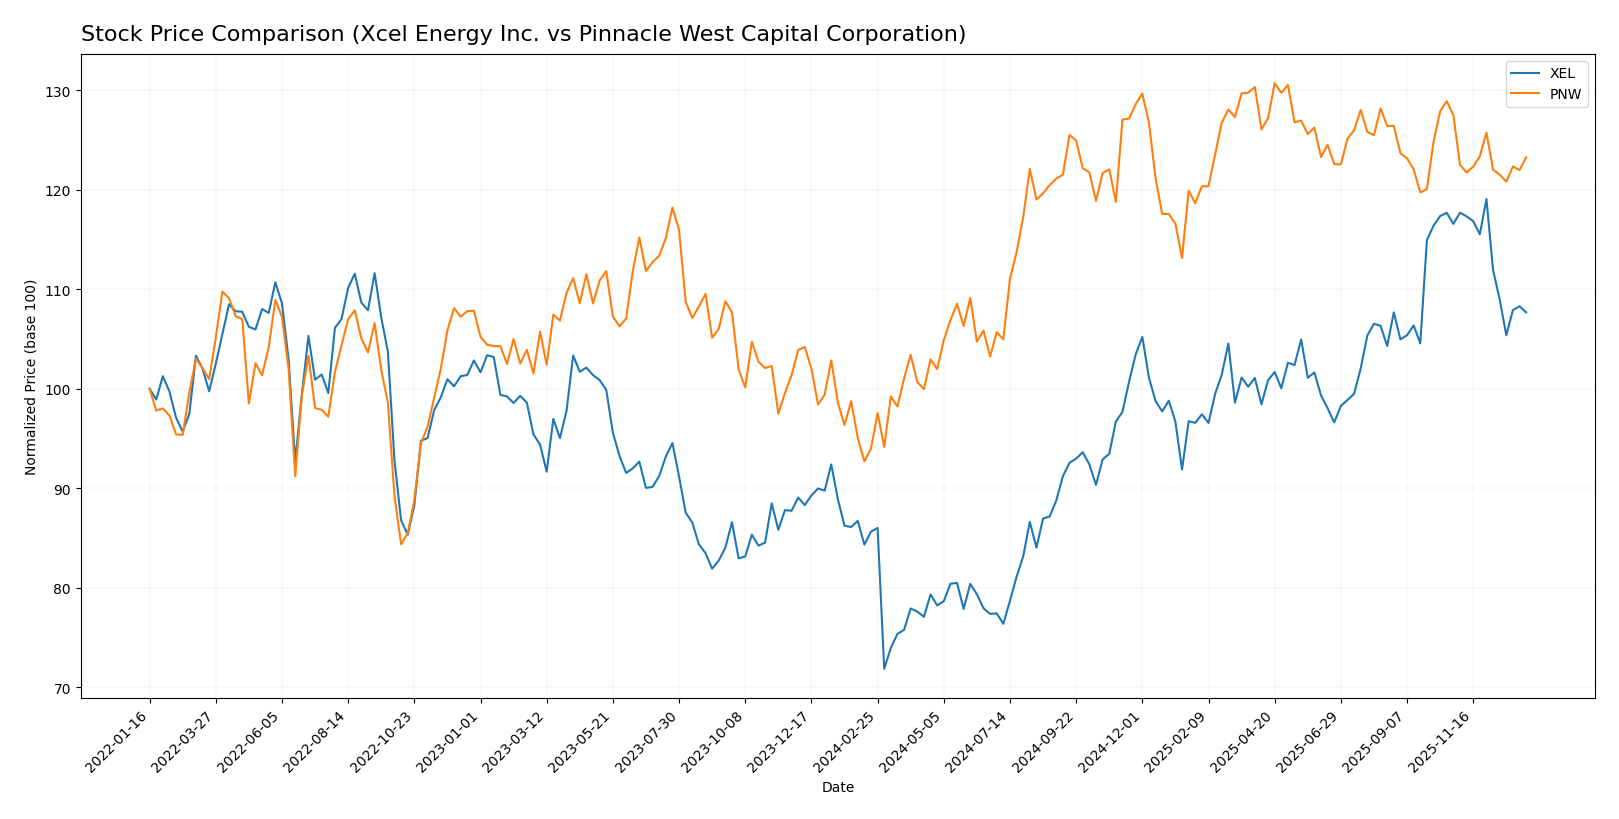
This chart highlights the price movements of Xcel Energy Inc. (XEL) and Pinnacle West Capital Corporation (PNW) over the past 12 months, reflecting key trends and shifts in trading dynamics for both utilities.
Trend Analysis
Xcel Energy Inc. (XEL) exhibited a bullish trend over the past year with a 25.72% price increase and decelerating momentum. The stock ranged between 49.57 and 82.11, with recent months showing a mild downward correction.
Pinnacle West Capital Corporation (PNW) also showed a bullish trend with a 31.14% gain and deceleration in price acceleration. The stock traded between 67.92 and 94.45, experiencing a slight decline in the last quarter.
Comparing both, PNW outperformed XEL with a higher overall price increase of 31.14% versus 25.72%, despite similar deceleration patterns and recent negative corrections.
Target Prices
The current analyst consensus presents a positive outlook for both Xcel Energy Inc. and Pinnacle West Capital Corporation.
| Company | Target High | Target Low | Consensus |
|---|---|---|---|
| Xcel Energy Inc. | 96 | 81 | 87 |
| Pinnacle West Capital Corporation | 115 | 85 | 96.33 |
Analysts expect Xcel Energy’s stock to rise from $74.26 to around $87 on average, indicating moderate upside potential. Pinnacle West’s consensus target of $96.33 also suggests a gain from its current price of $89.07.
Analyst Opinions Comparison
This section compares analysts’ ratings and grades for Xcel Energy Inc. (XEL) and Pinnacle West Capital Corporation (PNW):
Rating Comparison
XEL Rating
- Rating: C+, rated Very Favorable overall by analysts.
- Discounted Cash Flow Score: 4, considered Favorable, indicating strong DCF.
- ROE Score: 3, Moderate status, showing average efficiency in equity returns.
- ROA Score: 2, Moderate status, average asset utilization.
- Debt To Equity Score: 1, Very Unfavorable, indicating high financial risk.
- Overall Score: 2, Moderate, reflecting a middle-ground financial standing.
PNW Rating
- Rating: C+, also rated Very Favorable overall by analysts.
- Discounted Cash Flow Score: 1, considered Very Unfavorable, indicating weak DCF.
- ROE Score: 3, Moderate status, matching XEL’s efficiency in equity returns.
- ROA Score: 3, Moderate status, better asset utilization than XEL.
- Debt To Equity Score: 1, Very Unfavorable, similarly high financial risk.
- Overall Score: 2, Moderate, equal to XEL’s overall financial standing.
Which one is the best rated?
Both XEL and PNW share the same overall rating of C+ and an identical moderate overall score of 2. While XEL shows strength in discounted cash flow, PNW outperforms in return on assets, but both face similar challenges with debt-to-equity ratios.
Scores Comparison
Here is a comparison of the Altman Z-Score and Piotroski Score for the two companies:
XEL Scores
- Altman Z-Score: 0.89, indicating financial distress zone.
- Piotroski Score: 5, reflecting average financial strength.
PNW Scores
- Altman Z-Score: 0.73, indicating financial distress zone.
- Piotroski Score: 4, reflecting average financial strength.
Which company has the best scores?
Based on the provided data, Xcel Energy (XEL) has slightly higher scores than Pinnacle West (PNW) in both Altman Z-Score and Piotroski Score, indicating marginally better financial health.
Grades Comparison
The grades comparison for Xcel Energy Inc. and Pinnacle West Capital Corporation from recognized grading companies is as follows:
Xcel Energy Inc. Grades
The table below summarizes recent grades and rating actions from major financial institutions.
| Grading Company | Action | New Grade | Date |
|---|---|---|---|
| UBS | Maintain | Neutral | 2025-12-17 |
| Keybanc | Maintain | Overweight | 2025-12-12 |
| JP Morgan | Maintain | Overweight | 2025-12-11 |
| Barclays | Maintain | Overweight | 2025-11-05 |
| Citigroup | Maintain | Buy | 2025-11-03 |
| UBS | Maintain | Neutral | 2025-10-31 |
| Mizuho | Maintain | Outperform | 2025-10-27 |
| Jefferies | Maintain | Buy | 2025-10-16 |
| Keybanc | Maintain | Overweight | 2025-10-15 |
| BMO Capital | Maintain | Outperform | 2025-10-15 |
Overall, Xcel Energy’s grades show a strong tendency toward buy and outperform ratings, with multiple institutions maintaining positive outlooks.
Pinnacle West Capital Corporation Grades
Below are the recent grades and rating changes from established grading companies.
| Grading Company | Action | New Grade | Date |
|---|---|---|---|
| UBS | Maintain | Neutral | 2025-12-17 |
| Keybanc | Downgrade | Sector Weight | 2025-12-12 |
| Keybanc | Maintain | Overweight | 2025-10-15 |
| UBS | Maintain | Neutral | 2025-10-10 |
| Barclays | Maintain | Equal Weight | 2025-10-07 |
| Argus Research | Maintain | Buy | 2025-09-30 |
| Morgan Stanley | Maintain | Equal Weight | 2025-09-25 |
| UBS | Maintain | Neutral | 2025-09-12 |
| Mizuho | Downgrade | Neutral | 2025-09-09 |
| Barclays | Maintain | Equal Weight | 2025-08-13 |
Pinnacle West Capital shows a mixed pattern with several neutral and equal weight ratings and some recent downgrades, indicating a more cautious consensus.
Which company has the best grades?
Xcel Energy Inc. has received generally more favorable grades, with numerous buy and outperform ratings, while Pinnacle West Capital Corporation’s grades are more neutral and include downgrades. This suggests a stronger market confidence in Xcel Energy, potentially indicating better growth or stability prospects for investors.
Strengths and Weaknesses
Below is a comparison of key strengths and weaknesses for Xcel Energy Inc. (XEL) and Pinnacle West Capital Corporation (PNW) based on the latest financial performance and market data.
| Criterion | Xcel Energy Inc. (XEL) | Pinnacle West Capital Corporation (PNW) |
|---|---|---|
| Diversification | High diversification with $22.3B in regulated electric and $4.5B in natural gas revenues | Moderate diversification, primarily electric service with $2.56B and smaller segments |
| Profitability | Moderate net margin of 14.4%, but ROIC (4.59%) below WACC (5.1%) indicates slight value destruction | Net margin 11.9%, ROIC (3.48%) also below WACC (4.68%), showing stronger value destruction |
| Innovation | Growing ROIC trend (+10%) suggests improving operational efficiency | Declining ROIC trend (-5.1%) indicates weakening profitability and innovation challenges |
| Global presence | Primarily US-regulated utility, limited global exposure | Focused on US regional market, limited international presence |
| Market Share | Large market share in regulated electric and gas sectors in key US regions | Smaller market share concentrated in electric service within its operating territory |
Key takeaways: Xcel Energy shows stronger diversification and an improving profitability trend despite slightly unfavorable returns on capital. Pinnacle West faces more pronounced profitability challenges and a declining ROIC trend, indicating higher risk for value erosion. Both companies have solid market positions but limited global reach.
Risk Analysis
The table below summarizes key risk factors for Xcel Energy Inc. (XEL) and Pinnacle West Capital Corporation (PNW) as of 2024, highlighting market, financial, regulatory, operational, environmental, and geopolitical risks.
| Metric | Xcel Energy Inc. (XEL) | Pinnacle West Capital Corp. (PNW) |
|---|---|---|
| Market Risk | Low beta (0.47) reduces volatility risk | Low beta (0.54) reduces volatility risk |
| Debt Level | High debt-to-equity (1.55), moderate interest coverage (2.3) | High debt-to-equity (1.64), moderate interest coverage (2.95) |
| Regulatory Risk | Significant in multi-state operations with varied regulations | Concentrated regulatory exposure in Arizona |
| Operational Risk | Complex generation mix with coal, nuclear, gas, renewables | Large transmission and distribution network, aging infrastructure risk |
| Environmental Risk | Transition to renewables ongoing; coal usage still relevant | Similar energy mix; regulatory pressure to reduce emissions |
| Geopolitical Risk | Moderate; US-based but exposed to regional policy changes | Moderate; primarily Arizona-focused, sensitive to state-level policies |
Both companies face considerable financial risk due to high leverage and moderate interest coverage, increasing vulnerability to rising interest rates. Regulatory risk is notable given the utilities’ reliance on state and federal policy, especially regarding environmental standards. The Altman Z-scores place both firms in the distress zone, signaling potential financial stress, while Piotroski scores are average, reflecting moderate financial health. Investors should weigh these risks carefully against dividend yields and market stability.
Which Stock to Choose?
Xcel Energy Inc. (XEL) shows a favorable income statement with a 14.4% net margin and positive growth in earnings per share over 2020-2024. However, its financial ratios are slightly unfavorable overall, reflecting moderate profitability, significant debt, and a current ratio below 1. The company’s rating is very favorable with a C+ grade, though some valuation metrics are weak. Its economic moat is slightly unfavorable due to value destruction despite growing ROIC.
Pinnacle West Capital Corporation (PNW) exhibits favorable income growth and a stable net margin of 11.88%, alongside a stronger improvement in revenue over the past five years. Its financial ratios are also slightly unfavorable, showing moderate profitability, debt levels similar to XEL, but a somewhat better price-to-book ratio. PNW holds a very favorable C+ rating but with a very unfavorable discounted cash flow score. Its economic moat is very unfavorable, marked by declining ROIC and value destruction.
For investors, XEL might appear more attractive for those focused on improving profitability despite its debt and liquidity concerns, while PNW could be seen as fitting investors valuing stronger revenue growth but facing declining capital efficiency. The choice might depend on whether the investor prioritizes earnings quality and growing returns or revenue expansion with caution on profitability trends.
Disclaimer: Investment carries a risk of loss of initial capital. The past performance is not a reliable indicator of future results. Be sure to understand risks before making an investment decision.
Go Further
I encourage you to read the complete analyses of Xcel Energy Inc. and Pinnacle West Capital Corporation to enhance your investment decisions: