In today’s evolving energy landscape, choosing the right utility stock requires careful analysis. WEC Energy Group, Inc. and Pinnacle West Capital Corporation both operate in the regulated electric industry, serving millions of customers while balancing traditional and renewable energy sources. Their overlapping markets and innovation strategies make them compelling peers for comparison. Join me as we explore which company presents the most attractive opportunity for your investment portfolio.
Table of contents
Companies Overview
I will begin the comparison between WEC Energy Group and Pinnacle West Capital Corporation by providing an overview of these two companies and their main differences.
WEC Overview
WEC Energy Group, Inc. operates in the regulated electric industry, providing natural gas, electricity, and renewable energy services in the U.S. The company manages six segments covering multiple states and energy infrastructure types. WEC generates power from coal, natural gas, oil, hydroelectric, wind, solar, and biomass sources, serving a broad customer base with extensive transmission and distribution networks headquartered in Milwaukee, Wisconsin.
PNW Overview
Pinnacle West Capital Corporation, through its subsidiary Arizona Public Service Company, supplies retail and wholesale electric services mainly in Arizona. It generates electricity using coal, nuclear, gas, oil, and solar facilities, maintaining significant transmission and distribution infrastructure. The company serves approximately 1.3 million customers and owns or leases 6,323 MW of regulated generation capacity, with headquarters in Phoenix, Arizona.
Key similarities and differences
Both WEC and Pinnacle West operate in the regulated electric utilities sector, focusing on electricity generation, transmission, and distribution using diverse energy sources including renewables. WEC has a broader geographic reach, operating in multiple states, whereas Pinnacle West concentrates primarily in Arizona. Additionally, WEC’s infrastructure is larger in scale compared to Pinnacle West, reflecting differences in market size and operational scope.
Income Statement Comparison
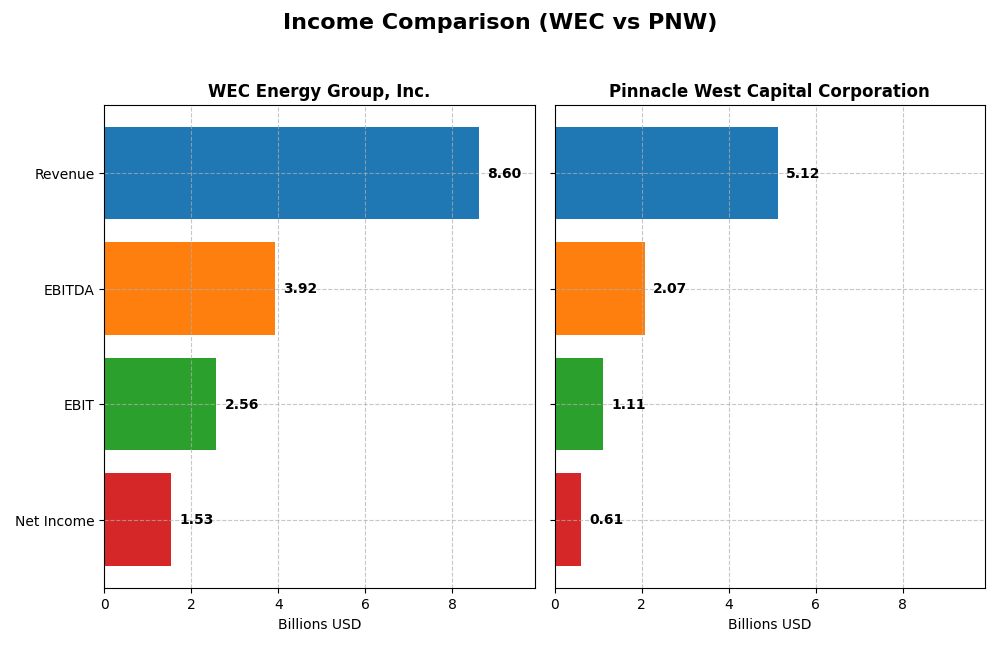
The table below compares key income statement metrics of WEC Energy Group, Inc. and Pinnacle West Capital Corporation for the fiscal year 2024.
| Metric | WEC Energy Group, Inc. | Pinnacle West Capital Corporation |
|---|---|---|
| Market Cap | 33.5B | 10.7B |
| Revenue | 8.6B | 5.1B |
| EBITDA | 3.9B | 2.1B |
| EBIT | 2.6B | 1.1B |
| Net Income | 1.5B | 609M |
| EPS | 4.81 | 5.35 |
| Fiscal Year | 2024 | 2024 |
Income Statement Interpretations
WEC Energy Group, Inc.
WEC Energy Group’s revenue showed an overall upward trend from 2020 to 2024, increasing by 18.76% over the period, though it declined by 3.3% in the most recent year. Net income grew steadily to $1.53B in 2024, a 27.25% rise overall with an 18.58% increase last year. Margins improved, with a favorable gross margin of 44.02% and net margin of 17.77%. The 2024 performance reflected margin expansion and solid EBIT growth despite softer revenue.
Pinnacle West Capital Corporation
Pinnacle West’s revenue increased by 42.88% from 2020 to 2024, with a strong 9.13% rise in 2024 alone. Net income grew modestly by 10.58% over the period, reaching $609M in 2024, up 21.3% year-over-year. Gross margin stood favorably at 41.7%, though net margin was lower at 11.88%, declining overall by 22.6%. The latest year showed robust EBIT and EPS growth, offset partially by margin compression and less efficient expense control.
Which one has the stronger fundamentals?
Both companies present favorable income statements with strong revenue and net income growth. WEC Energy Group demonstrates superior margin stability and more consistent net margin expansion, while Pinnacle West excels in revenue growth but faces challenges in net margin contraction. WEC’s overall margin strength contrasts with Pinnacle West’s higher top-line growth but weaker profitability trends, suggesting differing fundamental profiles.
Financial Ratios Comparison
The table below presents a side-by-side comparison of key financial ratios for WEC Energy Group, Inc. and Pinnacle West Capital Corporation based on their most recent fiscal year data for 2024.
| Ratios | WEC Energy Group, Inc. | Pinnacle West Capital Corporation |
|---|---|---|
| ROE | 12.3% | 9.0% |
| ROIC | 4.1% | 3.5% |
| P/E | 19.5 | 15.9 |
| P/B | 2.39 | 1.43 |
| Current Ratio | 0.60 | 0.59 |
| Quick Ratio | 0.43 | 0.42 |
| D/E | 1.64 | 1.64 |
| Debt-to-Assets | 42.9% | 42.3% |
| Interest Coverage | 2.64 | 2.68 |
| Asset Turnover | 0.18 | 0.20 |
| Fixed Asset Turnover | 0.25 | 0.25 |
| Payout Ratio | 69.1% | 64.8% |
| Dividend Yield | 3.55% | 4.09% |
Interpretation of the Ratios
WEC Energy Group, Inc.
WEC shows a mixed ratio profile with strong net margin (17.77%, favorable) and dividend yield (3.55%, favorable), but weak liquidity ratios (current ratio 0.6, quick ratio 0.43) and leverage (debt-to-equity 1.64, unfavorable). Return on equity is neutral at 12.3%, while return on invested capital is low at 4.14%. The company pays dividends with a stable yield, supported by moderate payout risks.
Pinnacle West Capital Corporation
Pinnacle West has a favorable net margin (11.88%) and dividend yield (4.09%) but weaker profitability metrics like ROE (9.01%) and ROIC (3.48%), both unfavorable. Liquidity ratios are low (current 0.59, quick 0.42), and leverage is similarly high (debt-to-equity 1.64). The company maintains dividend payments with a relatively higher yield but faces challenges in operational efficiency.
Which one has the best ratios?
Both companies exhibit slightly unfavorable overall ratio evaluations, with Pinnacle West showing a higher proportion of unfavorable ratios (50%) compared to WEC (42.86%). WEC’s stronger net margin and ROE contrast with Pinnacle West’s better price-to-book ratio. Neither company demonstrates robust liquidity or leverage metrics, indicating caution in assessing financial health.
Strategic Positioning
This section compares the strategic positioning of WEC Energy Group, Inc. and Pinnacle West Capital Corporation in terms of market position, key segments, and exposure to technological disruption:
WEC Energy Group, Inc.
- Large market cap of 33.5B with broad competitive pressures in regulated electric utilities.
- Diversified revenue streams across Wisconsin, Illinois, other states, and non-utility energy infrastructure.
- Operates with multiple energy sources including renewables, providing moderate exposure to technological shifts.
Pinnacle West Capital Corporation
- Smaller market cap of 10.7B, focused on Arizona’s regulated electric market.
- Revenue mainly from electric service, transmission, and wholesale energy in Arizona.
- Uses coal, nuclear, gas, oil, and solar, with limited diversification in technology exposure.
WEC Energy Group, Inc. vs Pinnacle West Capital Corporation Positioning
WEC pursues a diversified multi-state business model with significant non-utility infrastructure, offering broader revenue bases but potentially higher complexity. Pinnacle West concentrates on a single state, focusing on regulated electric services with simpler operational scope but less diversification.
Which has the best competitive advantage?
Both companies are currently shedding value with ROIC below WACC. WEC shows a slightly unfavorable moat with improving profitability, while Pinnacle West faces a very unfavorable moat with declining returns and profitability.
Stock Comparison
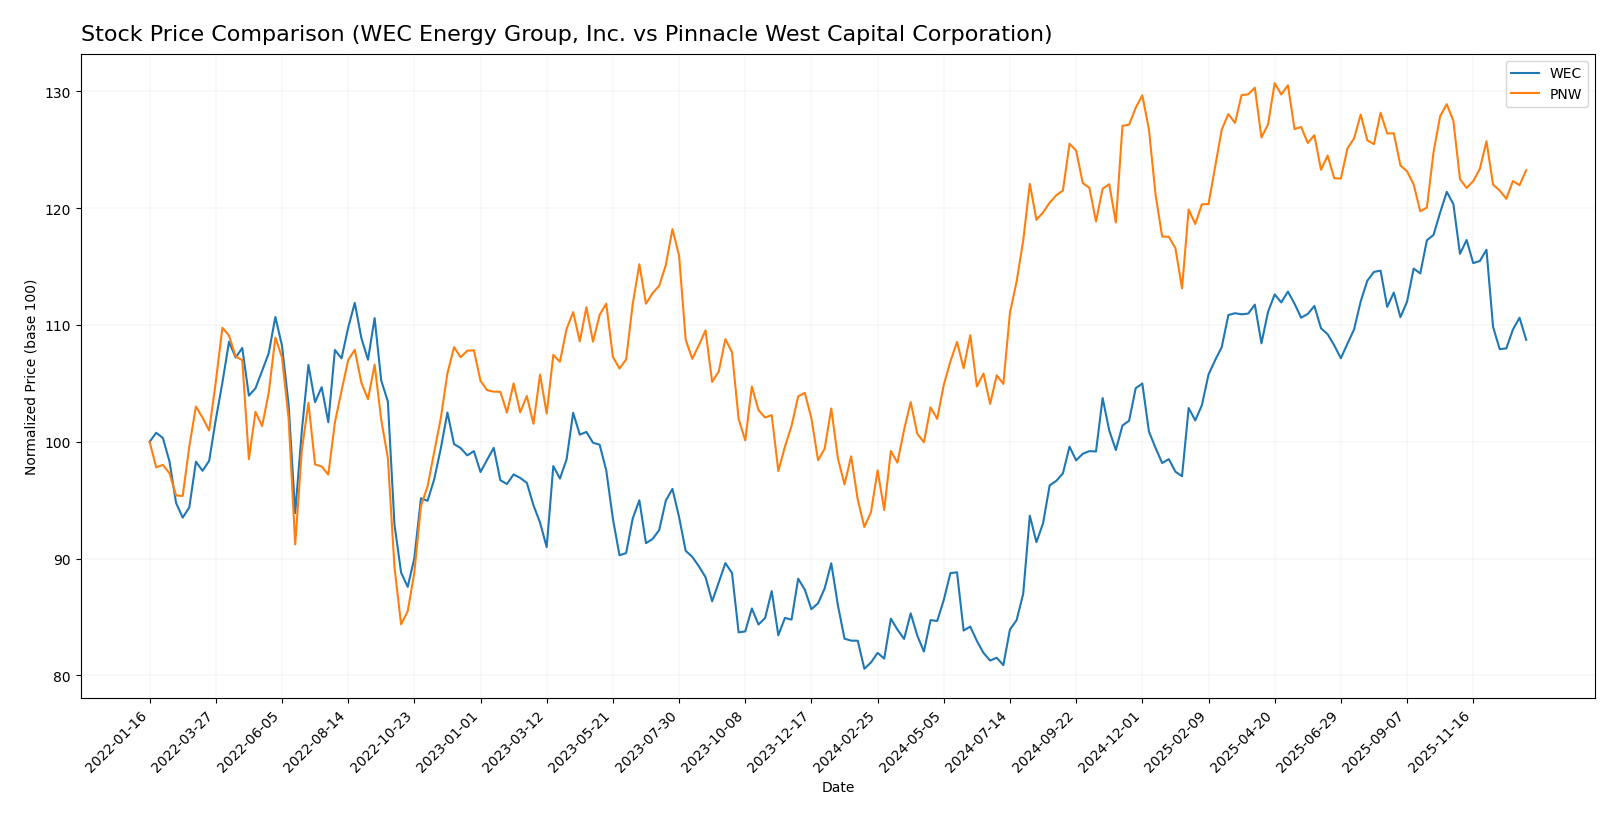
The 12-month stock price movements of WEC Energy Group, Inc. and Pinnacle West Capital Corporation reveal sustained bullish trends with overall gains above 30%, though both have experienced recent downward adjustments signaling short-term deceleration.
Trend Analysis
WEC Energy Group, Inc. recorded a 34.05% price increase over the past year, indicating a bullish trend with decelerating momentum. The stock ranged between 77.85 and 116.84, with notable volatility (std deviation 11.44). Recent weeks show a -9.65% decline, signaling a short-term bearish correction.
Pinnacle West Capital Corporation’s stock rose by 31.14% over the same period, also bullish but with deceleration. Its price fluctuated between 67.92 and 94.45, exhibiting lower volatility (std deviation 6.87). The last quarter saw a -3.31% decrease, reflecting a mild bearish phase.
Comparing the two, WEC delivered the highest overall market performance with a 34.05% gain versus PNW’s 31.14%, despite both showing recent short-term declines.
Target Prices
Analysts present a solid target price consensus for WEC Energy Group, Inc. and Pinnacle West Capital Corporation, reflecting moderate upside potential.
| Company | Target High | Target Low | Consensus |
|---|---|---|---|
| WEC Energy Group, Inc. | 136 | 105 | 122.67 |
| Pinnacle West Capital Corporation | 115 | 85 | 96.33 |
For WEC, the consensus target price of 122.67 is roughly 17% above the current price of 104.65, indicating moderate growth expectations. Pinnacle West’s consensus target of 96.33 suggests a potential upside of about 8% from its current price near 89.07.
Analyst Opinions Comparison
This section compares analysts’ ratings and grades for WEC Energy Group, Inc. and Pinnacle West Capital Corporation:
Rating Comparison
WEC Rating
- Rating: B- indicating a very favorable overall rating.
- Discounted Cash Flow Score: 1, rated very unfavorable, suggesting poor DCF.
- ROE Score: 4, favorable, showing strong efficiency in generating profit.
- ROA Score: 4, favorable, indicating effective asset utilization.
- Debt To Equity Score: 2, moderate, reflecting balanced financial risk.
- Overall Score: 3, moderate overall financial standing.
PNW Rating
- Rating: C+ also indicating a very favorable overall rating.
- Discounted Cash Flow Score: 1, very unfavorable, similar DCF valuation.
- ROE Score: 3, moderate, indicating average efficiency in profit generation.
- ROA Score: 3, moderate, showing average asset utilization.
- Debt To Equity Score: 1, very unfavorable, indicating higher financial risk.
- Overall Score: 2, moderate but lower than WEC’s overall score.
Which one is the best rated?
Based strictly on the provided data, WEC holds a better rating overall, with more favorable ROE and ROA scores and a higher overall score than PNW. Despite both having very unfavorable discounted cash flow scores, WEC’s moderate debt-to-equity score contrasts with PNW’s very unfavorable rating, making WEC the better-rated company here.
Scores Comparison
Here is a comparison of the key financial scores for WEC and PNW:
WEC Scores
- Altman Z-Score: 1.14, indicating financial distress risk in the distress zone.
- Piotroski Score: 6, reflecting average financial strength and investment quality.
PNW Scores
- Altman Z-Score: 0.73, indicating higher financial distress risk in the distress zone.
- Piotroski Score: 4, reflecting average but weaker financial strength than WEC.
Which company has the best scores?
Based on the provided data, WEC has higher Altman Z-Score and Piotroski Score values than PNW. Both companies are in the distress zone, but WEC shows relatively stronger financial health and investment quality compared to PNW.
Grades Comparison
The comparison of grades for WEC Energy Group, Inc. and Pinnacle West Capital Corporation is as follows:
WEC Energy Group, Inc. Grades
This table summarizes recent grades and rating actions from major grading companies for WEC Energy Group, Inc.
| Grading Company | Action | New Grade | Date |
|---|---|---|---|
| B of A Securities | Maintain | Neutral | 2025-12-31 |
| UBS | Maintain | Neutral | 2025-12-17 |
| Barclays | Maintain | Underweight | 2025-12-16 |
| Keybanc | Maintain | Overweight | 2025-12-12 |
| JP Morgan | Maintain | Neutral | 2025-12-11 |
| Scotiabank | Maintain | Sector Outperform | 2025-10-31 |
| BMO Capital | Maintain | Market Perform | 2025-10-21 |
| Barclays | Maintain | Equal Weight | 2025-10-21 |
| Keybanc | Maintain | Overweight | 2025-10-15 |
| UBS | Maintain | Neutral | 2025-10-10 |
WEC Energy’s grades show a mixed but mostly neutral to slightly positive stance with repeated maintenance of ratings and a few Overweight and Sector Outperform mentions.
Pinnacle West Capital Corporation Grades
This table shows recent grading actions from recognized firms for Pinnacle West Capital Corporation.
| Grading Company | Action | New Grade | Date |
|---|---|---|---|
| UBS | Maintain | Neutral | 2025-12-17 |
| Keybanc | Downgrade | Sector Weight | 2025-12-12 |
| Keybanc | Maintain | Overweight | 2025-10-15 |
| UBS | Maintain | Neutral | 2025-10-10 |
| Barclays | Maintain | Equal Weight | 2025-10-07 |
| Argus Research | Maintain | Buy | 2025-09-30 |
| Morgan Stanley | Maintain | Equal Weight | 2025-09-25 |
| UBS | Maintain | Neutral | 2025-09-12 |
| Mizuho | Downgrade | Neutral | 2025-09-09 |
| Barclays | Maintain | Equal Weight | 2025-08-13 |
Pinnacle West Capital Corporation’s grades reflect generally neutral to moderate buy sentiment, with some downgrades from Overweight to Sector Weight and from Outperform to Neutral.
Which company has the best grades?
Both companies have an overall consensus of “Hold,” but WEC Energy Group, Inc. has slightly more positive ratings such as Overweight and Sector Outperform, while Pinnacle West Capital shows more downgrades and fewer buy ratings. This difference may indicate more confidence from analysts in WEC’s near-term prospects compared to Pinnacle West.
Strengths and Weaknesses
Below is a comparison of WEC Energy Group, Inc. (WEC) and Pinnacle West Capital Corporation (PNW) based on diversification, profitability, innovation, global presence, and market share using the most recent data.
| Criterion | WEC Energy Group, Inc. (WEC) | Pinnacle West Capital Corporation (PNW) |
|---|---|---|
| Diversification | Moderate: Revenue mainly from Wisconsin (6.33B) and Illinois (1.60B) plus Non-Utility Energy Infrastructure (691M) | Limited: Primarily electric services (2.56B) with smaller transmission and wholesale segments |
| Profitability | Net margin 17.77% (favorable); ROIC 4.14% (unfavorable, below WACC 5.3%) with growing ROIC trend | Net margin 11.88% (favorable); ROIC 3.48% (unfavorable, below WACC 4.68%) with declining ROIC trend |
| Innovation | Moderate investment in non-utility energy infrastructure | Limited innovation focus indicated; traditional utility services dominate |
| Global presence | Regional US focus: Wisconsin, Illinois, and other states | Regional US focus mainly in Arizona with limited geographic diversification |
| Market Share | Strong regional utility player with stable dividend yield 3.55% | Regional utility with dividend yield 4.09% but declining profitability and market challenges |
Key takeaways: WEC shows better profitability trends with a growing ROIC despite currently shedding value, benefiting from revenue diversification within key states and infrastructure. PNW faces profitability pressure with declining ROIC and less diversification. Both companies are regionally focused utilities with limited innovation but offer stable dividends. Caution is advised due to unfavorable ROIC relative to cost of capital in both cases.
Risk Analysis
Below is a summary table of key risks for WEC Energy Group, Inc. (WEC) and Pinnacle West Capital Corporation (PNW) based on their latest 2024 financial and operational data:
| Metric | WEC Energy Group, Inc. (WEC) | Pinnacle West Capital Corporation (PNW) |
|---|---|---|
| Market Risk | Moderate (Beta 0.573) | Moderate (Beta 0.543) |
| Debt Level | High (D/E 1.64, interest coverage 3.14) | High (D/E 1.64, interest coverage 2.95) |
| Regulatory Risk | Elevated (regulated utility sector) | Elevated (regulated utility sector) |
| Operational Risk | Moderate (aging infrastructure, asset turnover low) | Moderate (asset turnover low, infrastructure maintenance) |
| Environmental Risk | Increasing (coal and gas reliance, transition pressures) | Increasing (coal, nuclear, and gas mix, clean energy transition) |
| Geopolitical Risk | Low (US domestic operations) | Low (US domestic operations) |
The most impactful risks for both companies are their high debt levels combined with moderate interest coverage ratios, which may constrain financial flexibility. Regulatory and environmental risks remain significant given evolving clean energy mandates and infrastructure investment needs. Both firms are in the distress zone per Altman Z-Score, signaling financial vulnerability that investors should monitor closely.
Which Stock to Choose?
WEC Energy Group, Inc. shows a generally favorable income statement with strong gross and net margins, and positive growth over 2020-2024. Its financial ratios reveal mixed signals, with favorable net margin and dividend yield but unfavorable leverage and liquidity ratios. The company displays a slightly unfavorable moat due to ROIC below WACC but a growing profitability trend. Its rating is very favorable (B-), supported by solid ROE and ROA scores despite moderate overall scores.
Pinnacle West Capital Corporation exhibits favorable income growth and margins, though net margin growth is negative over the longer term. Financial ratios indicate some strengths like a favorable price-to-book ratio and dividend yield, but several unfavorable metrics in leverage and liquidity persist. The company has a very unfavorable moat with declining ROIC below WACC. Its rating is very favorable (C+), though with moderate scores and weaker debt management compared to WEC.
For investors prioritizing income statement strength and improving profitability, WEC might appear more attractive, while those valuing a lower price-to-book ratio and stable dividend yield could find Pinnacle West appealing. Risk-averse investors might note the unfavorable leverage and liquidity of both, with WEC showing a more positive ROIC trend, whereas Pinnacle West’s declining ROIC suggests caution.
Disclaimer: Investment carries a risk of loss of initial capital. The past performance is not a reliable indicator of future results. Be sure to understand risks before making an investment decision.
Go Further
I encourage you to read the complete analyses of WEC Energy Group, Inc. and Pinnacle West Capital Corporation to enhance your investment decisions: