Public Service Enterprise Group Incorporated (PEG) and Pinnacle West Capital Corporation (PNW) are two key players in the regulated electric utility sector, serving distinct but overlapping markets in the United States. Both companies emphasize innovation in energy generation and distribution, including investments in solar power and infrastructure upgrades. This comparison will help investors understand which company offers a more attractive opportunity in a dynamic and evolving energy landscape. Let’s explore which stock deserves a spot in your portfolio.
Table of contents
Companies Overview
I will begin the comparison between Public Service Enterprise Group Incorporated and Pinnacle West Capital Corporation by providing an overview of these two companies and their main differences.
Public Service Enterprise Group Incorporated Overview
Public Service Enterprise Group Incorporated (PEG) operates primarily in the Northeastern and Mid-Atlantic United States, focusing on regulated electric utilities. It provides electricity transmission and distribution, gas services, and invests in solar generation and energy efficiency programs. With a large infrastructure including 25,000 circuit miles of electric transmission and 18,000 miles of gas mains, PEG serves residential, commercial, and industrial customers.
Pinnacle West Capital Corporation Overview
Pinnacle West Capital Corporation (PNW), through its subsidiary Arizona Public Service Company, provides retail and wholesale electric services mainly in Arizona. It engages in electricity generation, transmission, and distribution using a diverse mix of coal, nuclear, gas, oil, and solar facilities. PNW operates extensive transmission and distribution lines and serves around 1.3 million customers with a regulated generation capacity of approximately 6,323 MW.
Key similarities and differences
Both PEG and PNW operate in the regulated electric utilities industry and focus on electricity generation, transmission, and distribution. PEG has a broader geographic footprint in the Northeastern U.S., while PNW is concentrated in Arizona. PEG’s infrastructure is larger in terms of transmission miles and gas distribution, whereas PNW has a more diversified energy mix including nuclear and oil. Employee count and market capitalization also differ, with PEG being the larger entity.
Income Statement Comparison
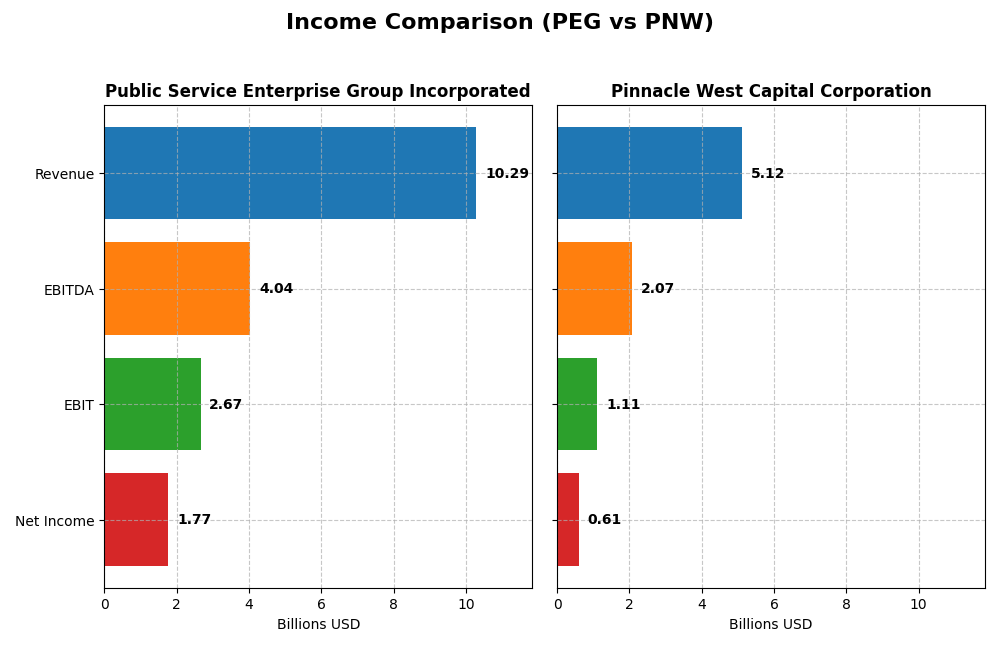
This table provides a side-by-side comparison of the most recent fiscal year income statement metrics for Public Service Enterprise Group Incorporated and Pinnacle West Capital Corporation.
| Metric | Public Service Enterprise Group Incorporated | Pinnacle West Capital Corporation |
|---|---|---|
| Market Cap | 39.3B | 10.7B |
| Revenue | 10.3B | 5.1B |
| EBITDA | 4.0B | 2.1B |
| EBIT | 2.7B | 1.1B |
| Net Income | 1.8B | 609M |
| EPS | 3.56 | 5.35 |
| Fiscal Year | 2024 | 2024 |
Income Statement Interpretations
Public Service Enterprise Group Incorporated
Public Service Enterprise Group Incorporated (PEG) showed a mixed trend from 2020 to 2024, with revenue increasing modestly by 7.15% overall but declining 8.43% in the latest year. Net income decreased by nearly 7% over the period, with a sharp fall of 30.99% in earnings per share in 2024. Margins are generally favorable but showed deterioration in the most recent year, reflecting lower profitability despite stable interest expenses.
Pinnacle West Capital Corporation
Pinnacle West Capital Corporation (PNW) exhibited strong revenue growth of 42.88% over five years, with a 9.13% increase in 2024 alone. Net income rose steadily by 10.58% overall and 18.82% in the last year, supported by improving gross and EBIT margins. However, operating expenses grew faster than revenue in 2024, slightly pressuring margins, which nonetheless remain favorable and stable over the period.
Which one has the stronger fundamentals?
Pinnacle West Capital Corporation demonstrates stronger fundamentals with consistent revenue and net income growth, supported by improving margins and earnings per share. Conversely, Public Service Enterprise Group faces unfavorable trends with declining income and EPS, despite favorable gross and EBIT margins. Overall, PNW’s income statement reflects more robust and positive financial momentum compared to PEG.
Financial Ratios Comparison
The table below compares key financial ratios for Public Service Enterprise Group Incorporated (PEG) and Pinnacle West Capital Corporation (PNW) based on their most recent fiscal year 2024 data.
| Ratios | Public Service Enterprise Group Incorporated (PEG) | Pinnacle West Capital Corporation (PNW) |
|---|---|---|
| ROE | 10.99% | 9.01% |
| ROIC | 4.40% | 3.48% |
| P/E | 23.74 | 15.85 |
| P/B | 2.61 | 1.43 |
| Current Ratio | 0.65 | 0.59 |
| Quick Ratio | 0.48 | 0.42 |
| D/E (Debt-to-Equity) | 1.42 | 1.64 |
| Debt-to-Assets | 41.89% | 42.33% |
| Interest Coverage | 2.80 | 2.68 |
| Asset Turnover | 0.19 | 0.20 |
| Fixed Asset Turnover | 0.26 | 0.25 |
| Payout Ratio | 67.49% | 64.83% |
| Dividend Yield | 2.84% | 4.09% |
Interpretation of the Ratios
Public Service Enterprise Group Incorporated
Public Service Enterprise Group shows mixed ratio performance with a strong net margin of 17.22% but weaker returns on invested capital at 4.4%. Debt levels and liquidity ratios like current ratio at 0.65 are unfavorable, indicating some financial risk. The dividend yield is favorable at 2.84%, supported by a consistent payout, but coverage by free cash flow appears strained, suggesting cautious monitoring.
Pinnacle West Capital Corporation
Pinnacle West Capital exhibits a decent net margin of 11.88%, though its return on equity is lower at 9.01%, reflecting some operational challenges. Liquidity ratios are weak with a current ratio of 0.59 and debt-to-equity at 1.64, indicating higher leverage risk. The dividend yield is attractive at 4.09%, but free cash flow coverage is negative, which may pressure future distributions.
Which one has the best ratios?
Both companies face liquidity and leverage challenges, with unfavorable current and quick ratios and elevated debt-to-equity ratios. Public Service Enterprise Group has a better net margin and slightly higher return on equity, while Pinnacle West offers a higher dividend yield and more favorable price-to-book ratio. Overall, both show a slightly unfavorable ratio profile with different strengths and weaknesses.
Strategic Positioning
This section compares the strategic positioning of Public Service Enterprise Group (PEG) and Pinnacle West Capital Corporation (PNW) covering Market position, Key segments, and exposure to disruption:
Public Service Enterprise Group (PEG)
- Larger market cap of $39.3B, operating primarily in Northeast and Mid-Atlantic US, facing regulated electric industry pressures.
- Diverse segments including electricity and gas distribution, transmission, solar projects, and appliance services.
- Invests in solar generation and energy efficiency programs, indicating moderate exposure to technological disruption.
Pinnacle West Capital Corporation (PNW)
- Smaller market cap of $10.7B, focused on Arizona market, regulated electric sector with moderate competitive pressure.
- Concentrated mainly on electric generation, transmission, and distribution serving 1.3M customers.
- Uses coal, nuclear, gas, oil, and solar generation with less emphasis on new technology disruption.
Public Service Enterprise Group (PEG) vs Pinnacle West Capital Corporation (PNW) Positioning
PEG has a more diversified business with multiple energy and utility segments across a broader geography, potentially balancing risks. PNW’s concentration in Arizona and fewer segments may limit diversification but focuses on regulated electric services.
Which has the best competitive advantage?
Both PEG and PNW are currently shedding value with ROIC below WACC. PEG shows growing profitability, while PNW’s declining ROIC indicates a weaker competitive advantage and more unfavorable moat status.
Stock Comparison
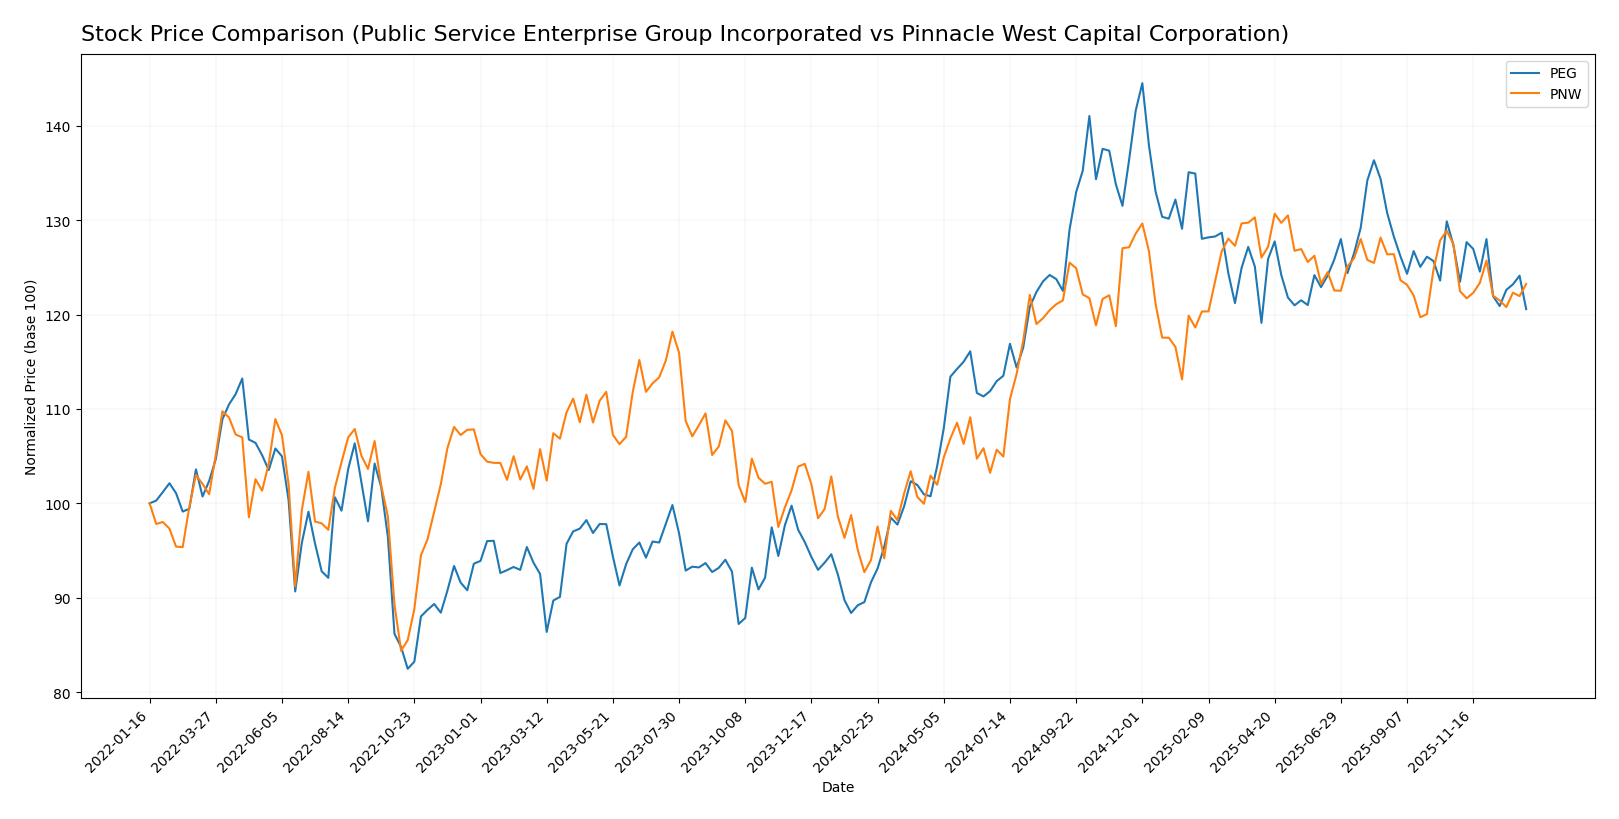
The stock price dynamics of Public Service Enterprise Group Incorporated (PEG) and Pinnacle West Capital Corporation (PNW) over the past 12 months reveal significant bullish trends with notable deceleration and recent downward adjustments.
Trend Analysis
Public Service Enterprise Group Incorporated (PEG) experienced a bullish trend over the past year with a 31.59% price increase, accompanied by deceleration and a high volatility of 7.17. Recently, PEG shows a slight bearish correction of -5.33%.
Pinnacle West Capital Corporation (PNW) also reported a bullish trend with a 31.14% rise over the year, decelerating similarly to PEG and exhibiting volatility at 6.87. Its recent trend shows a mild bearish movement of -3.31%.
Comparing both, PEG delivered a marginally higher market performance with a 31.59% increase versus PNW’s 31.14%, despite both showing deceleration and recent bearish corrections.
Target Prices
Analysts present a clear target price consensus for Public Service Enterprise Group Incorporated and Pinnacle West Capital Corporation.
| Company | Target High | Target Low | Consensus |
|---|---|---|---|
| Public Service Enterprise Group Incorporated | 98 | 83 | 89 |
| Pinnacle West Capital Corporation | 115 | 85 | 96.33 |
The consensus targets for both utilities suggest moderate upside potential compared to their current prices of $78.68 for PEG and $89.07 for PNW. Analysts expect steady performance aligned with industry stability.
Analyst Opinions Comparison
This section compares analysts’ ratings and financial scores for Public Service Enterprise Group Incorporated (PEG) and Pinnacle West Capital Corporation (PNW):
Rating Comparison
PEG Rating
- Rating: B-, considered very favorable overall.
- Discounted Cash Flow Score: 1, rated very unfavorable indicating possible overvaluation.
- ROE Score: 4, favorable, showing efficient profit generation from equity.
- ROA Score: 4, favorable, demonstrating effective asset utilization.
- Debt To Equity Score: 2, moderate, reflecting average financial risk.
- Overall Score: 3, moderate overall financial standing.
PNW Rating
- Rating: C+, also considered very favorable overall.
- Discounted Cash Flow Score: 1, also very unfavorable, suggesting similar concerns.
- ROE Score: 3, moderate, indicating less efficient profit generation.
- ROA Score: 3, moderate, showing less effective asset use.
- Debt To Equity Score: 1, very unfavorable, indicating higher financial risk.
- Overall Score: 2, moderate but lower than PEG’s overall score.
Which one is the best rated?
Based strictly on the provided data, PEG holds a higher overall rating (B-) and better scores in ROE, ROA, and debt-to-equity metrics compared to PNW’s C+ rating and generally lower scores, making PEG the better rated company.
Scores Comparison
Here is the comparison of the Altman Z-Score and Piotroski Score for the two companies:
PEG Scores
- Altman Z-Score: 1.32, in distress zone indicating high bankruptcy risk.
- Piotroski Score: 7, classified as strong financial health.
PNW Scores
- Altman Z-Score: 0.73, in distress zone indicating very high bankruptcy risk.
- Piotroski Score: 4, indicating average financial strength.
Which company has the best scores?
PEG has better scores with a higher Altman Z-Score and a stronger Piotroski Score compared to PNW, which shows weaker financial metrics in both evaluations.
Grades Comparison
Here is a comparison of the recent grades assigned to Public Service Enterprise Group Incorporated and Pinnacle West Capital Corporation by reputable grading companies:
Public Service Enterprise Group Incorporated Grades
The table below summarizes recent grades for Public Service Enterprise Group Incorporated from established grading firms.
| Grading Company | Action | New Grade | Date |
|---|---|---|---|
| Ladenburg Thalmann | Upgrade | Buy | 2026-01-07 |
| UBS | Maintain | Buy | 2025-12-17 |
| JP Morgan | Maintain | Overweight | 2025-12-12 |
| Jefferies | Upgrade | Buy | 2025-11-06 |
| TD Cowen | Maintain | Buy | 2025-11-05 |
| BMO Capital | Maintain | Market Perform | 2025-11-04 |
| Barclays | Maintain | Equal Weight | 2025-10-21 |
| BMO Capital | Maintain | Market Perform | 2025-10-20 |
| Morgan Stanley | Maintain | Overweight | 2025-09-25 |
| BMO Capital | Maintain | Market Perform | 2025-08-06 |
Overall, Public Service Enterprise Group Incorporated’s grades mainly indicate buy or overweight ratings, reflecting a generally positive outlook.
Pinnacle West Capital Corporation Grades
The table below shows recent grades for Pinnacle West Capital Corporation from recognized grading institutions.
| Grading Company | Action | New Grade | Date |
|---|---|---|---|
| UBS | Maintain | Neutral | 2025-12-17 |
| Keybanc | Downgrade | Sector Weight | 2025-12-12 |
| Keybanc | Maintain | Overweight | 2025-10-15 |
| UBS | Maintain | Neutral | 2025-10-10 |
| Barclays | Maintain | Equal Weight | 2025-10-07 |
| Argus Research | Maintain | Buy | 2025-09-30 |
| Morgan Stanley | Maintain | Equal Weight | 2025-09-25 |
| UBS | Maintain | Neutral | 2025-09-12 |
| Mizuho | Downgrade | Neutral | 2025-09-09 |
| Barclays | Maintain | Equal Weight | 2025-08-13 |
Pinnacle West Capital Corporation’s ratings tend to cluster around neutral to equal weight, with some downgrades noted, suggesting a more cautious market stance.
Which company has the best grades?
Public Service Enterprise Group Incorporated has received predominantly buy and overweight grades, indicating stronger confidence from analysts compared to Pinnacle West Capital Corporation, whose consensus centers on hold and neutral ratings. This difference may influence investors’ perception of growth potential and risk profiles for each company.
Strengths and Weaknesses
Below is a comparison of key strengths and weaknesses for Public Service Enterprise Group Incorporated (PEG) and Pinnacle West Capital Corporation (PNW) based on the latest available data.
| Criterion | Public Service Enterprise Group (PEG) | Pinnacle West Capital Corporation (PNW) |
|---|---|---|
| Diversification | Broad revenue streams: electric utility, natural gas, transmission; strong contract revenues totaling over 7B USD in 2024 | Primarily electric service with limited segment diversification; ~2.7B USD revenue in 2024 |
| Profitability | Net margin strong at 17.2%, but ROIC (4.4%) below WACC (5.37%), indicating value destruction despite increasing ROIC trend | Lower net margin at 11.9%, ROIC (3.5%) below WACC (4.68%), with declining profitability trend |
| Innovation | Moderate innovation reflected in steady ROIC improvement, but asset turnover is low (0.19) | Innovation appears limited with declining ROIC and low asset turnover (0.20) |
| Global presence | Primarily US-focused with regional dominance in New Jersey and surrounding areas | Mainly regional presence centered in Arizona |
| Market Share | Leading market share in New Jersey’s regulated utility market | Significant but smaller regional market share in Arizona |
Key takeaways: PEG shows better diversification and a solid net margin, with improving profitability trends, though it currently destroys value. PNW faces more challenges with declining profitability and less diversification. Both have slightly unfavorable financial ratios, suggesting cautious investment consideration.
Risk Analysis
Below is a comparative table of key risks for Public Service Enterprise Group Incorporated (PEG) and Pinnacle West Capital Corporation (PNW) based on the latest 2024 data:
| Metric | PEG | PNW |
|---|---|---|
| Market Risk | Moderate (Beta 0.61, stable utility sector) | Moderate (Beta 0.54, regional exposure) |
| Debt Level | High (Debt/Equity 1.42, Debt to Assets 41.9%) | High (Debt/Equity 1.64, Debt to Assets 42.3%) |
| Regulatory Risk | Elevated (Regulated electric utility with ongoing policy shifts) | Elevated (State-regulated, subject to Arizona policies) |
| Operational Risk | Moderate (Large infrastructure, asset turnover low) | Moderate (Extensive grid, similar asset challenges) |
| Environmental Risk | Increasing (Investment in solar but exposure to fossil fuel legacy) | Increasing (Mixed generation sources including coal and nuclear) |
| Geopolitical Risk | Low (US-focused operations) | Low (US-focused operations) |
Both companies face significant regulatory and environmental risks due to their regulated utility status and the energy transition pressures. The most impactful risk is their high debt levels combined with relatively low liquidity ratios, increasing financial vulnerability. PEG’s Altman Z-score of 1.32 and PNW’s 0.73 place them in distress zones, indicating elevated bankruptcy risk, warranting cautious investment consideration.
Which Stock to Choose?
Public Service Enterprise Group Incorporated (PEG) shows a mixed income evolution with unfavorable recent revenue and profit growth, moderate profitability, and a slightly unfavorable global ratios profile. The company carries significant debt and has a favorable rating of B-.
Pinnacle West Capital Corporation (PNW) exhibits favorable income growth overall and in the last year, with solid profitability but higher debt levels. Its financial ratios are slightly unfavorable overall, and it holds a favorable rating of C+.
For investors prioritizing growth and income statement strength, PNW may appear more attractive due to its favorable earnings and revenue trends. Conversely, PEG might appeal to those focused on a stronger equity return and moderate financial stability despite its income challenges. Both companies face value creation concerns, with PEG showing improving profitability and PNW declining.
Disclaimer: Investment carries a risk of loss of initial capital. The past performance is not a reliable indicator of future results. Be sure to understand risks before making an investment decision.
Go Further
I encourage you to read the complete analyses of Public Service Enterprise Group Incorporated and Pinnacle West Capital Corporation to enhance your investment decisions: