In today’s competitive packaged foods landscape, The J. M. Smucker Company (SJM) and Pilgrim’s Pride Corporation (PPC) stand out as key players with overlapping market presence. Both companies leverage innovation in product diversification and global distribution, yet they differ in scale and specialization—Smucker in branded consumer foods and pet products, Pilgrim’s in poultry and meat processing. This article will help you decide which company offers the most compelling investment opportunity in 2026.

Table of contents
Companies Overview
I will begin the comparison between The J. M. Smucker Company and Pilgrim’s Pride Corporation by providing an overview of these two companies and their main differences.
The J. M. Smucker Company Overview
The J. M. Smucker Company operates globally in the packaged foods industry, focusing on branded food and beverage products. Its segments include U.S. Retail Pet Foods, Coffee, and Consumer Foods. The company offers a diverse portfolio such as coffee, peanut butter, fruit spreads, pet food, and frozen snacks, marketed under well-known brands like Folgers, Jif, and Meow Mix. Headquartered in Orrville, Ohio, it employs around 9,000 people.
Pilgrim’s Pride Corporation Overview
Pilgrim’s Pride Corporation specializes in fresh, frozen, and value-added chicken and pork products, serving retail, foodservice, and international markets. Its product range includes marinated chicken, pork cuts, processed meats, and prepared foods sold under various brands like Pilgrim’s and Just BARE. The company operates as a subsidiary of JBS S.A., is headquartered in Greeley, Colorado, and employs approximately 62,600 people.
Key similarities and differences
Both companies operate in the consumer defensive sector within the packaged foods industry, focusing on protein-rich products. Smucker’s portfolio is broader, covering pet foods, coffee, and consumer foods, while Pilgrim’s Pride concentrates on poultry and pork products. Their distribution channels overlap, targeting retail and foodservice markets, but Pilgrim’s has a stronger international presence and larger workforce compared to Smucker.
Income Statement Comparison
The table below compares key income statement metrics for the most recent fiscal year of The J. M. Smucker Company and Pilgrim’s Pride Corporation.
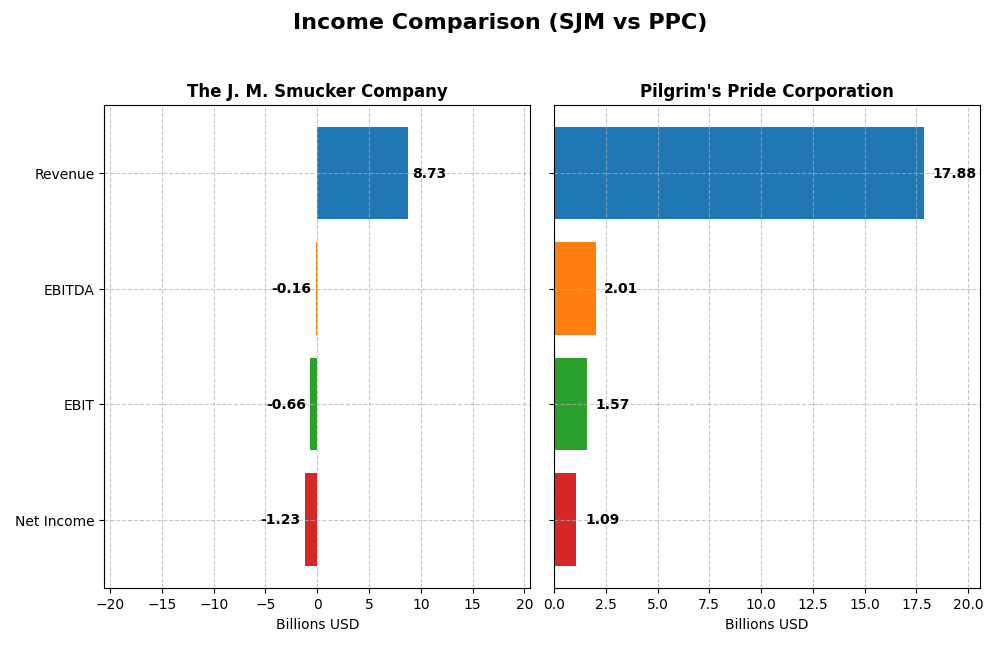
| Metric | The J. M. Smucker Company (SJM) | Pilgrim’s Pride Corporation (PPC) |
|---|---|---|
| Market Cap | 10.7B | 9.5B |
| Revenue | 8.73B | 17.88B |
| EBITDA | -156M | 2.01B |
| EBIT | -658M | 1.57B |
| Net Income | -1.23B | 1.09B |
| EPS | -11.57 | 4.58 |
| Fiscal Year | 2025 | 2024 |
Income Statement Interpretations
The J. M. Smucker Company
From 2021 to 2025, Smucker’s revenue showed moderate growth of 9%, but net income declined sharply by over 240%. Gross margins remained favorable near 39%, yet EBIT and net margins turned unfavorable, with a negative net margin of -14.1% in 2025. The latest year saw revenue growth slow to 6.7%, but earnings deteriorated significantly, reflecting margin compression and higher expenses.
Pilgrim’s Pride Corporation
Pilgrim’s Pride exhibited robust revenue growth of nearly 48% over five years, with net income surging 1,047%. Gross margin stayed neutral around 13%, while EBIT and net margins improved favorably, reaching 8.8% and 6.1% respectively in 2024. The most recent year showed a modest 3% revenue rise but strong profit expansion, including a net margin growth exceeding 228%, indicating enhanced profitability.
Which one has the stronger fundamentals?
Pilgrim’s Pride demonstrates stronger fundamentals with consistent revenue and net income growth, favorable margin trends, and improving profitability metrics. Conversely, Smucker faces earnings pressure despite stable revenue increases, with deteriorating net margins and negative EBIT in the latest fiscal year. Pilgrim’s overall income statement performance carries a favorable evaluation, unlike Smucker’s unfavorable outlook.
Financial Ratios Comparison
The table below compares the most recent financial ratios for The J. M. Smucker Company (SJM) and Pilgrim’s Pride Corporation (PPC) based on their fiscal year 2025 and 2024 data respectively.
| Ratios | The J. M. Smucker Company (SJM) FY 2025 | Pilgrim’s Pride Corporation (PPC) FY 2024 |
|---|---|---|
| ROE | -20.2% | 25.6% |
| ROIC | -5.1% | 14.2% |
| P/E | -10.1 | 9.9 |
| P/B | 2.03 | 2.54 |
| Current Ratio | 0.81 | 2.01 |
| Quick Ratio | 0.35 | 1.31 |
| D/E (Debt-to-Equity) | 1.28 | 0.82 |
| Debt-to-Assets | 44.2% | 32.5% |
| Interest Coverage | -1.88 | 9.34 |
| Asset Turnover | 0.50 | 1.68 |
| Fixed Asset Turnover | 2.73 | 5.27 |
| Payout ratio | -37.0% | 0% |
| Dividend yield | 3.68% | 0% |
Interpretation of the Ratios
The J. M. Smucker Company
The J. M. Smucker Company shows mostly unfavorable financial ratios in 2025, including negative net margin (-14.1%) and return on equity (-20.23%), indicating profitability and efficiency challenges. Liquidity ratios are weak, with a current ratio of 0.81, and high debt levels affect interest coverage negatively. Dividend yield is favorable at 3.68%, but risk exists from the overall financial strain.
Pilgrim’s Pride Corporation
Pilgrim’s Pride Corporation exhibits strong financial health with favorable ratios such as 25.63% return on equity and 14.2% return on invested capital in 2024. Liquidity is robust, evidenced by a current ratio of 2.01 and solid interest coverage of 9.76. The company does not pay dividends, likely prioritizing reinvestment or growth, which aligns with its favorable operational metrics.
Which one has the best ratios?
Pilgrim’s Pride Corporation demonstrates a clearly stronger ratio profile with 64.29% favorable ratios and solid profitability, liquidity, and efficiency metrics. In contrast, The J. M. Smucker Company’s ratios are predominantly unfavorable, reflecting operational and financial challenges despite a positive dividend yield. Therefore, Pilgrim’s Pride holds the more favorable overall financial ratio standing.
Strategic Positioning
This section compares the strategic positioning of The J. M. Smucker Company and Pilgrim’s Pride Corporation, focusing on Market position, Key segments, and Exposure to technological disruption:
The J. M. Smucker Company
- Established market player in packaged foods with moderate competitive pressure.
- Diversified product portfolio including pet foods, coffee, and consumer foods.
- No explicit data on exposure to technological disruption provided.
Pilgrim’s Pride Corporation
- Large-scale poultry and pork producer facing competitive market dynamics.
- Concentrated on fresh, frozen chicken and pork products globally.
- No explicit data on exposure to technological disruption provided.
The J. M. Smucker Company vs Pilgrim’s Pride Corporation Positioning
Smucker’s diversified approach spans multiple food segments offering risk spread, while Pilgrim’s Pride focuses predominantly on poultry and pork, potentially increasing exposure to segment-specific risks. Smucker has a broad product mix; Pilgrim’s Pride benefits from global market reach.
Which has the best competitive advantage?
Based on MOAT evaluation, Pilgrim’s Pride shows a very favorable position with growing ROIC and value creation, indicating a durable competitive advantage. Smucker exhibits a very unfavorable MOAT with declining ROIC and value destruction.
Stock Comparison
The stock prices of The J. M. Smucker Company and Pilgrim’s Pride Corporation over the past year reveal contrasting trajectories, with Smucker showing a notable decline and Pilgrim’s Pride demonstrating strong upward momentum.
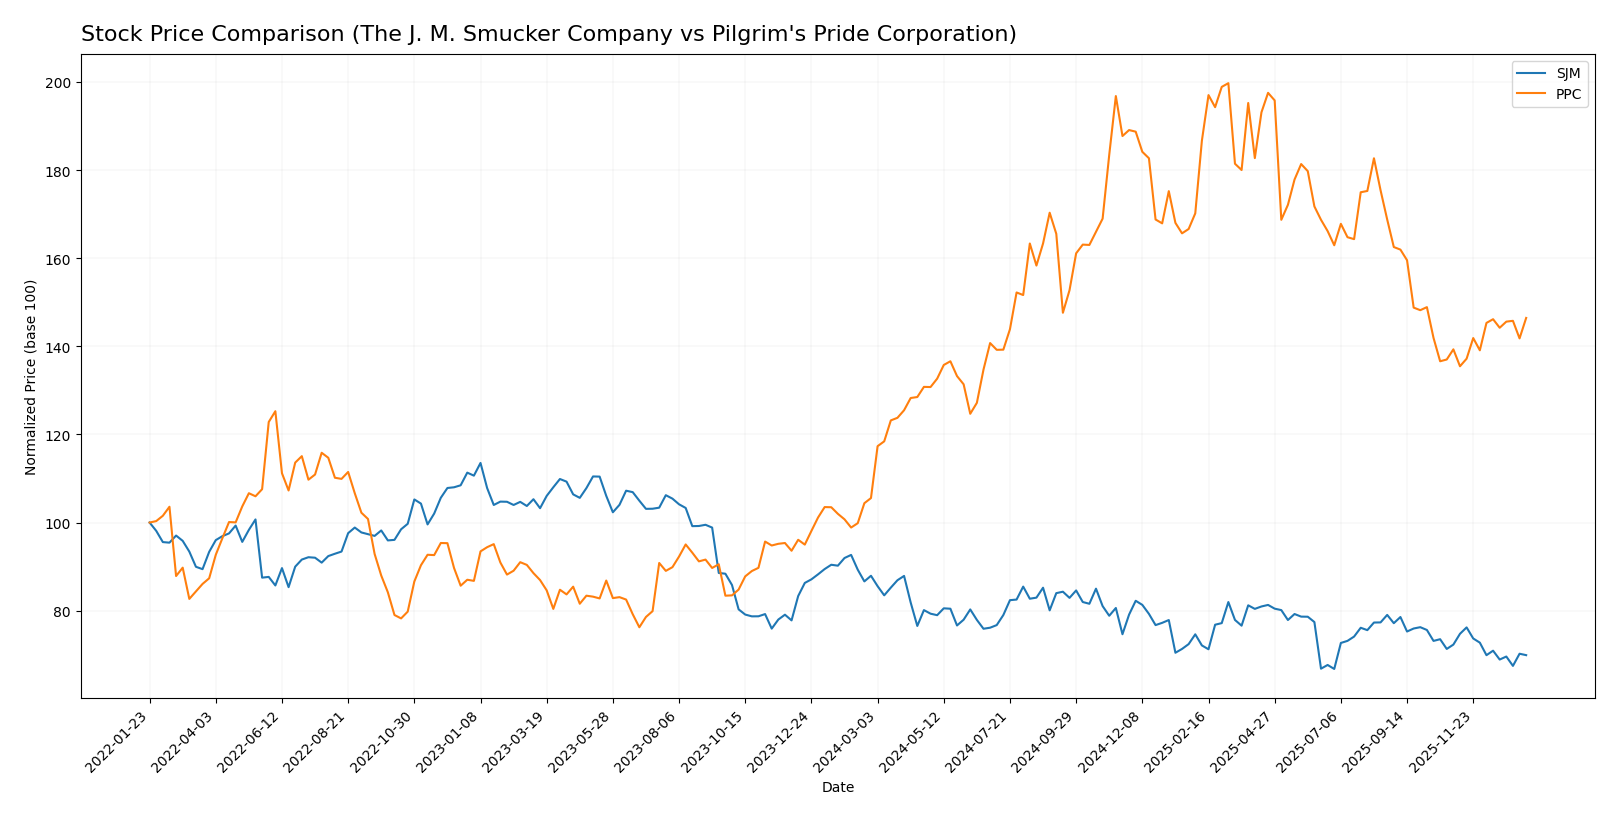
Trend Analysis
The J. M. Smucker Company experienced a 20.49% price decline over the past year, indicating a bearish trend with decelerating downward momentum and a volatility level reflected by a 6.98 standard deviation. Recent months show a continued mild decline of 3.31%.
Pilgrim’s Pride Corporation posted a 38.73% price increase over the past year, reflecting a bullish trend with accelerating gains and a 6.11 standard deviation. The recent 5.12% rise confirms ongoing positive momentum.
Comparatively, Pilgrim’s Pride outperformed The J. M. Smucker Company by a wide margin, delivering the highest market performance with a sustained bullish trend versus Smucker’s prolonged bearish movement.
Target Prices
The current analyst consensus indicates moderate upside potential for both companies.
| Company | Target High | Target Low | Consensus |
|---|---|---|---|
| The J. M. Smucker Company | 117 | 110 | 113.4 |
| Pilgrim’s Pride Corporation | 56 | 45 | 50.5 |
Analysts expect The J. M. Smucker Company’s stock to trade above its current price of 100.12 USD, while Pilgrim’s Pride Corporation’s consensus target of 50.5 USD also suggests a significant upside from its current 40.05 USD price.
Analyst Opinions Comparison
This section compares analysts’ ratings and grades for The J. M. Smucker Company (SJM) and Pilgrim’s Pride Corporation (PPC):
Rating Comparison
SJM Rating
- Rating: C+, considered very favorable overall.
- Discounted Cash Flow Score: 5, indicating very favorable valuation potential.
- ROE Score: 1, very unfavorable, showing low efficiency in generating profit.
- ROA Score: 1, very unfavorable, indicating poor asset utilization.
- Debt To Equity Score: 1, very unfavorable, suggesting high financial risk.
- Overall Score: 2, moderate, reflecting mixed financial strength.
PPC Rating
- Rating: A+, considered very favorable overall.
- Discounted Cash Flow Score: 4, indicating favorable valuation potential.
- ROE Score: 5, very favorable, showing high efficiency in generating profit.
- ROA Score: 5, very favorable, indicating strong asset utilization.
- Debt To Equity Score: 4, favorable, indicating moderate financial risk.
- Overall Score: 4, favorable, reflecting solid financial standing.
Which one is the best rated?
Based strictly on the provided data, PPC is better rated overall with an A+ rating and higher scores in most key financial metrics, including ROE, ROA, and debt-to-equity, compared to SJM’s lower ratings and scores.
Scores Comparison
Here is a comparison of the Altman Z-Score and Piotroski Score for both companies:
SJM Scores
- Altman Z-Score: 0.90, in distress zone, high risk of bankruptcy
- Piotroski Score: 4, average financial strength
PPC Scores
- Altman Z-Score: 3.75, in safe zone, low bankruptcy risk
- Piotroski Score: 5, average financial strength
Which company has the best scores?
Based on the provided data, PPC has a significantly better Altman Z-Score indicating lower bankruptcy risk, and a slightly higher Piotroski Score, both suggesting somewhat stronger financial health than SJM.
Grades Comparison
Here is a comparison of the most recent grades assigned to The J. M. Smucker Company and Pilgrim’s Pride Corporation by recognized grading companies:
The J. M. Smucker Company Grades
The table below summarizes recent grades from established financial analysts for SJM:
| Grading Company | Action | New Grade | Date |
|---|---|---|---|
| TD Cowen | Maintain | Hold | 2026-01-08 |
| Bernstein | Maintain | Market Perform | 2025-11-26 |
| Stifel | Maintain | Hold | 2025-11-26 |
| UBS | Maintain | Buy | 2025-11-26 |
| Morgan Stanley | Maintain | Overweight | 2025-11-26 |
| JP Morgan | Maintain | Overweight | 2025-11-26 |
| Stifel | Maintain | Hold | 2025-10-24 |
| Argus Research | Downgrade | Hold | 2025-09-12 |
| Barclays | Maintain | Equal Weight | 2025-08-29 |
| JP Morgan | Maintain | Overweight | 2025-08-28 |
Overall, SJM’s grades show a mix of Hold and Buy-related ratings, with several firms maintaining a neutral to moderately positive stance over recent months.
Pilgrim’s Pride Corporation Grades
Below is the summary of recent grades for PPC from reputable financial institutions:
| Grading Company | Action | New Grade | Date |
|---|---|---|---|
| Barclays | Maintain | Equal Weight | 2025-12-09 |
| Goldman Sachs | Maintain | Neutral | 2025-10-13 |
| BMO Capital | Maintain | Market Perform | 2025-03-17 |
| Barclays | Maintain | Equal Weight | 2024-11-01 |
| BMO Capital | Maintain | Market Perform | 2024-11-01 |
| Barclays | Maintain | Equal Weight | 2024-09-09 |
| Argus Research | Maintain | Buy | 2024-08-28 |
| B of A Securities | Downgrade | Neutral | 2024-08-15 |
| BMO Capital | Downgrade | Market Perform | 2024-08-12 |
| Barclays | Maintain | Equal Weight | 2024-08-02 |
PPC’s ratings mostly range from Equal Weight to Market Perform, with occasional Buy and Neutral ratings, reflecting a generally cautious outlook.
Which company has the best grades?
Both companies have a consensus Hold rating, but SJM has a higher number of Buy and Overweight ratings from major firms compared to PPC’s predominance of Equal Weight and Market Perform grades. This suggests SJM is viewed somewhat more favorably by analysts, potentially indicating a stronger market position or growth prospects for investors.
Strengths and Weaknesses
Below is a comparison table highlighting the key strengths and weaknesses of The J. M. Smucker Company (SJM) and Pilgrim’s Pride Corporation (PPC) based on the most recent financial and operational data.
| Criterion | The J. M. Smucker Company (SJM) | Pilgrim’s Pride Corporation (PPC) |
|---|---|---|
| Diversification | Moderate diversification across pet foods, coffee, baked snacks, and consumer foods; some reliance on U.S. markets | Focused on poultry products with less diversification but strong specialization |
| Profitability | Unfavorable: negative net margin (-14.1%) and declining ROIC (-5.09%) | Favorable: positive net margin (6.08%), strong ROIC (14.2%), growing profitability |
| Innovation | Limited recent innovation indicated; declining profitability suggests challenges | Strong operational efficiency and margin improvements suggest innovation in process and product |
| Global presence | Presence in U.S. and international markets but limited growth internationally | Mainly North American focus; less global presence but strong market position locally |
| Market Share | Solid in coffee and pet food segments but facing challenges | Leading player in poultry with growing market share and competitive advantage |
Key takeaways: Pilgrim’s Pride shows a robust financial and competitive profile with a favorable moat and growing returns, making it a stronger value creator. In contrast, Smucker faces profitability headwinds and value destruction, signaling caution for investors despite its diversified product base.
Risk Analysis
The table below summarizes key risks for The J. M. Smucker Company (SJM) and Pilgrim’s Pride Corporation (PPC) based on their latest financial and operational data for 2025 and 2024 respectively:
| Metric | The J. M. Smucker Company (SJM) | Pilgrim’s Pride Corporation (PPC) |
|---|---|---|
| Market Risk | Low beta (0.22) suggests low volatility, but negative margins increase sensitivity to demand shifts | Moderate beta (0.445), stable margins; moderately exposed to poultry market fluctuations |
| Debt level | High debt-to-equity (1.28), weak interest coverage (-1.84) indicate financial strain | Moderate debt-to-equity (0.82), strong interest coverage (9.76) shows manageable leverage |
| Regulatory Risk | Moderate, mainly food safety and labeling regulations | Moderate-to-high, due to extensive international operations and meat processing regulations |
| Operational Risk | Supply chain and product diversification reduce risk, but negative ROIC hints operational inefficiency | Large scale operations increase complexity, but favorable ROIC and turnover ratios reduce risk |
| Environmental Risk | Moderate, with growing pressure on sustainable sourcing and packaging | High, due to environmental concerns in livestock farming and emissions |
| Geopolitical Risk | Low, primarily US-focused markets | Moderate, exposure to international markets including Middle East and Asia |
SJM faces significant financial and operational risks, highlighted by its distress-zone Altman Z-score and high leverage, posing the most impactful threat. PPC shows stronger financial health and lower bankruptcy risk but is more exposed to environmental and geopolitical factors due to its global footprint. Investors should weigh SJM’s financial instability against PPC’s operational and regulatory exposures.
Which Stock to Choose?
The J. M. Smucker Company (SJM) shows a mixed income evolution with revenue growth of 9.04% overall but declining profitability, reflected in negative net margin (-14.1%) and returns on equity (-20.23%). Its financial ratios reveal several weaknesses, including low liquidity (current ratio 0.81) and unfavorable leverage metrics, resulting in a very unfavorable global ratios opinion and a very unfavorable MOAT rating due to value destruction.
Pilgrim’s Pride Corporation (PPC) demonstrates stable income growth with overall revenue increase of 47.85% and favorable net margin at 6.08%. Its financial ratios are mostly favorable, including strong returns on equity (25.63%), solid liquidity (current ratio 2.01), and moderate leverage, leading to a favorable global ratios opinion and a very favorable MOAT rating indicating durable competitive advantage and value creation.
Considering the ratings and overall income and financial ratio evaluations, PPC might appear more favorable for risk-tolerant investors seeking growth and quality, while SJM’s profile could be interpreted as less attractive due to negative profitability and value erosion, appealing only to investors focused on turnaround opportunities or higher risk tolerance.
Disclaimer: Investment carries a risk of loss of initial capital. The past performance is not a reliable indicator of future results. Be sure to understand risks before making an investment decision.
Go Further
I encourage you to read the complete analyses of The J. M. Smucker Company and Pilgrim’s Pride Corporation to enhance your investment decisions: