US Foods Holding Corp. (USFD) and Performance Food Group Company (PFGC) are two leading players in the competitive food distribution industry. Both companies serve a broad range of customers, from restaurants to institutions, leveraging innovation and extensive networks to capture market share. This comparison highlights their strategic strengths and market positions to help you identify which stock might be the more promising addition to your investment portfolio. Let’s explore their potential together.

Table of contents
Companies Overview
I will begin the comparison between US Foods Holding Corp. and Performance Food Group Company by providing an overview of these two companies and their main differences.
US Foods Holding Corp. Overview
US Foods Holding Corp. operates through its subsidiary US Foods, marketing and distributing fresh, frozen, and dry food and non-food products to a broad range of foodservice customers in the U.S. Its clientele includes restaurants, healthcare facilities, hotels, and government organizations. Headquartered in Rosemont, Illinois, it runs 70 broadline facilities and 80 cash and carry locations, positioning itself as a major player in food distribution.
Performance Food Group Company Overview
Performance Food Group Company distributes food and related products across the United States through its three segments: Foodservice, Vistar, and Convenience. Its portfolio includes frozen foods, groceries, tobacco products, meat, health and beauty care items, and cleaning supplies. Headquartered in Richmond, Virginia, it serves diverse clients such as restaurants, schools, hospitals, retailers, and institutional customers, offering value-added services like menu development and operational strategy.
Key similarities and differences
Both US Foods and Performance Food Group operate in the food distribution industry within the U.S., targeting foodservice and institutional customers. While US Foods focuses on fresh, frozen, and dry food products with a network of broadline and cash and carry facilities, Performance Food Group has a broader product range including non-food items and value-added services across three distinct segments. Each company maintains a strong national presence but differs in operational structure and service offerings.
Income Statement Comparison
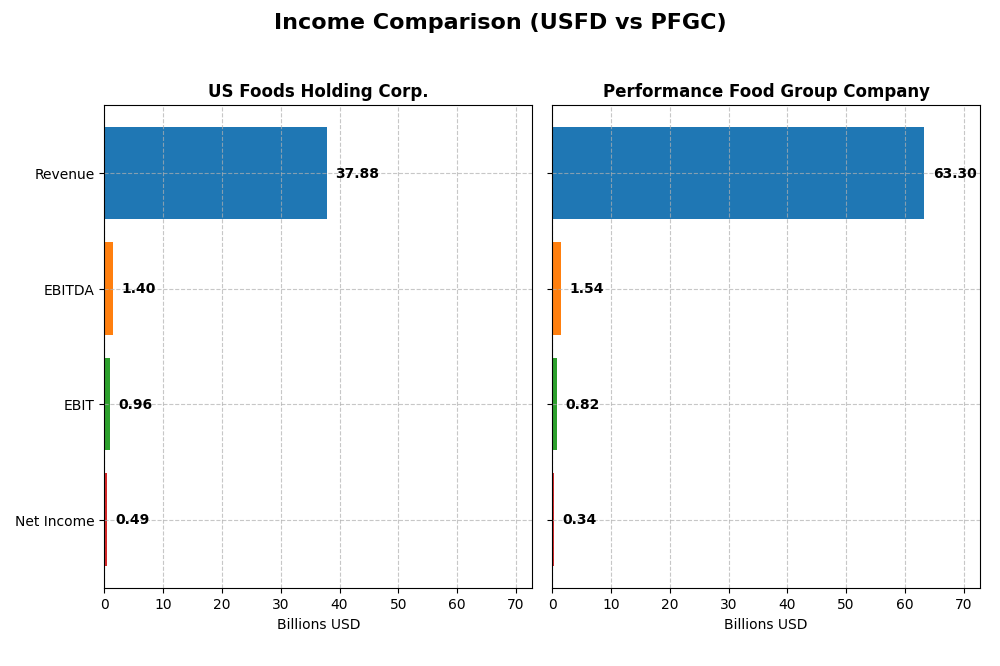
Below is a concise comparison of the latest fiscal year income statement metrics for US Foods Holding Corp. and Performance Food Group Company.
| Metric | US Foods Holding Corp. | Performance Food Group Company |
|---|---|---|
| Market Cap | 17.2B | 14.4B |
| Revenue | 37.9B | 63.3B |
| EBITDA | 1.40B | 1.54B |
| EBIT | 959M | 816M |
| Net Income | 494M | 340M |
| EPS | 2.05 | 2.20 |
| Fiscal Year | 2024 | 2025 |
Income Statement Interpretations
US Foods Holding Corp.
US Foods Holding Corp. experienced steady revenue growth from $22.9B in 2020 to $37.9B in 2024, with net income improving significantly from a loss of $254M in 2020 to a positive $494M in 2024. Margins remained relatively stable, with a gross margin around 17.25% and a neutral net margin near 1.3%. The latest year showed moderate revenue growth of 6.4%, but EBIT and net margin declined slightly.
Performance Food Group Company
Performance Food Group posted robust revenue growth from $30.4B in 2021 to $63.3B in 2025, with net income rising sharply from $41M to $340M. Despite this, margins remained thin, with a gross margin near 11.7% and net margin around 0.54%. The most recent year saw favorable revenue and gross profit increases, but EBIT and net margin declined, reflecting some operational cost pressures.
Which one has the stronger fundamentals?
Both companies show favorable long-term revenue and net income growth, with stable gross margins but low net margins. US Foods Holding has higher gross and net margins, while Performance Food Group achieves greater scale and faster revenue expansion. EBIT and net margin trends in the latest year were unfavorable for both, indicating caution despite overall growth momentum.
Financial Ratios Comparison
This table presents the key financial ratios for US Foods Holding Corp. (USFD) and Performance Food Group Company (PFGC) based on their most recent fiscal year data available.
| Ratios | US Foods Holding Corp. (USFD) FY 2024 | Performance Food Group Company (PFGC) FY 2025 |
|---|---|---|
| ROE | 10.91% | 7.61% |
| ROIC | 8.02% | 4.32% |
| P/E | 33.26 | 39.80 |
| P/B | 3.63 | 3.03 |
| Current Ratio | 1.21 | 1.58 |
| Quick Ratio | 0.71 | 0.72 |
| D/E (Debt-to-Equity Ratio) | 1.20 | 1.79 |
| Debt-to-Assets | 40.44% | 44.72% |
| Interest Coverage | 3.49 | 2.28 |
| Asset Turnover | 2.82 | 3.54 |
| Fixed Asset Turnover | 15.80 | 11.74 |
| Payout Ratio | 0% | 0% |
| Dividend Yield | 0% | 0% |
Interpretation of the Ratios
US Foods Holding Corp.
US Foods shows a mixed ratio profile with favorable asset turnover metrics but unfavorable net margin, PE, PB, quick ratio, and debt-to-equity levels. Return on equity and invested capital are neutral, indicating moderate profitability. The company does not pay dividends, reflecting a possible reinvestment strategy or focus on managing debt, as free cash flow to equity remains negative.
Performance Food Group Company
Performance Food Group displays generally weaker profitability ratios with unfavorable net margin, ROE, and ROIC, though it benefits from a favorable current ratio and asset turnover rates. Its high debt-to-equity ratio and low interest coverage suggest financial leverage concerns. Like US Foods, PFGC pays no dividends, possibly prioritizing growth and cash flow management amid negative free cash flow to equity.
Which one has the best ratios?
US Foods Holding Corp. holds a slightly unfavorable overall ratio assessment, showing some operational strengths and moderate profitability, while Performance Food Group faces a more unfavorable evaluation with weaker returns and higher leverage risks. Both companies do not distribute dividends, highlighting cautious capital allocation in a challenging financial environment.
Strategic Positioning
This section compares the strategic positioning of USFD and PFGC, including Market position, Key segments, and Exposure to technological disruption:
USFD
- Leading US food distributor facing competition in broadline and cash-and-carry foodservice markets.
- Diverse product portfolio across multiple food categories including fresh, frozen, and dry goods.
- No explicit mention of technological disruption exposure in available data.
PFGC
- US food distributor active in foodservice, Vistar, and convenience segments with broad reach.
- Concentrated segments: Foodservice, Convenience, and Specialty, with value-added services offered.
- No explicit mention of technological disruption exposure in available data.
USFD vs PFGC Positioning
USFD shows a diversified business model covering varied food products and service formats, while PFGC focuses on three main segments with value-added services. USFD’s broader reach contrasts with PFGC’s more concentrated operations and service offerings.
Which has the best competitive advantage?
Both companies are shedding value but show growing profitability. USFD holds a slightly favorable moat status, whereas PFGC’s moat status is slightly unfavorable, indicating USFD currently has a marginally stronger competitive advantage.
Stock Comparison
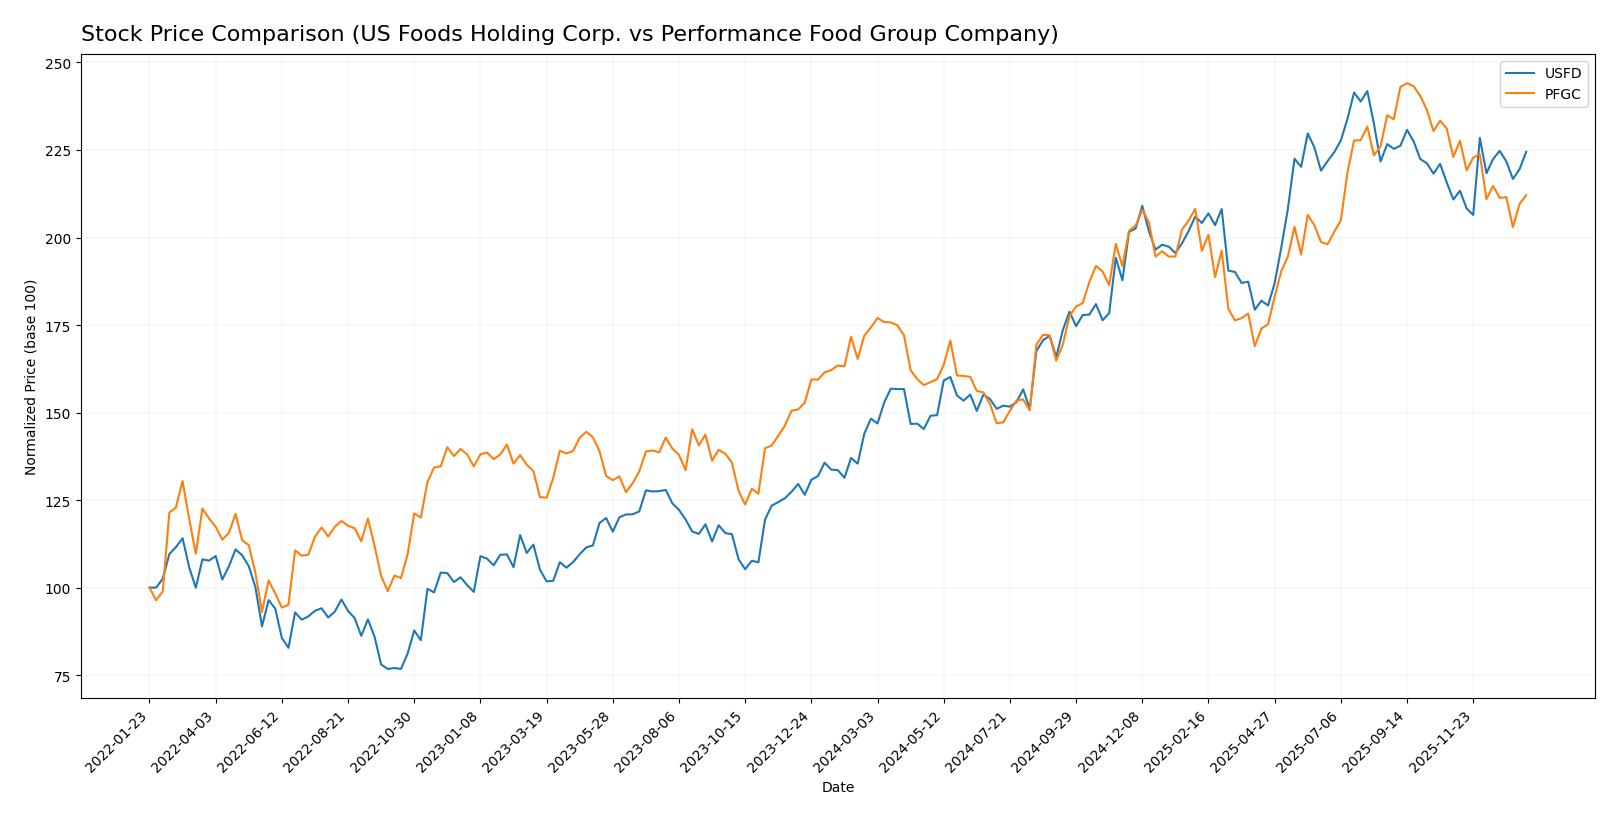
The stock price chart illustrates significant bullish momentum for US Foods Holding Corp. with accelerating gains, while Performance Food Group Company shows a more moderate upward trend with recent deceleration and short-term weakness.
Trend Analysis
US Foods Holding Corp. (USFD) experienced a strong bullish trend over the past 12 months, with a 51.41% price increase and accelerating momentum. The stock ranged between 50.04 and 83.28, showing considerable volatility (std deviation 9.99).
Performance Food Group Company (PFGC) also posted a bullish trend with a 21.7% rise over the last year but with deceleration. The price fluctuated from 63.74 to 105.88, accompanied by a higher volatility (std deviation 11.31). Recent months show a slight bearish correction (-4.88%).
Comparing both, USFD outperformed PFGC in total price appreciation over the past year, delivering the highest market performance despite PFGC’s stronger buyer dominance in volume.
Target Prices
The consensus target prices for these food distribution companies show moderate upside potential based on analyst estimates.
| Company | Target High | Target Low | Consensus |
|---|---|---|---|
| US Foods Holding Corp. | 95 | 85 | 89.33 |
| Performance Food Group Company | 130 | 105 | 116 |
Analysts expect US Foods Holding Corp. to trade around $89.33, which is approximately 15% above its current price of $77.31. Performance Food Group Company’s consensus target of $116 implies nearly 26% upside from its current price of $92.02.
Analyst Opinions Comparison
This section compares analysts’ ratings and grades for US Foods Holding Corp. and Performance Food Group Company:
Rating Comparison
USFD Rating
- Rating: B-, assessed as very favorable overall.
- Discounted Cash Flow Score: 3, indicating a moderate valuation based on cash flow projections.
- ROE Score: 4, reflecting a favorable efficiency in generating profit from equity.
- ROA Score: 3, showing moderate asset utilization effectiveness.
- Debt To Equity Score: 1, considered very unfavorable due to high financial risk.
- Overall Score: 3, representing a moderate overall financial standing.
PFGC Rating
- Rating: C+, also assessed as very favorable overall.
- Discounted Cash Flow Score: 3, similarly moderate valuation on cash flow basis.
- ROE Score: 3, moderate efficiency in generating profit from equity.
- ROA Score: 2, indicating moderate but lower effectiveness in asset utilization.
- Debt To Equity Score: 1, also very unfavorable, signaling similar financial risk.
- Overall Score: 2, indicating a moderate but lower overall financial standing.
Which one is the best rated?
Based strictly on the provided data, USFD holds a higher rating (B-) and scores better on ROE and overall financial standing compared to PFGC’s C+ rating and lower scores, making USFD the better rated company in this comparison.
Scores Comparison
Here is a comparison of the Altman Z-Score and Piotroski Score for both companies:
USFD Scores
- Altman Z-Score: 4.34, indicating financial safety
- Piotroski Score: 7, classified as strong
PFGC Scores
- Altman Z-Score: 4.67, indicating financial safety
- Piotroski Score: 5, classified as average
Which company has the best scores?
Both USFD and PFGC are in the safe zone according to their Altman Z-Scores, with PFGC slightly higher. USFD has a stronger Piotroski Score of 7 compared to PFGC’s 5, indicating better financial strength.
Grades Comparison
The following is a comparison of the recent grades assigned to US Foods Holding Corp. and Performance Food Group Company by reputable grading firms:
US Foods Holding Corp. Grades
This table presents recent grades issued by recognized financial institutions for US Foods Holding Corp.:
| Grading Company | Action | New Grade | Date |
|---|---|---|---|
| Citigroup | Maintain | Buy | 2026-01-07 |
| Barclays | Maintain | Overweight | 2025-11-07 |
| Piper Sandler | Maintain | Overweight | 2025-09-02 |
| Guggenheim | Maintain | Buy | 2025-08-11 |
| Wells Fargo | Maintain | Overweight | 2025-08-08 |
| UBS | Maintain | Buy | 2025-07-28 |
| Morgan Stanley | Maintain | Overweight | 2025-07-14 |
| JP Morgan | Maintain | Neutral | 2025-06-25 |
| Barclays | Maintain | Overweight | 2025-06-04 |
| JP Morgan | Maintain | Neutral | 2025-05-20 |
The grades for US Foods Holding Corp. show a consistent trend of positive recommendations, predominantly “Buy” and “Overweight,” with a few “Neutral” ratings.
Performance Food Group Company Grades
This table summarizes recent grades assigned to Performance Food Group Company from established grading entities:
| Grading Company | Action | New Grade | Date |
|---|---|---|---|
| Barclays | Maintain | Overweight | 2026-01-07 |
| Citigroup | Maintain | Buy | 2026-01-07 |
| Piper Sandler | Maintain | Overweight | 2025-12-12 |
| Piper Sandler | Maintain | Overweight | 2025-11-10 |
| Barclays | Maintain | Overweight | 2025-11-06 |
| Barclays | Maintain | Overweight | 2025-10-22 |
| Piper Sandler | Upgrade | Overweight | 2025-09-02 |
| Guggenheim | Maintain | Buy | 2025-08-26 |
| Wells Fargo | Maintain | Overweight | 2025-08-14 |
| UBS | Maintain | Buy | 2025-08-14 |
Performance Food Group Company also demonstrates a favorable rating pattern, with numerous “Buy” and “Overweight” grades and an upgrade noted by Piper Sandler.
Which company has the best grades?
Both US Foods Holding Corp. and Performance Food Group Company have received predominantly positive grades, with “Buy” and “Overweight” ratings from reputable analysts. Performance Food Group Company shows a slightly higher frequency of recent “Overweight” grades and an upgrade action, which could indicate a marginally stronger analyst confidence. This dynamic may impact investor sentiment by highlighting potential relative strength in Performance Food Group’s outlook.
Strengths and Weaknesses
Below is a comparison table highlighting the key strengths and weaknesses of US Foods Holding Corp. (USFD) and Performance Food Group Company (PFGC) based on their recent financial and operational data.
| Criterion | US Foods Holding Corp. (USFD) | Performance Food Group Company (PFGC) |
|---|---|---|
| Diversification | Broad product range with multiple product categories generating stable revenue streams. | Strong segment diversification including Convenience, Foodservice, Specialty with significant revenue contributions. |
| Profitability | Slightly favorable ROIC trend with 8.02% ROIC, but net margin low at 1.3%, indicating slim profitability. | Lower ROIC at 4.32% and net margin at 0.54%, with an unfavorable profitability profile. |
| Innovation | Moderate innovation, with steady revenue growth across products but lacks clear competitive advantage yet. | Innovation impact unclear; profitability challenges suggest room for improvement in operational efficiency. |
| Global presence | Primarily focused on U.S. market with strong asset turnover indicating efficient operations. | Also mainly U.S.-focused but with larger scale in Foodservice; debt levels and interest coverage less favorable. |
| Market Share | Solid asset turnover and product sales growth indicate stable market presence. | Larger sales volumes in key segments but higher debt and weaker profitability could pressure market position. |
Key takeaways: US Foods shows improving profitability with efficient asset use but faces margin pressures, while Performance Food Group operates at a larger scale but struggles with lower returns and profitability. Investors should weigh growth potential against financial risks carefully.
Risk Analysis
Below is a risk comparison table for US Foods Holding Corp. (USFD) and Performance Food Group Company (PFGC) based on the most recent 2025-2026 data:
| Metric | US Foods Holding Corp. (USFD) | Performance Food Group Company (PFGC) |
|---|---|---|
| Market Risk | Beta 1.03, moderate volatility | Beta 0.93, slightly less volatile |
| Debt level | D/E 1.2 (unfavorable), debt/asset 40.4% (neutral) | D/E 1.79 (unfavorable), debt/asset 44.7% (neutral) |
| Regulatory Risk | Moderate, food distribution compliance | Moderate, diverse product regulation |
| Operational Risk | Medium, large scale logistics and distribution | Medium-high, more segments and complexity |
| Environmental Risk | Moderate, supply chain sustainability focus | Moderate, similar industry challenges |
| Geopolitical Risk | US-focused, limited direct exposure | US-focused, limited direct exposure |
The most likely and impactful risks for both firms are related to their elevated debt levels, with PFGC carrying higher leverage, increasing financial vulnerability. Market risk is moderate with USFD slightly more exposed to volatility. Operational complexity and regulatory compliance remain ongoing challenges in food distribution. Both companies maintain safe Altman Z-scores, indicating reasonable financial stability despite these risks.
Which Stock to Choose?
US Foods Holding Corp. (USFD) shows a favorable income evolution with 65.5% revenue growth over 2020-2024 and improving profitability metrics, despite some recent margin declines. Its financial ratios are slightly unfavorable overall, with a moderate return on equity of 10.9% and a net debt to EBITDA of 3.85. The company holds a very favorable B- rating but carries some leverage concerns.
Performance Food Group Company (PFGC) demonstrates strong income growth of 108.2% over 2021-2025 and solid profit expansion, though profitability ratios remain less robust than USFD’s. Financial ratios are mostly unfavorable, including a lower ROE of 7.6% and a higher net debt to EBITDA of 5.16. PFGC has a very favorable C+ rating but faces challenges in margin stability and leverage.
Investors seeking growth potential might find PFGC’s higher revenue and net income growth appealing, while those prioritizing profitability and a more balanced financial profile could view USFD’s improving income statement and slightly better rating as advantageous. The choice could depend on tolerance for leverage and preference for margin stability versus growth trajectory.
Disclaimer: Investment carries a risk of loss of initial capital. The past performance is not a reliable indicator of future results. Be sure to understand risks before making an investment decision.
Go Further
I encourage you to read the complete analyses of US Foods Holding Corp. and Performance Food Group Company to enhance your investment decisions: