Home > Comparison > Consumer Defensive > SYY vs PFGC
The strategic rivalry between Sysco Corporation and Performance Food Group Company defines the current trajectory of the food distribution sector. Sysco operates as a capital-intensive global giant with extensive distribution facilities, while Performance Food Group emphasizes value-added services and a diversified clientele. This head-to-head contrasts scale with service innovation. This analysis will clarify which corporate path offers superior risk-adjusted returns for a diversified portfolio in 2026.
Table of contents
Companies Overview
Sysco Corporation and Performance Food Group Company anchor the U.S. food distribution market with distinct scale and reach.
Sysco Corporation: The Global Foodservice Giant
Sysco dominates as a global food distributor with a $40.6B market cap. Its core revenue comes from delivering a vast portfolio of food and non-food products to restaurants, hospitals, and schools. In 2026, Sysco emphasizes expanding its international operations while optimizing its 343 distribution facilities to enhance supply chain efficiency.
Performance Food Group Company: The Agile Foodservice Specialist
Performance Food Group positions itself as a nimble U.S.-focused food distributor valued at $13.7B. It generates revenue by marketing frozen foods, groceries, and health products alongside value-added services like menu development. The company’s 2026 strategy targets broadening service offerings to independent restaurants and institutional clients, leveraging operational agility to capture niche market segments.
Strategic Collision: Similarities & Divergences
Both companies compete fiercely in the foodservice distribution arena but diverge in scale and approach. Sysco pursues a broad, global footprint with extensive infrastructure, while Performance Food Group prioritizes specialized U.S. market penetration and customized services. Their battle centers on serving diverse foodservice clients efficiently. Investors will find Sysco a stable blue-chip while Performance Food Group offers growth potential with higher operational flexibility.
Income Statement Comparison
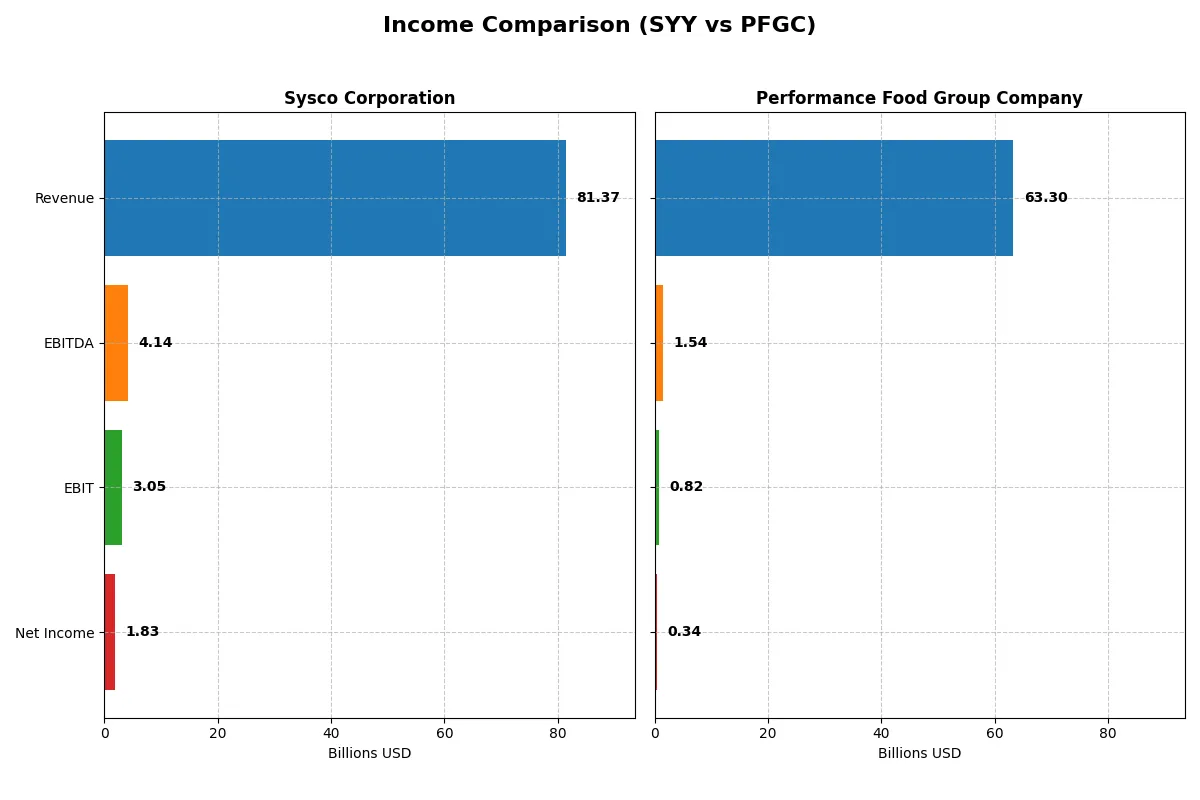
This data dissects the core profitability and scalability of both corporate engines to reveal who dominates the bottom line:
| Metric | Sysco Corporation (SYY) | Performance Food Group Company (PFGC) |
|---|---|---|
| Revenue | 81.4B | 63.3B |
| Cost of Revenue | 66.4B | 55.9B |
| Operating Expenses | 11.9B | 6.6B |
| Gross Profit | 14.97B | 7.42B |
| EBITDA | 4.14B | 1.54B |
| EBIT | 3.05B | 816M |
| Interest Expense | 635M | 358M |
| Net Income | 1.83B | 340M |
| EPS | 3.74 | 2.20 |
| Fiscal Year | 2025 | 2025 |
Income Statement Analysis: The Bottom-Line Duel
This income statement comparison reveals which company operates its business engine with greater efficiency and sustainable profit generation.
Sysco Corporation Analysis
Sysco’s revenue climbed steadily from $51.3B in 2021 to $81.4B in 2025, with net income rising from $524M to $1.83B. Gross and net margins remain stable at 18.4% and 2.25%, respectively. Despite a slight net margin dip recently, Sysco shows strong long-term growth and solid margin control, though operating expenses growing faster than revenue signal caution.
Performance Food Group Company Analysis
Performance Food Group doubled revenue from $30.4B in 2021 to $63.3B in 2025, with net income surging from $41M to $340M. Gross margin holds near 11.7%, but net margin remains thin at 0.54%. Recent one-year earnings and margin contractions contrast with robust multi-year growth, reflecting ongoing challenges in converting scale into profitability.
Margin Stability vs. Rapid Scale Expansion
Sysco maintains superior net income and healthier margins despite slower revenue growth, highlighting operational efficiency. In contrast, Performance Food Group boasts impressive top-line gains but struggles with consistent profitability. For investors prioritizing stable earnings and margin resilience, Sysco offers a more attractive profile in this competitive landscape.
Financial Ratios Comparison
These vital ratios act as a diagnostic tool to expose the underlying fiscal health, valuation premiums, and capital efficiency of the companies compared below:
| Ratios | Sysco Corporation (SYY) | Performance Food Group Company (PFGC) |
|---|---|---|
| ROE | 100.0% | 7.6% |
| ROIC | 13.0% | 4.4% |
| P/E | 20.0 | 39.8 |
| P/B | 20.0 | 3.0 |
| Current Ratio | 1.21 | 1.58 |
| Quick Ratio | 0.70 | 0.72 |
| D/E (Debt-to-Equity) | 7.92 | 1.79 |
| Debt-to-Assets | 54.1% | 44.7% |
| Interest Coverage | 4.86 | 2.28 |
| Asset Turnover | 3.04 | 3.54 |
| Fixed Asset Turnover | 11.28 | 11.74 |
| Payout ratio | 54.7% | 0% |
| Dividend yield | 2.73% | 0% |
| Fiscal Year | 2025 | 2025 |
Efficiency & Valuation Duel: The Vital Signs
Financial ratios act as the company’s DNA, revealing hidden risks and operational excellence vital to assessing investment potential.
Sysco Corporation
Sysco demonstrates strong profitability with a remarkable 99.9% ROE and a solid 13.0% ROIC, both well above WACC at 5.85%. The valuation appears fair with a P/E of 20.0, though the elevated P/B of 20.0 signals caution. Dividend yield at 2.73% rewards shareholders steadily, reflecting disciplined capital allocation.
Performance Food Group Company
Performance Food Group shows weak profitability, with a low 7.6% ROE and 4.4% ROIC, both below or near WACC of 6.33%. The stock trades expensive at a P/E of 39.8 and lacks dividend payments, relying on uncertain reinvestment strategies. Higher current ratio at 1.58 contrasts with stretched debt metrics, raising financial risk concerns.
Premium Valuation vs. Operational Safety
Sysco balances strong returns and reasonable valuation, presenting a more stable risk-reward profile. In contrast, Performance Food Group’s expensive valuation and weaker profitability raise red flags. Conservative investors may prefer Sysco’s operational strength, while risk-tolerant investors might find PFGC’s growth potential more speculative.
Which one offers the Superior Shareholder Reward?
I compare Sysco Corporation (SYY) and Performance Food Group Company (PFGC) on dividends, payout ratios, and buybacks. SYY yields 2.7%-2.8% with a payout ratio around 52%-55%, showing solid free cash flow coverage (66%-72%). It also executes consistent buybacks, enhancing total returns. PFGC pays no dividend but invests heavily in growth and acquisitions, with free cash flow reinvested. PFGC’s leverage is lower, and it trades at a more attractive price-to-book ratio (~2.5 vs. ~20 for SYY), supporting value creation through capital allocation. However, SYY’s balanced distribution—dividends plus buybacks—offers a more sustainable and reliable shareholder reward in 2026. I favor Sysco for total return investors seeking income and capital discipline.
Comparative Score Analysis: The Strategic Profile
The radar chart reveals the fundamental DNA and trade-offs of Sysco Corporation and Performance Food Group Company, highlighting their financial strengths and weaknesses:
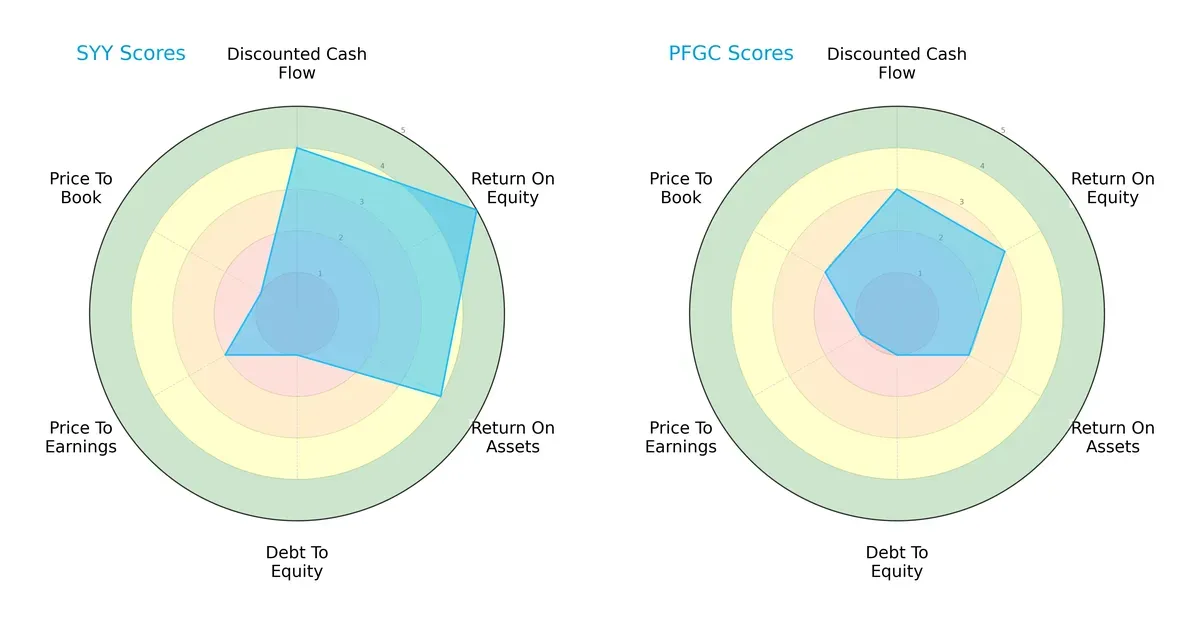
Sysco dominates in profitability metrics with higher ROE (5 vs. 3) and ROA (4 vs. 2) scores, indicating superior asset utilization and shareholder returns. Both firms share weak debt management (score 1 each), signaling elevated financial risk. Performance Food Group shows a slight edge in price-to-book valuation (2 vs. 1), suggesting marginally better market pricing relative to book value. Overall, Sysco presents a more balanced profile, leveraging operational efficiency, whereas Performance Food Group relies on modest valuation advantages.
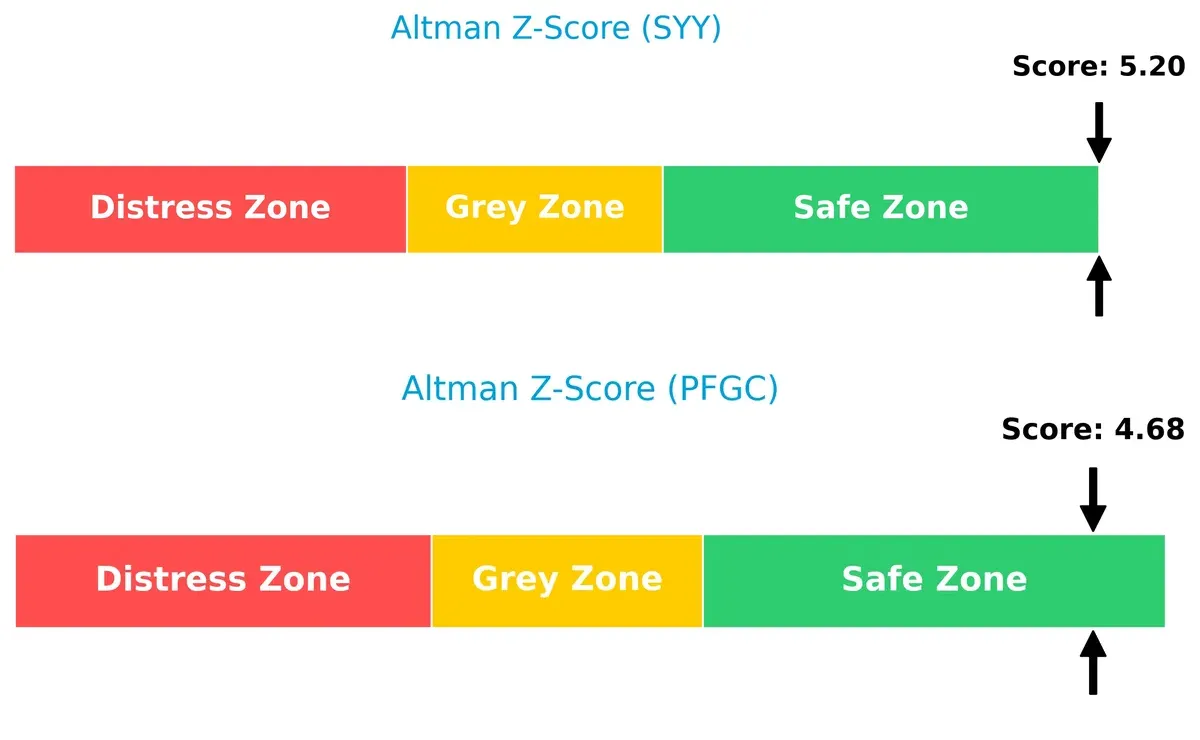
Bankruptcy Risk: Solvency Showdown
Sysco’s Altman Z-Score of 5.20 surpasses Performance Food Group’s 4.68, both firmly in the safe zone, signaling robust financial health and low bankruptcy risk in this cycle:
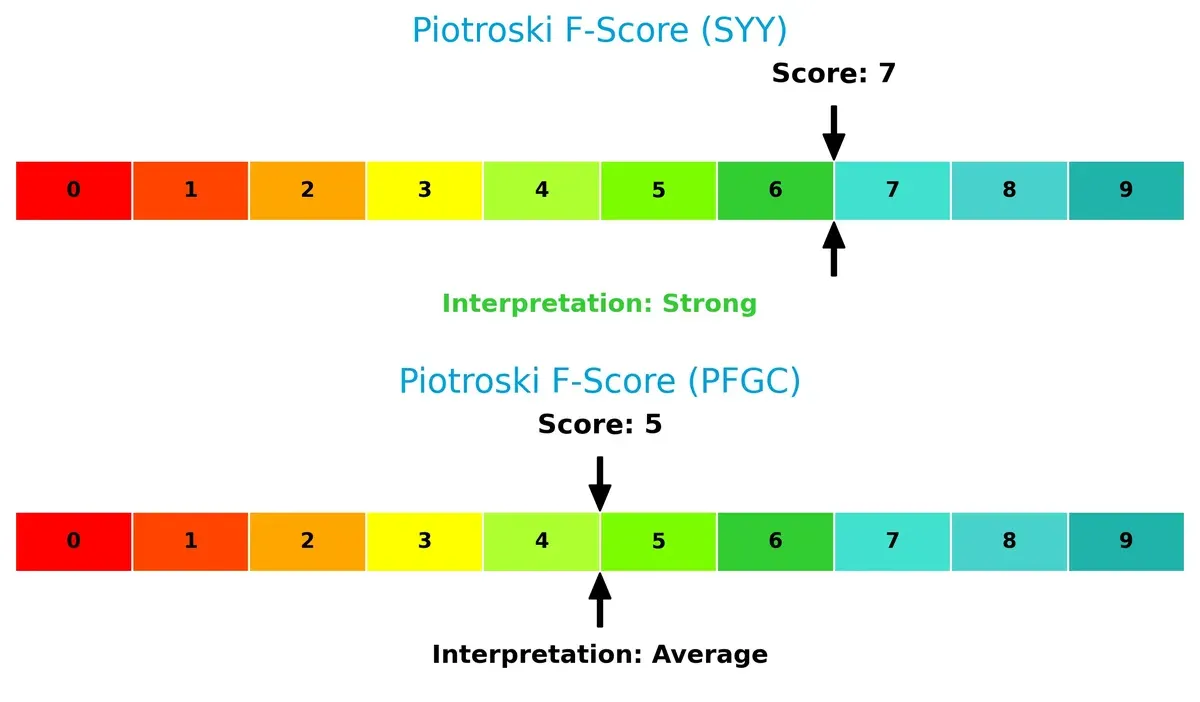
Financial Health: Quality of Operations
Sysco leads with a strong Piotroski F-Score of 7, indicating solid internal financial health, while Performance Food Group’s average score of 5 suggests moderate strength but potential red flags:
How are the two companies positioned?
This section dissects the operational DNA of Sysco and Performance Food Group by comparing their revenue distribution and internal dynamics. The goal is to confront their economic moats and identify which model offers the most resilient, sustainable advantage today.
Revenue Segmentation: The Strategic Mix
The following visual comparison dissects how Sysco Corporation and Performance Food Group Company diversify their income streams and where their primary sector bets lie:
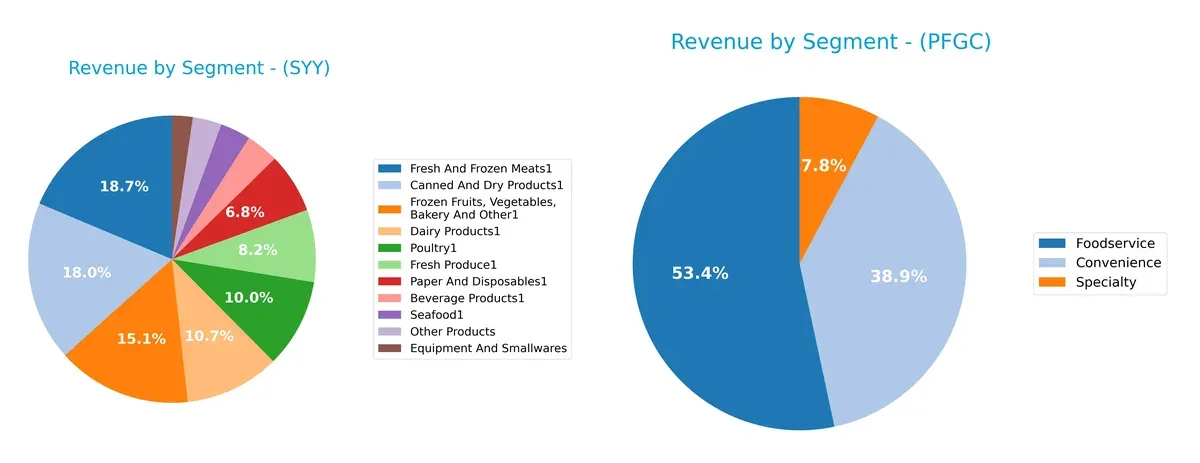
Sysco spreads revenue across many food categories, with Fresh and Frozen Meats1 anchoring at $15.2B and Canned and Dry Products1 close behind at $14.6B. Performance Food Group pivots mostly on two dominant segments: Foodservice at $33.6B and Convenience at $24.5B, with Specialty trailing at $4.9B. Sysco’s diversified portfolio reduces concentration risk, while PFGC’s heavy reliance on broad segments suggests strong ecosystem control but higher vulnerability to sector shifts.
Strengths and Weaknesses Comparison
This table compares the strengths and weaknesses of Sysco Corporation and Performance Food Group Company:
Sysco Strengths
- Diverse product range across multiple food categories
- Strong U.S. and international foodservice presence
- Favorable ROE and ROIC indicating efficient capital use
- Solid asset turnover ratios
- Dividend yield of 2.73%
Performance Food Group Strengths
- Significant revenue from Convenience and Foodservice segments
- Favorable current ratio suggests good short-term liquidity
- Favorable asset and fixed asset turnover ratios
- WACC below ROIC indicates positive value creation
Sysco Weaknesses
- Low net margin at 2.25%
- High debt levels with debt-to-assets at 54.13%
- Weak quick ratio of 0.7 signals liquidity concerns
- Unfavorable PB ratio at 20.01
- Neutral interest coverage ratio
Performance Food Group Weaknesses
- Very low net margin at 0.54%
- Unfavorable ROE and ROIC below WACC
- High PE ratio of 39.8 reflects possible overvaluation
- No dividend yield
- Lower interest coverage ratio at 2.28
Sysco shows operational efficiency and diversified revenue streams but carries leverage and liquidity risks. Performance Food Group has liquidity strengths but struggles with profitability and capital returns, impacting its valuation.
The Moat Duel: Analyzing Competitive Defensibility
A structural moat alone shields long-term profits from relentless competition and market disruption. Let’s dissect the moats protecting Sysco and Performance Food Group:
Sysco Corporation: Scale and Distribution Network Moat
Sysco’s vast U.S. and international distribution network drives its competitive edge. This scale yields a high ROIC 7.2% above WACC and margin stability. Expansion into new markets and product lines in 2026 should deepen this moat.
Performance Food Group Company: Operational Efficiency and Growth Moat
PFGC leans on operational improvements and revenue growth to compete. Unlike Sysco’s scale moat, PFGC currently sheds value with ROIC below WACC but shows a rising ROIC trend. Its aggressive expansion signals potential moat strengthening.
Scale Dominance vs. Growth Trajectory: Who Defends Better?
Sysco’s wider, well-established distribution moat offers stronger profit protection than PFGC’s emerging but unprofitable moat. Sysco is better positioned to defend market share amid intensifying foodservice competition in 2026.
Which stock offers better returns?
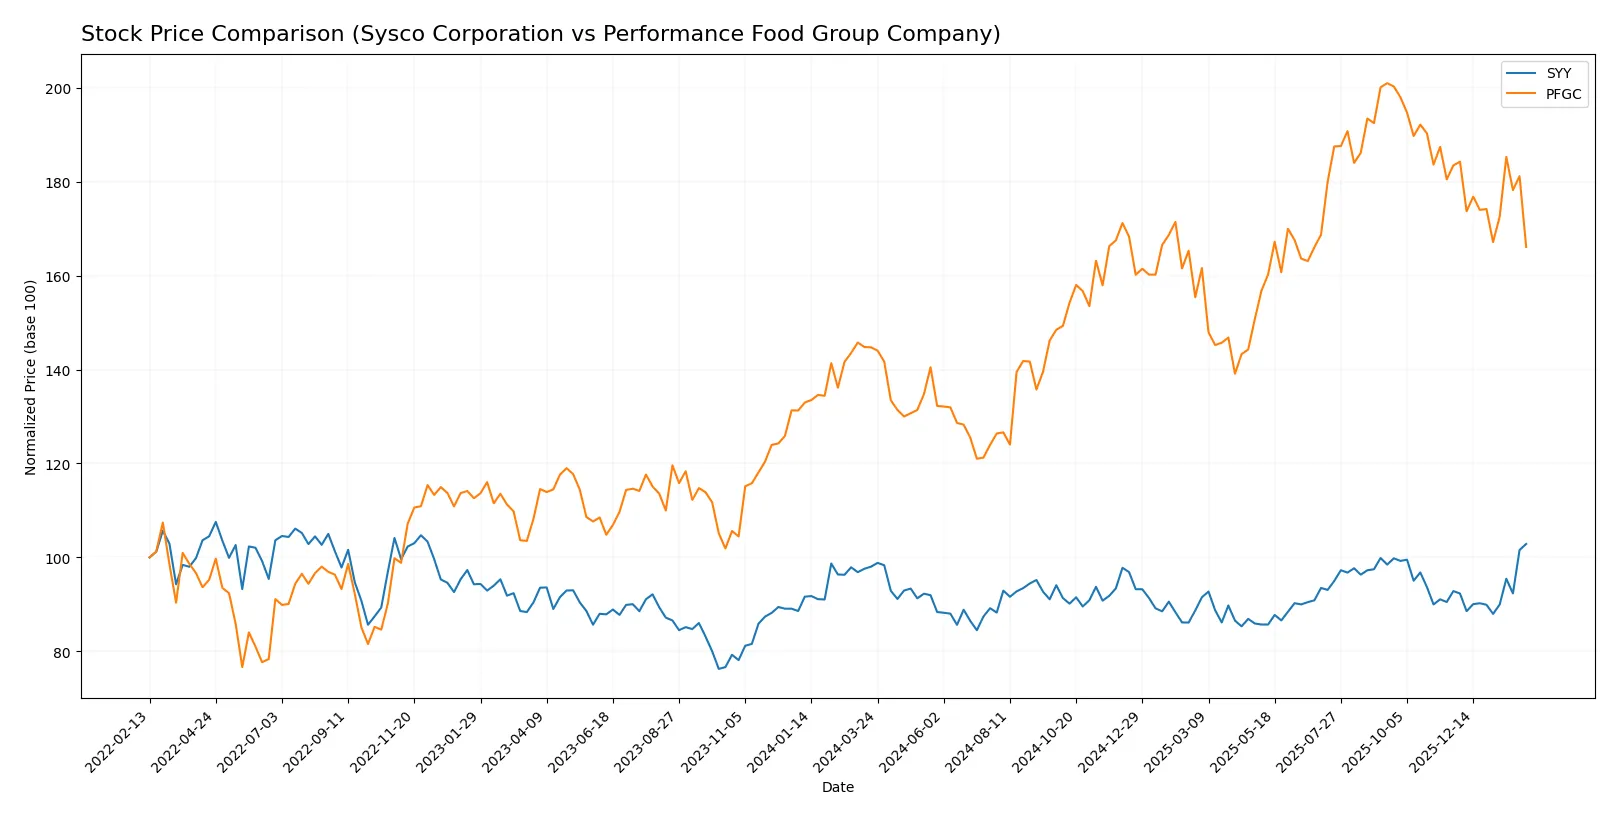
The past year shows distinct price trajectories for Sysco Corporation and Performance Food Group Company, revealing contrasting momentum and volatility patterns.
Trend Comparison
Sysco Corporation’s stock gained 4.94% over the past year, showing a bullish trend with accelerating momentum. It ranged between 69.75 and 84.92, with moderate volatility (3.37 std deviation).
Performance Food Group’s stock rose 14.77% over the same period, also bullish but with decelerating momentum. It experienced higher volatility (11.4 std deviation) and a wider price band from 63.74 to 105.88.
Performance Food Group delivered stronger overall returns but with greater volatility. Sysco’s trend accelerates, while Performance Food Group shows recent deceleration.
Target Prices
Analysts present a confident upside for Sysco Corporation and Performance Food Group Company based on consensus targets.
| Company | Target Low | Target High | Consensus |
|---|---|---|---|
| Sysco Corporation | 83 | 95 | 90.14 |
| Performance Food Group Company | 105 | 130 | 117 |
The consensus target for Sysco at 90.14 suggests modest upside from the current 84.84 price. Performance Food Group’s 117 target implies significant appreciation potential above its 87.48 share price.

Don’t Let Luck Decide Your Entry Point
Optimize your entry points with our advanced ProRealTime indicators. You’ll get efficient buy signals with precise price targets for maximum performance. Start outperforming now!
How do institutions grade them?
Here is a summary of the latest institutional grades for Sysco Corporation and Performance Food Group Company:
Sysco Corporation Grades
This table shows recent grades and recommendations from top financial institutions for Sysco Corporation.
| Grading Company | Action | New Grade | Date |
|---|---|---|---|
| Guggenheim | Maintain | Buy | 2026-01-29 |
| JP Morgan | Maintain | Overweight | 2026-01-28 |
| Barclays | Maintain | Overweight | 2026-01-28 |
| Jefferies | Maintain | Buy | 2026-01-28 |
| Truist Securities | Maintain | Buy | 2026-01-28 |
| UBS | Maintain | Buy | 2026-01-28 |
| Wells Fargo | Maintain | Overweight | 2026-01-28 |
| Citigroup | Maintain | Neutral | 2026-01-28 |
| Piper Sandler | Maintain | Neutral | 2026-01-28 |
| Morgan Stanley | Maintain | Equal Weight | 2026-01-20 |
Performance Food Group Company Grades
Below is a snapshot of recent grades and recommendations from reputable institutions for Performance Food Group Company.
| Grading Company | Action | New Grade | Date |
|---|---|---|---|
| Citigroup | Maintain | Buy | 2026-01-07 |
| Barclays | Maintain | Overweight | 2026-01-07 |
| Piper Sandler | Maintain | Overweight | 2025-12-12 |
| Piper Sandler | Maintain | Overweight | 2025-11-10 |
| Barclays | Maintain | Overweight | 2025-11-06 |
| Barclays | Maintain | Overweight | 2025-10-22 |
| Piper Sandler | Upgrade | Overweight | 2025-09-02 |
| Guggenheim | Maintain | Buy | 2025-08-26 |
| Truist Securities | Maintain | Buy | 2025-08-14 |
| Wells Fargo | Maintain | Overweight | 2025-08-14 |
Which company has the best grades?
Sysco Corporation generally receives strong buy and overweight ratings with multiple institutions maintaining positive views in early 2026. Performance Food Group also shows predominantly overweight and buy grades but with fewer recent updates. The heavier recent coverage and consensus “buy” or “overweight” ratings for Sysco suggest stronger institutional confidence, which may influence investor sentiment and portfolio positioning.
Risks specific to each company
The following categories pinpoint the critical pressure points and systemic threats facing Sysco Corporation and Performance Food Group Company in the 2026 market environment:
1. Market & Competition
Sysco Corporation
- Large market cap (40.6B) offers scale advantages but faces intense competition in food distribution.
Performance Food Group Company
- Smaller market cap (13.7B) limits scale; competes aggressively with Sysco and regional distributors.
2. Capital Structure & Debt
Sysco Corporation
- High debt-to-assets ratio (54.13%) and debt/equity of 7.92 signal leverage risk despite solid coverage.
Performance Food Group Company
- Lower debt-to-assets (44.72%) and moderate debt/equity (1.79) suggest better balance sheet stability.
3. Stock Volatility
Sysco Corporation
- Low beta (0.60) implies less volatility and defensive market behavior.
Performance Food Group Company
- Higher beta (0.91) shows greater stock price volatility and market sensitivity.
4. Regulatory & Legal
Sysco Corporation
- Operates internationally, increasing exposure to diverse regulatory environments.
Performance Food Group Company
- Primarily US-focused, limiting regulatory complexity but subject to domestic food safety and labor laws.
5. Supply Chain & Operations
Sysco Corporation
- Extensive network with 343 facilities supports resilience but adds complexity and operational costs.
Performance Food Group Company
- Smaller footprint may reduce complexity but limits operational flexibility and bargaining power.
6. ESG & Climate Transition
Sysco Corporation
- Increasing ESG focus, but large scale may slow adaptation to climate initiatives.
Performance Food Group Company
- ESG efforts less publicized; potential risk of lagging behind peers in climate transition.
7. Geopolitical Exposure
Sysco Corporation
- International operations expose it to geopolitical risks, currency fluctuations, and trade policies.
Performance Food Group Company
- Mostly domestic exposure reduces geopolitical risk but increases vulnerability to US policy shifts.
Which company shows a better risk-adjusted profile?
Sysco’s biggest risk lies in its high leverage and international exposure that could amplify market shocks. Performance Food Group struggles with weaker profitability and greater stock volatility, raising concerns about operational efficiency. Overall, Sysco presents a better risk-adjusted profile, supported by its strong Altman Z-Score (5.2) and Piotroski Score (7), signaling financial robustness despite debt levels. Performance Food Group’s lower scores and recent stock decline (-9.9%) illustrate heightened vulnerability, justifying cautious positioning.
Final Verdict: Which stock to choose?
Sysco Corporation’s superpower lies in its robust capital efficiency and strong economic moat, demonstrated by a ROIC comfortably above its WACC. It commands a high return on equity and a solid dividend yield, making it a dependable cash generator. A point of vigilance remains its elevated leverage, which might amplify risks in a tightening credit environment. Sysco suits portfolios seeking stable, value-creating exposure with moderate growth.
Performance Food Group stands out with an operational moat grounded in efficient asset utilization and a lean cost structure, reflected in its superior asset turnover ratios. It carries less financial stability than Sysco, with a higher debt burden and weaker profitability metrics. However, its impressive revenue growth and improving profitability signal potential upside. PFGC fits growth-at-a-reasonable-price strategies willing to accept higher volatility for expansion prospects.
If you prioritize resilient value creation and stable income, Sysco outshines as the compelling choice due to its strong moat and consistent profitability. However, if you seek higher growth potential with a tolerance for financial risk, Performance Food Group offers superior topline momentum and operational leverage. Both scenarios demand close monitoring of leverage and margin trends to manage downside risk prudently.
Disclaimer: Investment carries a risk of loss of initial capital. The past performance is not a reliable indicator of future results. Be sure to understand risks before making an investment decision.
Go Further
I encourage you to read the complete analyses of Sysco Corporation and Performance Food Group Company to enhance your investment decisions: