In today’s dynamic software landscape, Workday, Inc. and Perfect Corp. stand out with distinct yet overlapping innovation strategies. Both operate in the software application industry, with Workday focusing on enterprise cloud solutions for finance and HR, while Perfect Corp. leads in AI-driven beauty and fashion tech. This comparison explores their market approaches, growth potential, and risks to help you identify the most compelling investment opportunity. Let’s dive in and assess which company fits best in your portfolio.
Table of contents
Companies Overview
I will begin the comparison between Workday and Perfect Corp. by providing an overview of these two companies and their main differences.
Workday Overview
Workday, Inc. is a US-based technology company specializing in enterprise cloud applications that support financial management, human capital management, and analytics. Serving diverse industries including healthcare, education, and retail, Workday’s mission is to enable businesses to plan, execute, and analyze operations efficiently through integrated cloud solutions. With a market cap of approximately 49.9B USD, it holds a strong position in the application software sector.
Perfect Corp. Overview
Perfect Corp., headquartered in Taiwan, offers SaaS solutions that integrate artificial intelligence and augmented reality for the beauty and fashion industries. Its product suite includes virtual try-on tools and AI-powered analysis for cosmetics and accessories. Founded in 2015, Perfect Corp. serves a niche market with innovative AR technologies and has a market capitalization around 179M USD, reflecting its focused scale and growth potential.
Key similarities and differences
Both companies operate in the software application industry, leveraging cloud-based technologies to deliver specialized solutions to their customers. Workday targets broad enterprise needs in finance and HR, emphasizing operational efficiency across sectors, while Perfect Corp. concentrates on AI and AR innovations for consumer-facing beauty and fashion tech. This contrast highlights their differing market scopes and technological applications despite sharing a software-driven business model.
Income Statement Comparison
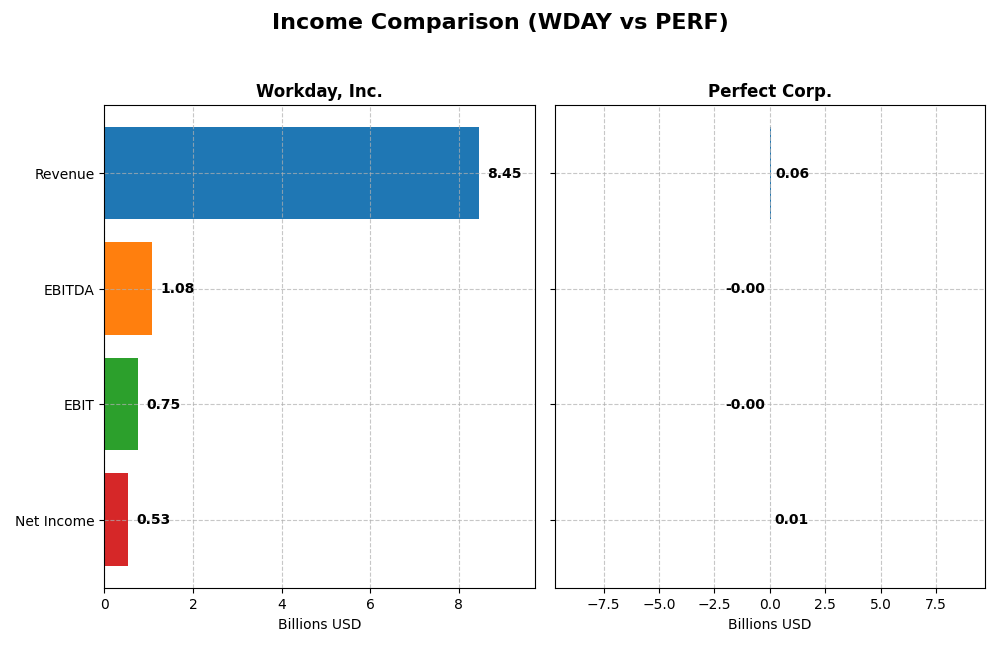
This table compares key income statement metrics for Workday, Inc. and Perfect Corp. for their most recent fiscal years, providing a snapshot of their financial performance.
| Metric | Workday, Inc. (WDAY) | Perfect Corp. (PERF) |
|---|---|---|
| Market Cap | 49.9B | 179M |
| Revenue | 8.45B | 60.2M |
| EBITDA | 1.08B | -2.05M |
| EBIT | 752M | -2.84M |
| Net Income | 526M | 5.02M |
| EPS | 1.98 | 0.05 |
| Fiscal Year | 2025 | 2024 |
Income Statement Interpretations
Workday, Inc.
Workday, Inc. has shown strong revenue growth from $4.3B in 2021 to $8.4B in 2025, nearly doubling over the period. Net income turned positive after losses in early years, reaching $526M in 2025, though net margin slipped last year despite favorable gross margin at 75.5%. The latest year shows solid revenue and EBIT growth, but a decline in net margin and EPS.
Perfect Corp.
Perfect Corp. exhibited consistent revenue growth from $29.9M in 2020 to $60.2M in 2024, more than doubling in size. Net income improved significantly, reaching $5M in 2024, with a favorable net margin of 8.34%, though EBIT margin remains negative at -4.72%. The most recent year recorded revenue and gross profit growth, but EBIT and net margin declined, while EPS increased modestly.
Which one has the stronger fundamentals?
Both companies demonstrate favorable revenue and net income growth over their periods, with strong gross margins above 75%. Workday shows higher absolute figures and more robust EBIT margins, while Perfect Corp. benefits from a lower interest expense ratio and improving EPS. However, both face recent net margin declines and mixed EBIT trends, suggesting caution in evaluating their fundamentals.
Financial Ratios Comparison
The table below presents a side-by-side comparison of key financial ratios for Workday, Inc. and Perfect Corp. based on their most recent full fiscal year data.
| Ratios | Workday, Inc. (WDAY) FY 2025 | Perfect Corp. (PERF) FY 2024 |
|---|---|---|
| ROE | 5.8% | 3.4% |
| ROIC | 2.7% | -2.1% |
| P/E | 132.2 | 56.6 |
| P/B | 7.7 | 1.93 |
| Current Ratio | 1.85 | 5.52 |
| Quick Ratio | 1.85 | 5.52 |
| D/E (Debt-to-Equity) | 0.37 | 0.0035 |
| Debt-to-Assets | 18.7% | 0.28% |
| Interest Coverage | 3.64 | -449 |
| Asset Turnover | 0.47 | 0.33 |
| Fixed Asset Turnover | 5.36 | 57.94 |
| Payout Ratio | 0% | 0% |
| Dividend Yield | 0% | 0% |
Interpretation of the Ratios
Workday, Inc.
Workday shows a mixed ratio profile with favorable liquidity and leverage metrics, including a current ratio of 1.85 and debt-to-equity of 0.37, indicating solid short-term financial health and moderate leverage. However, profitability indicators such as return on equity (5.82%) and return on invested capital (2.73%) are unfavorable, alongside a high price-to-earnings ratio of 132.15, suggesting valuation concerns. The company does not pay dividends, reflecting a potential focus on reinvestment and growth.
Perfect Corp.
Perfect Corp. presents a slightly unfavorable ratio profile, marked by weak profitability with a return on equity of 3.42% and negative return on invested capital (-2.1%). The firm benefits from a low debt load and strong quick ratio of 5.52, but suffers from a highly negative interest coverage ratio, signaling potential financial stress. Like Workday, Perfect Corp. does not pay dividends, likely prioritizing reinvestment in development and innovation.
Which one has the best ratios?
Workday exhibits a more balanced ratio set with better liquidity and leverage metrics, despite some profitability and valuation weaknesses. Perfect Corp. shows stronger asset turnover but faces more serious challenges with profitability and interest coverage. Overall, Workday’s ratios suggest a relatively more stable financial position compared to Perfect Corp.’s slightly unfavorable profile.
Strategic Positioning
This section compares the strategic positioning of Workday and Perfect Corp., including market position, key segments, and exposure to technological disruption:
Workday, Inc.
- Large market cap of 49.9B; faces competitive pressure in enterprise cloud software.
- Focuses on enterprise cloud applications with subscription and professional services driving growth.
- Faces technological disruption through AI and machine learning integration in cloud services.
Perfect Corp.
- Smaller market cap of 179M; operates in niche AI and AR beauty tech market.
- Specializes in SaaS AI and AR solutions for beauty and fashion sectors.
- Relies heavily on AI and AR innovation to maintain technological edge.
Workday vs Perfect Corp. Positioning
Workday exhibits a diversified business model with broad enterprise cloud applications, while Perfect Corp. concentrates exclusively on AI and AR in beauty tech. Workday’s scale offers stability; Perfect’s niche focus may allow faster innovation but limits market breadth.
Which has the best competitive advantage?
Both companies are slightly unfavorable in moat evaluation, shedding value despite growing ROIC. Neither currently demonstrates a strong sustainable competitive advantage based on capital efficiency and profitability metrics.
Stock Comparison
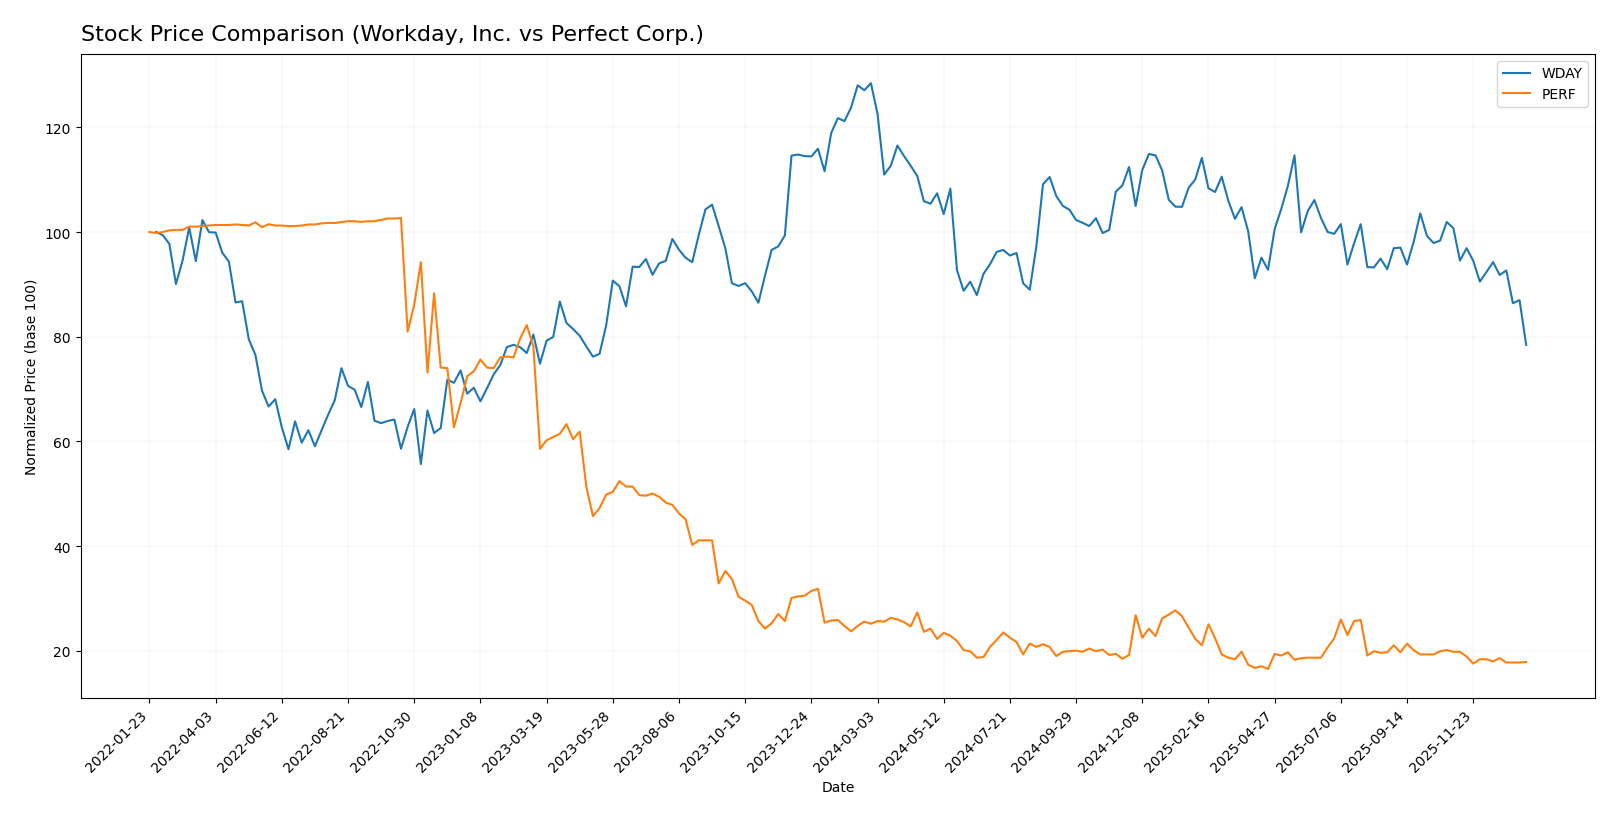
The stock price movements of Workday, Inc. (WDAY) and Perfect Corp. (PERF) over the past 12 months reveal sustained bearish trends with significant declines, highlighted by notable price volatility and decelerating downward momentum.
Trend Analysis
Workday, Inc. experienced a bearish trend over the past year with a price decline of -38.91%, marked by high volatility (std deviation 20.22) and a deceleration in the downward trend. The stock’s highest and lowest prices were 305.88 and 186.86 respectively.
Perfect Corp. also showed a bearish trend with a -28.98% price decrease over the same period, accompanied by very low volatility (std deviation 0.27) and a decelerating decline. Its price ranged between 2.7 and 1.61.
Comparing both, Workday’s stock delivered a larger negative market performance than Perfect Corp., reflecting a more pronounced bearish trend and greater price variability.
Target Prices
The target price consensus for the analyzed companies shows a moderate upside potential based on current valuations.
| Company | Target High | Target Low | Consensus |
|---|---|---|---|
| Workday, Inc. | 320 | 235 | 274.47 |
| Perfect Corp. | 7 | 7 | 7 |
Analysts expect Workday’s stock to appreciate significantly from its current price of 186.86 USD, with targets suggesting a range between 235 and 320 USD. Perfect Corp’s target price at 7 USD is substantially higher than its current 1.74 USD, indicating strong growth expectations.
Analyst Opinions Comparison
This section compares analysts’ ratings and grades for Workday, Inc. and Perfect Corp.:
Rating Comparison
WDAY Rating
- Rating: B-, considered very favorable by analysts.
- Discounted Cash Flow Score: 4, favorable valuation metric.
- ROE Score: 3, moderate efficiency in generating profit.
- ROA Score: 3, moderate asset utilization efficiency.
- Debt To Equity Score: 2, moderate financial risk.
- Overall Score: 2, moderate overall financial standing.
PERF Rating
- Rating: A-, also classified as very favorable.
- Discounted Cash Flow Score: 5, very favorable valuation.
- ROE Score: 2, moderate but lower than WDAY’s score.
- ROA Score: 3, moderate and equal to WDAY’s score.
- Debt To Equity Score: 4, favorable with lower financial risk.
- Overall Score: 4, favorable overall financial standing.
Which one is the best rated?
Based strictly on the provided data, Perfect Corp. holds a better overall rating and scores higher in discounted cash flow and debt-to-equity metrics, indicating stronger financial assessments compared to Workday, Inc.
Scores Comparison
The scores comparison between Workday, Inc. and Perfect Corp. is as follows:
WDAY Scores
- Altman Z-Score: 4.41, indicating a safe financial zone with low bankruptcy risk.
- Piotroski Score: 6, signaling average financial strength and investment quality.
PERF Scores
- Altman Z-Score: 1.31, indicating financial distress with higher bankruptcy risk.
- Piotroski Score: 6, signaling average financial strength and investment quality.
Which company has the best scores?
Based strictly on the provided data, Workday, Inc. has a better Altman Z-Score, placing it in a safer financial zone. Both companies have the same Piotroski Score of 6, reflecting average financial strength.
Grades Comparison
Here is the comparison of the latest grades and ratings for Workday, Inc. and Perfect Corp.:
Workday, Inc. Grades
The following table presents recent grades assigned to Workday, Inc. by reputable financial institutions.
| Grading Company | Action | New Grade | Date |
|---|---|---|---|
| Barclays | Maintain | Overweight | 2026-01-12 |
| RBC Capital | Maintain | Outperform | 2026-01-05 |
| TD Cowen | Maintain | Buy | 2025-11-26 |
| DA Davidson | Maintain | Neutral | 2025-11-26 |
| Wells Fargo | Maintain | Overweight | 2025-11-26 |
| Barclays | Maintain | Overweight | 2025-11-26 |
| Keybanc | Maintain | Overweight | 2025-11-26 |
| Citigroup | Maintain | Neutral | 2025-11-26 |
| JP Morgan | Maintain | Overweight | 2025-11-26 |
| UBS | Maintain | Neutral | 2025-11-26 |
Workday’s grades predominantly indicate a favorable outlook, with a strong consensus around “Buy” and multiple “Overweight” and “Outperform” ratings.
Perfect Corp. Grades
Here are the recent grades given to Perfect Corp. by recognized grading firms.
| Grading Company | Action | New Grade | Date |
|---|---|---|---|
| Piper Sandler | Maintain | Neutral | 2024-02-29 |
| Goldman Sachs | Maintain | Neutral | 2023-10-26 |
| Piper Sandler | Maintain | Neutral | 2023-10-25 |
| Piper Sandler | Maintain | Neutral | 2023-07-26 |
| Piper Sandler | Maintain | Neutral | 2023-07-25 |
| Piper Sandler | Maintain | Neutral | 2023-04-27 |
Perfect Corp.’s ratings are mostly neutral, with no recent upgrades or downgrades, reflecting a cautious stance from analysts.
Which company has the best grades?
Workday, Inc. holds clearly better grades than Perfect Corp., with a consensus rating of “Buy” versus “Hold” for Perfect Corp. This difference suggests stronger analyst confidence in Workday’s outlook, which may influence investor sentiment and portfolio decisions accordingly.
Strengths and Weaknesses
Below is a comparison of key strengths and weaknesses for Workday, Inc. (WDAY) and Perfect Corp. (PERF) based on the most recent financial and operational data.
| Criterion | Workday, Inc. (WDAY) | Perfect Corp. (PERF) |
|---|---|---|
| Diversification | Moderate: Strong subscription services with growing professional services | Limited: No reported revenue segmentation data available |
| Profitability | Neutral net margin (6.23%), but unfavorable ROIC (2.73%) and ROE (5.82%) | Neutral net margin (8.34%), but negative ROIC (-2.1%) and low ROE (3.42%) |
| Innovation | High fixed asset turnover (5.36) indicating good asset utilization | Very high fixed asset turnover (57.94), suggesting efficient use of fixed assets |
| Global presence | Established global presence with steady revenue growth in subscription services | Smaller scale with limited data, but growing profitability trend |
| Market Share | Strong in cloud-based financial and HR software markets | Emerging player with smaller market footprint |
Key takeaways: Both companies show improving profitability trends but are currently shedding value as ROIC remains below WACC. Workday benefits from diversified revenue streams and global reach, while Perfect Corp. demonstrates high asset efficiency but lacks revenue diversification data. Investors should watch for continued ROIC improvements before considering investment.
Risk Analysis
Below is a comparative table presenting key risk metrics for Workday, Inc. (WDAY) and Perfect Corp. (PERF) as of the most recent fiscal years.
| Metric | Workday, Inc. (WDAY) | Perfect Corp. (PERF) |
|---|---|---|
| Market Risk | Beta 1.14 (moderate volatility) | Beta 0.45 (low volatility) |
| Debt level | Debt/Equity 0.37 (low debt) | Debt/Equity 0.00 (no debt) |
| Regulatory Risk | Moderate (US tech regulations) | Moderate (Taiwanese and global tech regulations) |
| Operational Risk | Moderate (complex SaaS operations) | Moderate (AI/AR tech dependency) |
| Environmental Risk | Low (software sector impact) | Low (software sector impact) |
| Geopolitical Risk | Moderate (US policies, global markets) | Elevated (Taiwan-China tensions) |
The most impactful risks differ: Workday faces moderate market and operational risks with a solid balance sheet, while Perfect Corp. shows financial distress signs (Altman Z-score in distress zone) and geopolitical exposure due to its Taiwanese base, which investors should monitor closely.
Which Stock to Choose?
Workday, Inc. (WDAY) shows favorable income growth with a 16.35% revenue increase in 2025 and strong gross margins at 75.5%. Despite neutral profitability ratios and some unfavorable leverage and valuation metrics, it maintains a solid current ratio and moderate debt levels, earning a “B-” rating with a very favorable overall assessment.
Perfect Corp. (PERF) delivered 12.52% revenue growth in 2024 and a favorable gross margin near 78%. While facing slightly unfavorable return metrics and negative ROIC versus WACC, it benefits from low debt and a strong quick ratio. PERF holds an “A-” rating, reflecting a slightly unfavorable global ratio view but favorable discounted cash flow and valuation scores.
Investors prioritizing growth and solid income statement trends might find Workday’s improving profitability and stable debt profile more appealing, while those valuing stronger ratings and lower financial risk could interpret Perfect Corp.’s metrics as more suitable. The choice could depend on risk tolerance and strategic focus, given both companies show signs of value destruction despite growing returns.
Disclaimer: Investment carries a risk of loss of initial capital. The past performance is not a reliable indicator of future results. Be sure to understand risks before making an investment decision.
Go Further
I encourage you to read the complete analyses of Workday, Inc. and Perfect Corp. to enhance your investment decisions: