In today’s fast-evolving tech landscape, Uber Technologies, Inc. and Perfect Corp. stand out as innovators within the software application industry. Uber revolutionizes urban mobility and delivery services globally, while Perfect Corp. leads in AI-driven beauty and fashion tech solutions. Both companies harness cutting-edge technology to disrupt traditional markets, making this an insightful comparison for investors. Let’s explore which company offers the most compelling investment opportunity.
Table of contents
Companies Overview
I will begin the comparison between Uber Technologies, Inc. and Perfect Corp. by providing an overview of these two companies and their main differences.
Uber Technologies, Inc. Overview
Uber Technologies, Inc. operates proprietary technology applications connecting consumers with independent providers of ride services, food delivery, and freight logistics across multiple global regions. Founded in 2009 and headquartered in San Francisco, Uber segments its business into Mobility, Delivery, and Freight, offering a diverse platform that integrates transport solutions and delivery services. The company is a major player in the software application industry with a market cap of $176B.
Perfect Corp. Overview
Perfect Corp. specializes in SaaS artificial intelligence and augmented reality solutions for the beauty and fashion tech industry. Founded in 2015 and based in New Taipei City, Taiwan, the company offers a range of virtual try-on and AI-powered analysis tools through its YouCam applications. With a market cap of $179M, Perfect Corp. provides innovative digital experiences focused on personal care and style enhancements.
Key similarities and differences
Both companies operate in the software application industry and leverage technology to connect users with services, but their business models diverge significantly. Uber focuses on mobility, delivery, and logistics platforms serving global transportation and food sectors, whereas Perfect Corp. concentrates on AI-driven virtual try-on and beauty tech solutions targeting consumer engagement in fashion and cosmetics. The scale and market presence also differ markedly, with Uber commanding a multi-billion dollar valuation compared to Perfect Corp.’s smaller market capitalization.
Income Statement Comparison
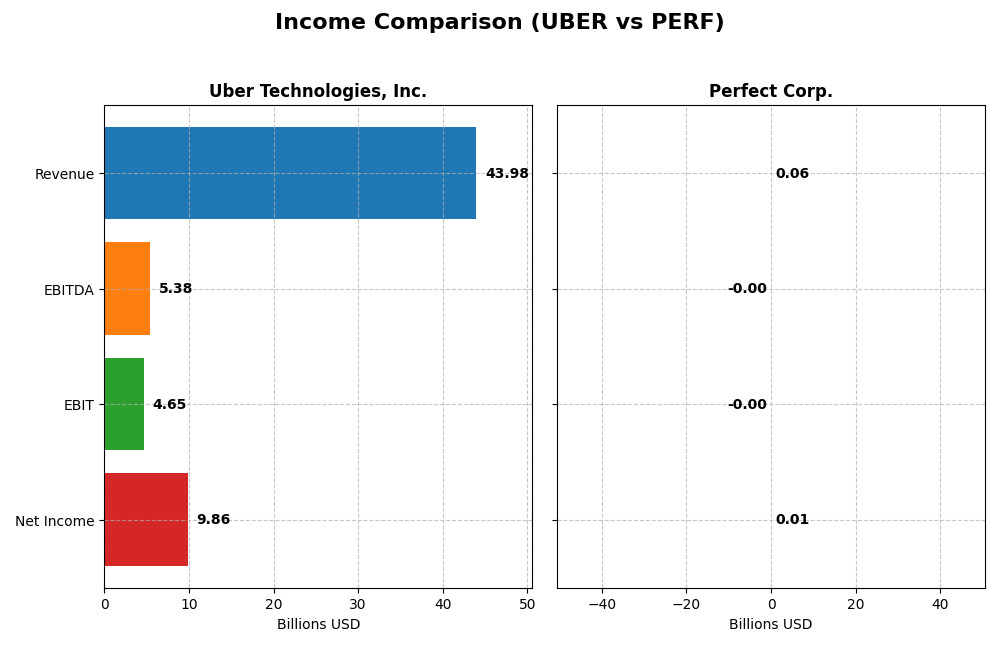
The following table compares key income statement metrics for Uber Technologies, Inc. and Perfect Corp. for the fiscal year 2024.
| Metric | Uber Technologies, Inc. | Perfect Corp. |
|---|---|---|
| Market Cap | 176.3B | 179M |
| Revenue | 43.98B | 60.2M |
| EBITDA | 5.39B | -2.05M |
| EBIT | 4.65B | -2.84M |
| Net Income | 9.86B | 5.02M |
| EPS | 4.71 | 0.05 |
| Fiscal Year | 2024 | 2024 |
Income Statement Interpretations
Uber Technologies, Inc.
Uber has shown strong growth from 2020 to 2024, with revenue increasing by nearly 295% and net income improving from negative to 9.81B USD in 2024. Margins have also improved notably, with a gross margin of 39.4% and a net margin rising to 22.41%. The 2024 results highlight accelerated growth, especially in net income and EPS, signaling solid operational leverage and margin expansion.
Perfect Corp.
Perfect Corp. experienced consistent revenue growth of about 102% over the period, reaching 60M USD in 2024, with net income turning positive to 5M USD. The company maintains a high gross margin near 78%, but EBIT margins remain negative at -4.72%, reflecting ongoing operating losses. The 2024 year saw revenue and gross profit growth, though EBIT declined, indicating challenges in controlling operating expenses.
Which one has the stronger fundamentals?
Uber presents stronger fundamentals with favorable trends across all key metrics, including profitability and margin improvement, supported by significant net income growth. Perfect Corp., while showing positive revenue and net income growth, struggles with negative EBIT margins and recent operating losses. Uber’s consistent margin gains and robust net income position it more favorably in terms of income statement strength.
Financial Ratios Comparison
The table below presents a side-by-side comparison of key financial ratios for Uber Technologies, Inc. and Perfect Corp. based on their most recent fiscal year data for 2024.
| Ratios | Uber Technologies, Inc. | Perfect Corp. |
|---|---|---|
| ROE | 45.7% | 3.4% |
| ROIC | 6.8% | -2.1% |
| P/E | 12.8 | 56.6 |
| P/B | 5.86 | 1.93 |
| Current Ratio | 1.07 | 5.52 |
| Quick Ratio | 1.07 | 5.52 |
| D/E (Debt-to-Equity) | 0.53 | 0.0035 |
| Debt-to-Assets | 22.3% | 0.28% |
| Interest Coverage | 5.35 | -449 |
| Asset Turnover | 0.86 | 0.33 |
| Fixed Asset Turnover | 14.14 | 57.94 |
| Payout ratio | 0 | 0 |
| Dividend yield | 0 | 0 |
Interpretation of the Ratios
Uber Technologies, Inc.
Uber shows a balanced profile with 50% favorable, 14% unfavorable, and 36% neutral ratios, indicating a slightly favorable overall stance. Strong points include a high return on equity at 45.72% and a solid interest coverage of 8.89. However, its price-to-book ratio of 5.86 is less appealing. Uber pays no dividends, likely reinvesting earnings to support growth and operations.
Perfect Corp.
Perfect Corp. displays a more mixed ratio profile with 36% favorable, 50% unfavorable, and 14% neutral ratios, suggesting a slightly unfavorable outlook. The company’s debt is minimal, but it suffers from a low return on equity of 3.42% and negative return on invested capital. Like Uber, it does not pay dividends, possibly prioritizing reinvestment and R&D in its growth phase.
Which one has the best ratios?
Uber’s ratios are generally stronger, featuring a more favorable return on equity and better interest coverage, despite some concerns like a high price-to-book ratio. Perfect Corp. faces challenges with several unfavorable ratios, notably low profitability and high volatility. Overall, Uber presents a more robust financial ratio profile than Perfect Corp.
Strategic Positioning
This section compares the strategic positioning of Uber Technologies, Inc. and Perfect Corp., focusing on market position, key segments, and exposure to technological disruption:
Uber Technologies, Inc.
- Leading global player in software applications with strong NYSE presence and significant market cap.
- Diverse business segments: Mobility, Delivery, and Freight driving revenue growth across regions.
- Operates proprietary technology platforms across multiple continents; no explicit disruption risk mentioned.
Perfect Corp.
- Small-cap company in software applications with lower market cap and NYSE listing.
- Focused on SaaS AI and AR beauty and fashion tech solutions and consumer apps.
- Provides advanced AI and AR solutions, indicating exposure to fast-evolving tech trends.
Uber vs Perfect Positioning
Uber employs a diversified model spanning mobility, delivery, and freight, benefiting from multiple revenue streams but facing competitive pressure in varied markets. Perfect Corp. concentrates on niche AI and AR tech for beauty and fashion, offering specialized innovation with narrower market scope.
Which has the best competitive advantage?
Both companies are classified as slightly unfavorable in MOAT evaluation, shedding value despite growing ROIC trends, indicating rising profitability but limited economic moat strength in the current period.
Stock Comparison
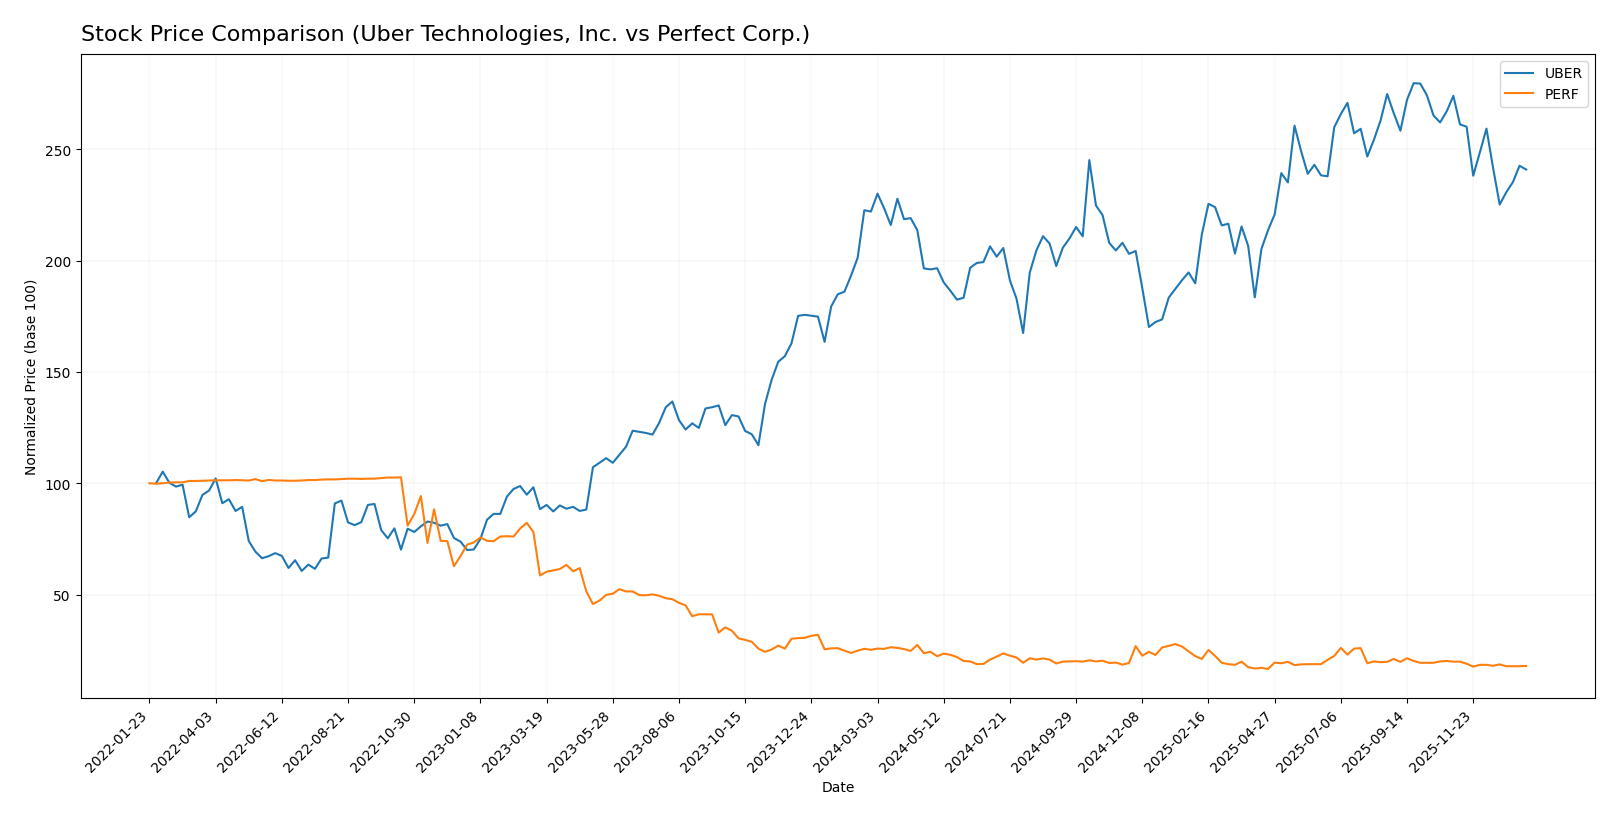
The stock price movements over the past 12 months reveal contrasting dynamics, with Uber Technologies showing an overall bullish trend despite recent declines, while Perfect Corp. exhibits a sustained bearish pattern with decelerating losses.
Trend Analysis
Uber Technologies, Inc. stock posted an 8.5% gain over the past year, indicating a bullish trend with decelerating momentum. The price fluctuated between 58.99 and 98.51, accompanied by notable volatility (std deviation 10.29).
Perfect Corp. experienced a 28.98% decline over the same period, confirming a bearish trend with deceleration. Price ranged from 1.61 to 2.7, showing very low volatility (std deviation 0.27).
Comparing both, Uber delivered the highest market performance with positive annual growth, while Perfect Corp. faced significant losses and lower price stability.
Target Prices
The current analyst consensus reveals promising upside potential for Uber Technologies, Inc. but shows a limited range for Perfect Corp.
| Company | Target High | Target Low | Consensus |
|---|---|---|---|
| Uber Technologies, Inc. | 140 | 73 | 111.26 |
| Perfect Corp. | 7 | 7 | 7 |
Analysts expect Uber’s stock to trade significantly above its current price of 84.85 USD, suggesting potential growth. Perfect Corp.’s target consensus at 7 USD is substantially higher than its current 1.74 USD, indicating strong bullish sentiment.
Analyst Opinions Comparison
This section compares analysts’ ratings and grades for Uber Technologies, Inc. and Perfect Corp.:
Rating Comparison
Uber Rating
- Rating: B, classified as Very Favorable.
- Discounted Cash Flow Score: 1, Very Unfavorable, indicating possible overvaluation.
- ROE Score: 5, Very Favorable, showing strong profit generation from equity.
- ROA Score: 5, Very Favorable, reflecting effective asset utilization.
- Debt To Equity Score: 2, Moderate, showing some financial risk.
- Overall Score: 3, Moderate overall financial standing.
Perfect Corp. Rating
- Rating: A-, classified as Very Favorable.
- Discounted Cash Flow Score: 5, Very Favorable, suggesting undervaluation.
- ROE Score: 2, Moderate, indicating lower efficiency in profit generation.
- ROA Score: 3, Moderate, indicating average asset efficiency.
- Debt To Equity Score: 4, Favorable, indicating lower financial risk.
- Overall Score: 4, Favorable overall financial standing.
Which one is the best rated?
Based strictly on provided data, Perfect Corp. holds a higher overall score (4 vs. 3) and better discounted cash flow and debt-to-equity scores, while Uber excels in ROE and ROA. Perfect Corp. is therefore better rated overall.
Scores Comparison
The following table compares the Altman Z-Score and Piotroski Score of Uber Technologies, Inc. and Perfect Corp.:
Uber Scores
- Altman Z-Score: 4.44, in safe zone, low bankruptcy risk
- Piotroski Score: 6, average financial strength
Perfect Scores
- Altman Z-Score: 1.31, in distress zone, high bankruptcy risk
- Piotroski Score: 6, average financial strength
Which company has the best scores?
Uber has a significantly higher Altman Z-Score, indicating much lower bankruptcy risk compared to Perfect. Both have the same Piotroski Score, showing similar average financial strength. Overall, Uber’s scores suggest greater financial stability.
Grades Comparison
The following is a comparison of the latest reliable grades from recognized grading companies for Uber Technologies, Inc. and Perfect Corp.:
Uber Technologies, Inc. Grades
This table summarizes recent grades assigned by reputable financial institutions to Uber Technologies, Inc.:
| Grading Company | Action | New Grade | Date |
|---|---|---|---|
| BTIG | Maintain | Buy | 2026-01-15 |
| Wells Fargo | Maintain | Overweight | 2026-01-08 |
| Cantor Fitzgerald | Maintain | Overweight | 2026-01-08 |
| Wolfe Research | Maintain | Outperform | 2026-01-06 |
| Wedbush | Maintain | Neutral | 2025-12-19 |
| Morgan Stanley | Maintain | Overweight | 2025-12-08 |
| Arete Research | Upgrade | Buy | 2025-12-03 |
| Wells Fargo | Maintain | Overweight | 2025-11-05 |
| Guggenheim | Maintain | Buy | 2025-11-05 |
| DA Davidson | Maintain | Buy | 2025-11-05 |
Uber’s grades predominantly range from Buy to Overweight, with occasional Neutral ratings, showing a generally positive consensus and some recent upgrades.
Perfect Corp. Grades
This table summarizes recent grades assigned by reputable financial institutions to Perfect Corp.:
| Grading Company | Action | New Grade | Date |
|---|---|---|---|
| Piper Sandler | Maintain | Neutral | 2024-02-29 |
| Goldman Sachs | Maintain | Neutral | 2023-10-26 |
| Piper Sandler | Maintain | Neutral | 2023-10-25 |
| Piper Sandler | Maintain | Neutral | 2023-07-26 |
| Piper Sandler | Maintain | Neutral | 2023-07-25 |
| Piper Sandler | Maintain | Neutral | 2023-04-27 |
| Oppenheimer | Downgrade | Perform | 2023-04-20 |
| Oppenheimer | Downgrade | Perform | 2023-04-19 |
| Oppenheimer | Downgrade | Perform | 2023-04-18 |
| Piper Sandler | Maintain | Neutral | 2023-03-08 |
Perfect Corp.’s grades mostly remain Neutral with some downgrades from Outperform to Perform, indicating a more cautious outlook by analysts.
Which company has the best grades?
Uber Technologies, Inc. has received notably stronger grades, primarily Buy and Overweight, compared to Perfect Corp.’s Neutral and Perform ratings. This difference suggests Uber is viewed more favorably by analysts, potentially reflecting stronger growth or stability prospects that investors may consider for portfolio positioning.
Strengths and Weaknesses
Below is a comparative table summarizing the key strengths and weaknesses of Uber Technologies, Inc. and Perfect Corp. based on the most recent financial and strategic data available.
| Criterion | Uber Technologies, Inc. | Perfect Corp. |
|---|---|---|
| Diversification | Strong: Multiple segments including Mobility ($25B), Delivery ($13.75B), and Freight ($5.14B) in 2024 | Limited: Mainly focused on digital beauty tech |
| Profitability | Favorable net margin (22.41%) and ROE (45.72%), but ROIC slightly below WACC indicating slight value destruction | Low profitability: ROE (3.42%) and negative ROIC (-2.1%), shedding value but improving |
| Innovation | Moderate: Investing in technology but ROIC vs WACC indicates inefficiencies | Moderate: Innovation in AR beauty tech, yet financial returns remain weak |
| Global presence | Extensive global operations with strong market penetration in mobility and delivery | Niche global presence focused on beauty and AR markets |
| Market Share | Significant in ridesharing and delivery markets | Smaller market share, focused on a specialized segment |
Key takeaways: Uber shows diversified revenue streams and strong profitability ratios, albeit with slight inefficiencies in capital use. Perfect Corp. is innovating in a niche area but faces challenges in profitability and market scale. Investors should weigh Uber’s broader market presence and improving returns against Perfect Corp.’s growth potential but higher risk profile.
Risk Analysis
Below is a comparative table of key risks for Uber Technologies, Inc. and Perfect Corp. based on the most recent 2024 data.
| Metric | Uber Technologies, Inc. | Perfect Corp. |
|---|---|---|
| Market Risk | Beta 1.20, moderately volatile | Beta 0.45, lower volatility |
| Debt level | Debt-to-Equity 0.53, moderate leverage | Debt-to-Equity 0.0, very low leverage |
| Regulatory Risk | High, due to global ride-sharing operations and local transportation laws | Moderate, mainly tech and data privacy regulations |
| Operational Risk | High, complex logistics and delivery network | Moderate, technology development and platform stability |
| Environmental Risk | Moderate, limited direct emissions but scrutiny on urban congestion | Low, primarily software-based operations |
| Geopolitical Risk | Moderate, global presence across multiple regions | Moderate, exposure due to Taiwan base and global clients |
The most likely and impactful risks are Uber’s regulatory challenges across diverse markets, which can affect its mobility and delivery services. Perfect Corp.’s key concerns revolve around sustaining technology innovation amid competitive AI and AR sectors, compounded by geopolitical tensions affecting Taiwan. Both companies maintain manageable debt levels, but Uber carries moderately higher financial leverage.
Which Stock to Choose?
Uber Technologies, Inc. shows a strong income evolution with 295% revenue growth over 2020-2024 and consistently favorable profitability metrics, including a 22.41% net margin in 2024. Its financial ratios are slightly favorable overall, supported by a very favorable return on equity of 45.72% and sound debt management. The company holds a “B” rating, indicating very favorable creditworthiness despite some valuation concerns.
Perfect Corp. experienced a favorable income statement with a 102% revenue growth and 8.34% net margin in 2024, though profitability remains moderate. Its financial ratios are slightly unfavorable overall, reflecting weaker returns on equity (3.42%) and invested capital, despite excellent liquidity and low debt levels. The firm received a higher “A-” rating, signaling strong financial standing but with some operational challenges.
Considering ratings and financial evaluations, Uber might appear more attractive for investors seeking growth and profitability, given its robust income evolution and favorable ratios. Conversely, Perfect Corp. could be seen as suitable for those prioritizing financial stability and low leverage, despite less impressive profitability. Both companies are slightly unfavorable in MOAT evaluations, indicating value destruction but improving profitability.
Disclaimer: Investment carries a risk of loss of initial capital. The past performance is not a reliable indicator of future results. Be sure to understand risks before making an investment decision.
Go Further
I encourage you to read the complete analyses of Uber Technologies, Inc. and Perfect Corp. to enhance your investment decisions: