Investors seeking growth in the technology sector often weigh established powerhouses against innovative newcomers. Tyler Technologies, Inc. (TYL), a veteran provider of public sector software solutions, faces off against Perfect Corp. (PERF), a dynamic player specializing in AI-driven beauty and fashion tech. Both operate within the application software industry but target distinct markets with unique innovation strategies. This article will help you decide which company holds the most promise for your investment portfolio.
Table of contents
Companies Overview
I will begin the comparison between Tyler Technologies and Perfect Corp. by providing an overview of these two companies and their main differences.
Tyler Technologies Overview
Tyler Technologies, Inc. provides integrated information management solutions and services primarily for the public sector. It operates through segments including Enterprise Software, Appraisal and Tax, and NIC. The company offers software to automate government functions like courts, tax billing, and public safety, serving municipal and county agencies. Founded in 1966 and based in Plano, Texas, Tyler has a market cap of 18.9B USD and employs about 7,462 people.
Perfect Corp. Overview
Perfect Corp. delivers SaaS artificial intelligence and augmented reality solutions focused on beauty and fashion technology. Its offerings include virtual try-on apps for makeup, hair, glasses, and accessories using AI and AR technologies. Founded in 2015 and headquartered in New Taipei City, Taiwan, Perfect Corp. has a market cap of 179M USD and a workforce of approximately 342 employees, reflecting its niche and innovation-driven approach.
Key similarities and differences
Both companies operate in the technology sector and provide software application solutions, but their markets and business models differ significantly. Tyler Technologies focuses on public sector management software with a broad governmental customer base, while Perfect Corp. targets consumer-facing AI and AR applications in beauty and fashion. Tyler is a large, established company with a diversified product suite, whereas Perfect is a smaller, specialized SaaS provider emphasizing AI-driven virtual experiences.
Income Statement Comparison
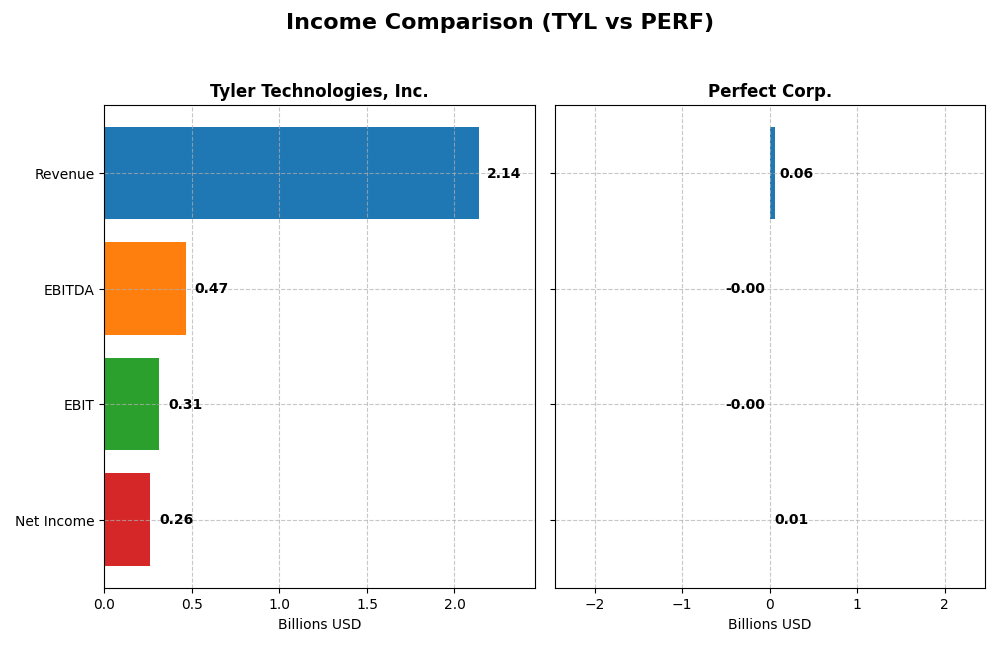
The table below compares the key income statement metrics for Tyler Technologies, Inc. and Perfect Corp. for the fiscal year 2024.
| Metric | Tyler Technologies, Inc. | Perfect Corp. |
|---|---|---|
| Market Cap | 18.9B | 179M |
| Revenue | 2.14B | 60.2M |
| EBITDA | 466M | -2.05M |
| EBIT | 314M | -2.84M |
| Net Income | 263M | 5.02M |
| EPS | 6.17 | 0.05 |
| Fiscal Year | 2024 | 2024 |
Income Statement Interpretations
Tyler Technologies, Inc.
Tyler Technologies showed consistent revenue growth from 2020 to 2024, rising from $1.12B to $2.14B, with net income increasing from $195M to $263M. Gross and EBIT margins remained favorable, reflecting operational efficiency. In 2024, revenue growth accelerated to 9.53%, and net margin improved significantly, driven by a 41.57% EBIT increase, indicating strengthened profitability.
Perfect Corp.
Perfect Corp. experienced rapid revenue growth, doubling from $30M in 2020 to $60M in 2024. Net income improved from a loss of $5.6M in 2020 to a profit of $5M in 2024. Despite a high gross margin near 78%, EBIT margin remained negative in 2024 at -4.72%, reflecting ongoing operational challenges. The recent year showed 12.5% revenue growth but a decline in EBIT, signaling margin pressure.
Which one has the stronger fundamentals?
Tyler Technologies demonstrates stronger fundamentals with favorable margins, steady EBIT growth, and robust net income expansion, supported by efficient cost management. Perfect Corp. displays impressive revenue and net income growth but faces unfavorable EBIT margins and operational expenses impacting profitability. Overall, Tyler’s financial metrics suggest more consistent fundamental strength over the period.
Financial Ratios Comparison
The table below presents a side-by-side comparison of key financial ratios for Tyler Technologies, Inc. (TYL) and Perfect Corp. (PERF) based on their most recent full-year data for 2024.
| Ratios | Tyler Technologies, Inc. (TYL) | Perfect Corp. (PERF) |
|---|---|---|
| ROE | 7.76% | 3.42% |
| ROIC | 6.20% | -2.10% |
| P/E | 93.4 | 56.6 |
| P/B | 7.25 | 1.93 |
| Current Ratio | 1.35 | 5.52 |
| Quick Ratio | 1.35 | 5.52 |
| D/E (Debt-to-Equity) | 0.19 | 0.0035 |
| Debt-to-Assets | 12.3% | 0.28% |
| Interest Coverage | 50.5 | -449 |
| Asset Turnover | 0.41 | 0.33 |
| Fixed Asset Turnover | 10.95 | 57.94 |
| Payout ratio | 0 | 0 |
| Dividend yield | 0% | 0% |
Interpretation of the Ratios
Tyler Technologies, Inc.
Tyler Technologies shows a mixed ratio profile with 50% favorable and 35.7% unfavorable ratings. Its net margin of 12.3% and interest coverage of 52.96 are strong, while return on equity at 7.76% and high price-to-earnings at 93.42 raise caution. The company does not pay dividends, likely prioritizing reinvestment and growth.
Perfect Corp.
Perfect Corp. displays a more challenged ratio set, with 50% unfavorable and only 35.7% favorable ratios. It has a low return on equity of 3.42% and negative return on invested capital. Although the current ratio is very high at 5.52, interest coverage is deeply negative. The company also pays no dividends, reflecting a growth and reinvestment phase.
Which one has the best ratios?
Tyler Technologies holds a slightly favorable ratio profile compared to Perfect Corp.’s slightly unfavorable one. Tyler’s stronger profitability margins, interest coverage, and manageable debt levels contrast with Perfect’s weaker returns and negative interest coverage, suggesting Tyler currently exhibits a more balanced financial condition.
Strategic Positioning
This section compares the strategic positioning of Tyler Technologies, Inc. (TYL) and Perfect Corp. (PERF) including market position, key segments, and exposure to technological disruption:
Tyler Technologies, Inc.
- Established market leader with $18.9B market cap facing moderate competitive pressure in public sector software.
- Key segments include Enterprise Software, Appraisal and Tax, SaaS, and various public sector solutions driving growth.
- Leverages strategic AWS collaboration for cloud hosting; exposed to ongoing software innovation but less to disruptive AR/AI trends.
Perfect Corp.
- Smaller player with $179M market cap focusing on AI/AR beauty and fashion tech, experiencing lower competitive pressure.
- Focused on SaaS AI and AR virtual try-on solutions for beauty and fashion, powering multiple consumer apps and services.
- Highly exposed to AI and augmented reality technology disruption central to its business model and product offerings.
Tyler Technologies, Inc. vs Perfect Corp. Positioning
TYL operates a diversified business across multiple public sector software segments, offering stability but facing mature market challenges. PERF is concentrated in AI/AR-driven beauty tech, benefiting from innovation but with a narrower focus and smaller scale.
Which has the best competitive advantage?
Based on MOAT evaluation, both companies are currently shedding value. TYL has a very unfavorable moat with declining profitability, while PERF’s moat is slightly unfavorable but shows improving profitability, indicating a modestly stronger competitive advantage for PERF.
Stock Comparison
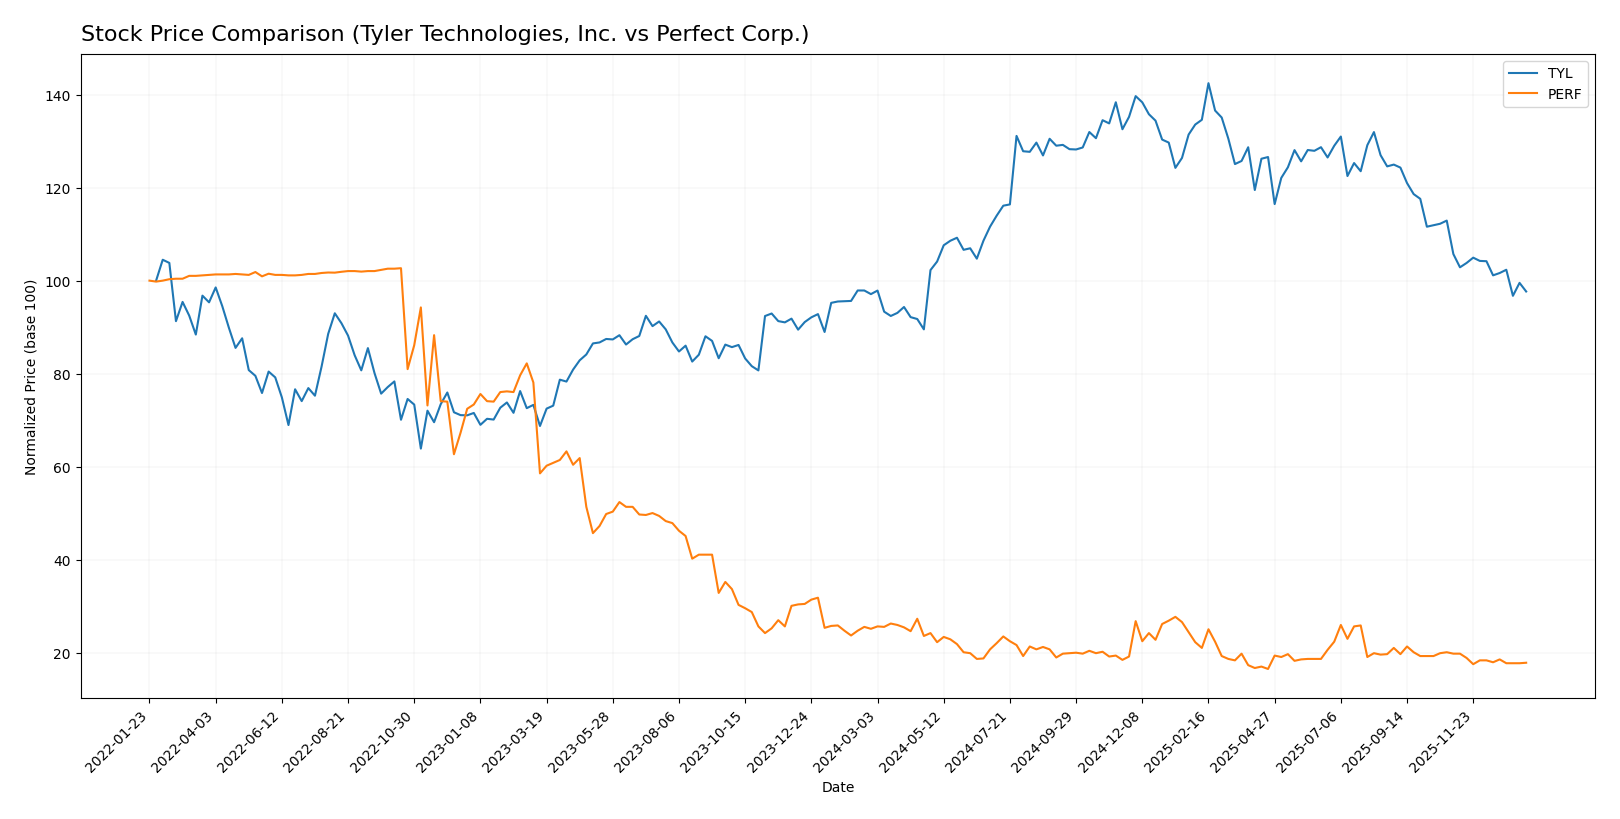
The stock price movements over the past 12 months reveal a slight overall gain for Tyler Technologies, Inc. (TYL) with a recent downturn, while Perfect Corp. (PERF) has experienced a marked decline, highlighting contrasting trading dynamics.
Trend Analysis
Tyler Technologies, Inc. (TYL) shows a marginal bullish trend over the past year with a 0.58% increase, though recent data indicates a deceleration and a 7.61% drop from November 2025 to January 2026.
Perfect Corp. (PERF) exhibits a strong bearish trend, falling 28.98% over the last 12 months, with continuing deceleration and a further 9.84% decline in the recent two-and-a-half-month period.
Comparing both, Tyler Technologies delivered the highest market performance with a slight overall gain, while Perfect Corp. experienced significant losses over the same timeframe.
Target Prices
The current analyst consensus provides a clear range of target prices for Tyler Technologies, Inc. and Perfect Corp.
| Company | Target High | Target Low | Consensus |
|---|---|---|---|
| Tyler Technologies, Inc. | 675 | 470 | 584 |
| Perfect Corp. | 7 | 7 | 7 |
Analysts expect Tyler Technologies to trade significantly above its current price of $440.01, suggesting potential upside. Perfect Corp.’s consensus target of $7 far exceeds its current price near $1.74, indicating strong growth expectations.
Analyst Opinions Comparison
This section compares analysts’ ratings and grades for Tyler Technologies, Inc. and Perfect Corp.:
Rating Comparison
TYL Rating
- Rating: B, considered very favorable overall.
- Discounted Cash Flow Score: 4, favorable rating.
- ROE Score: 3, moderate efficiency in equity use.
- ROA Score: 4, favorable asset utilization.
- Debt To Equity Score: 3, moderate financial risk.
- Overall Score: 3, moderate overall financial health.
PERF Rating
- Rating: A-, also very favorable overall.
- Discounted Cash Flow Score: 5, very favorable.
- ROE Score: 2, moderate but lower than TYL.
- ROA Score: 3, moderate asset utilization.
- Debt To Equity Score: 4, favorable balance sheet.
- Overall Score: 4, favorable overall health.
Which one is the best rated?
Based strictly on provided data, PERF holds a higher overall score (4 vs. 3) and a superior discounted cash flow score (5 vs. 4), reflecting a more favorable analyst rating compared to TYL.
Scores Comparison
Here is a comparison of the financial scores for Tyler Technologies, Inc. and Perfect Corp.:
TYL Scores
- Altman Z-Score: 7.42, indicating a safe zone with low bankruptcy risk.
- Piotroski Score: 6, reflecting average financial strength.
PERF Scores
- Altman Z-Score: 1.31, indicating distress zone with high bankruptcy risk.
- Piotroski Score: 6, reflecting average financial strength.
Which company has the best scores?
Tyler Technologies shows a much stronger Altman Z-Score, placing it safely away from bankruptcy risk, while both companies share the same average Piotroski Score. Tyler’s scores indicate better overall financial stability.
Grades Comparison
Here is a detailed comparison of the recent grades assigned to Tyler Technologies, Inc. and Perfect Corp.:
Tyler Technologies, Inc. Grades
The table below summarizes the latest reliable grades for Tyler Technologies, Inc. from major grading companies.
| Grading Company | Action | New Grade | Date |
|---|---|---|---|
| Piper Sandler | Maintain | Overweight | 2026-01-13 |
| Wells Fargo | Maintain | Equal Weight | 2026-01-08 |
| DA Davidson | Maintain | Neutral | 2025-12-09 |
| Evercore ISI Group | Maintain | In Line | 2025-10-31 |
| DA Davidson | Maintain | Neutral | 2025-10-31 |
| DA Davidson | Maintain | Neutral | 2025-10-10 |
| DA Davidson | Maintain | Neutral | 2025-08-05 |
| Barclays | Maintain | Overweight | 2025-07-31 |
| Needham | Maintain | Buy | 2025-05-13 |
| Barclays | Maintain | Overweight | 2025-04-25 |
Overall, Tyler Technologies has maintained predominantly positive or neutral grades, with several “Overweight” and “Buy” ratings indicating a generally favorable outlook.
Perfect Corp. Grades
The table below shows the most recent reliable grades for Perfect Corp. from recognized grading firms.
| Grading Company | Action | New Grade | Date |
|---|---|---|---|
| Piper Sandler | Maintain | Neutral | 2024-02-29 |
| Goldman Sachs | Maintain | Neutral | 2023-10-26 |
| Piper Sandler | Maintain | Neutral | 2023-10-25 |
| Piper Sandler | Maintain | Neutral | 2023-07-26 |
| Piper Sandler | Maintain | Neutral | 2023-07-25 |
| Piper Sandler | Maintain | Neutral | 2023-04-27 |
| Oppenheimer | Downgrade | Perform | 2023-04-20 |
| Oppenheimer | Downgrade | Perform | 2023-04-19 |
| Oppenheimer | Downgrade | Perform | 2023-04-18 |
| Piper Sandler | Maintain | Neutral | 2023-03-08 |
The grades for Perfect Corp. have remained mostly neutral with some downgrades from “Outperform” to “Perform,” suggesting a cautious or moderate market stance.
Which company has the best grades?
Tyler Technologies has received more favorable grades, including multiple “Buy” and “Overweight” ratings, compared to Perfect Corp.’s predominantly “Neutral” ratings. This difference may influence investor sentiment, with Tyler showing stronger analyst confidence.
Strengths and Weaknesses
Below is a comparison table outlining the key strengths and weaknesses of Tyler Technologies, Inc. (TYL) and Perfect Corp. (PERF) based on their recent financial and operational data.
| Criterion | Tyler Technologies, Inc. (TYL) | Perfect Corp. (PERF) |
|---|---|---|
| Diversification | Moderate: Multiple revenue streams including SaaS, Maintenance, and Transaction Based Fees totaling over $1.8B (2024) | Limited: Primarily focused on AI-driven beauty tech; less diversified revenue |
| Profitability | Mixed: Net margin 12.3% (favorable), ROIC 6.2% (neutral), but ROIC below WACC (-1.79%) indicates value destruction | Low: Net margin 8.34% (neutral), ROIC negative (-2.1%) and ROIC below WACC (-8.06%) indicates value destruction |
| Innovation | Moderate: Consistent software platform growth, but asset turnover low (0.41) | High: Growing ROIC trend (+45.8%) suggests improving innovation and operational efficiency |
| Global presence | Strong: Large enterprise software client base, extensive services | Moderate: Strong tech focus but smaller scale and limited global footprint |
| Market Share | Established presence in public sector software with steady revenues | Emerging player in AI beauty tech with growth potential but smaller market share |
Key takeaways: Tyler Technologies shows diversified revenue and stable margins but is currently destroying value with declining profitability. Perfect Corp. is less diversified and less profitable but demonstrates improving operational efficiency and growth potential. Both companies carry investment risks demanding cautious approach.
Risk Analysis
Below is a comparative table highlighting key risks for Tyler Technologies, Inc. (TYL) and Perfect Corp. (PERF) as of 2024:
| Metric | Tyler Technologies, Inc. (TYL) | Perfect Corp. (PERF) |
|---|---|---|
| Market Risk | Moderate (Beta 0.916) | Low (Beta 0.454) |
| Debt level | Low (D/E 0.19, favorable) | Very Low (D/E 0.0, favorable) |
| Regulatory Risk | Moderate (U.S. public sector) | Moderate (Taiwanese tech) |
| Operational Risk | Moderate (large workforce, 7.5K employees) | Moderate (smaller scale, 342 employees) |
| Environmental Risk | Low | Low |
| Geopolitical Risk | Low (U.S.-based) | Moderate (Taiwan, regional tensions) |
The most impactful risks lie in Perfect Corp.’s financial distress indication with a low Altman Z-score (1.31), signaling higher bankruptcy risk, despite low debt. Tyler Technologies shows a safer financial position but faces market valuation challenges with a high P/E ratio and moderate operational risk due to its size and sector exposure. Geopolitical risk is more pronounced for Perfect given its Taiwan base amid regional uncertainties.
Which Stock to Choose?
Tyler Technologies, Inc. (TYL) shows a favorable income evolution with 9.53% revenue growth in 2024 and a strong net margin of 12.3%. Its financial ratios are slightly favorable overall, with solid debt management and cash flow metrics, though some valuation multiples appear high. Profitability is moderate, with return on equity at 7.76%, and the company carries low net debt. Its credit rating is very favorable with a “B” grade.
Perfect Corp. (PERF) reports a favorable income growth of 12.52% in 2024 but a negative EBIT margin at -4.72%. Its financial ratios are slightly unfavorable overall, reflecting weaker returns and some operational challenges. Profitability is modest with 3.42% ROE, and it has negligible debt levels. The company’s rating is very favorable, rated “A-,” supported by strong discounted cash flow scores.
Considering ratings and financial metrics, investors focused on stable financial health and proven cash flow might find Tyler Technologies’ slightly favorable ratios and solid ratings more reassuring. Conversely, those inclined towards growth potential despite operational volatility could view Perfect Corp.’s strong income growth and top rating as promising, although with higher risk. The differing financial profiles suggest the choice could depend on the investor’s risk tolerance and strategic priorities.
Disclaimer: Investment carries a risk of loss of initial capital. The past performance is not a reliable indicator of future results. Be sure to understand risks before making an investment decision.
Go Further
I encourage you to read the complete analyses of Tyler Technologies, Inc. and Perfect Corp. to enhance your investment decisions: