In today’s dynamic tech landscape, Strategy Inc and Perfect Corp. emerge as compelling players in the software application industry, each pushing innovation in distinct yet overlapping markets. Strategy Inc focuses on bitcoin treasury management and AI-driven enterprise analytics, while Perfect Corp. leads in AI and augmented reality solutions for beauty and fashion tech. This article will help investors navigate these differences to identify the most promising opportunity for their portfolio.

Table of contents
Companies Overview
I will begin the comparison between Strategy Inc and Perfect Corp. by providing an overview of these two companies and their main differences.
Strategy Inc Overview
Strategy Inc, formerly MicroStrategy Incorporated until August 2025, is a US-based bitcoin treasury company operating internationally. It provides investors with economic exposure to Bitcoin through various securities and offers AI-powered enterprise analytics software. Headquartered in Tysons Corner, Virginia, the company focuses on delivering actionable insights and consistent data governance for enterprises, positioning itself in the software application industry with a market cap of approximately 50B USD.
Perfect Corp. Overview
Perfect Corp., founded in 2015 and based in New Taipei City, Taiwan, specializes in SaaS AI and augmented reality solutions for the beauty and fashion tech sectors. It offers a wide range of virtual try-on and AI analysis tools for makeup, hair, accessories, and more. Listed on the NYSE since 2022, Perfect Corp. operates in the software application industry with a market cap near 179M USD and employs 342 people, emphasizing innovation in consumer-facing AI technologies.
Key similarities and differences
Both companies operate in the technology sector within the software application industry and leverage AI in their offerings. Strategy Inc focuses on enterprise-level analytics and bitcoin-related securities, targeting institutional investors, while Perfect Corp. concentrates on consumer-oriented AR and AI beauty tech solutions. Their market caps differ significantly, reflecting divergent scales and market focuses, with Strategy Inc having a much larger presence and broader international operations compared to Perfect Corp.’s niche in beauty and fashion tech.
Income Statement Comparison
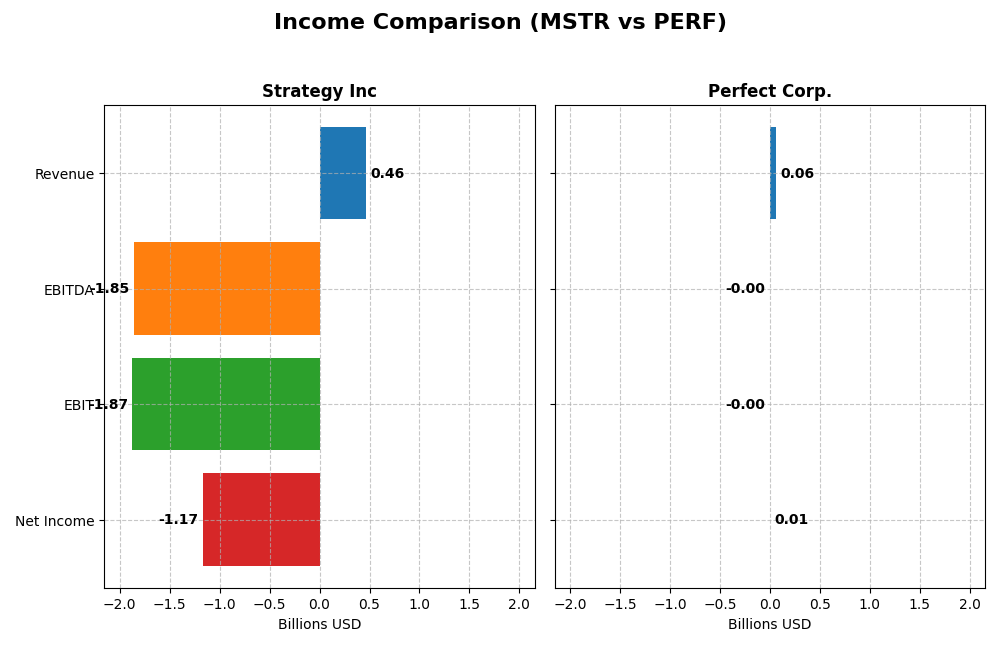
This table compares the key income statement metrics of Strategy Inc and Perfect Corp. for the fiscal year 2024, providing a snapshot of their financial performance.
| Metric | Strategy Inc (MSTR) | Perfect Corp. (PERF) |
|---|---|---|
| Market Cap | 50.3B | 179M |
| Revenue | 463M | 60M |
| EBITDA | -1.85B | -2.05M |
| EBIT | -1.87B | -2.84M |
| Net Income | -1.17B | 5.02M |
| EPS | -6.06 | 0.05 |
| Fiscal Year | 2024 | 2024 |
Income Statement Interpretations
Strategy Inc
Strategy Inc’s revenue showed a slight decline over the 2020-2024 period, falling 3.6%, with net income deteriorating sharply by over 15,400%. Gross margin remained strong at 72%, but operating and net margins were deeply negative, reflecting significant losses. In 2024, revenue contracted 6.6%, and profitability worsened, with a net margin of -252%, indicating intensified financial challenges.
Perfect Corp.
Perfect Corp. experienced robust revenue growth of 101.5% from 2020 to 2024, alongside net income increasing nearly 190%. Gross margin was steady and favorable at 78%, while net margin stood positive at 8.3%. The latest fiscal year saw 12.5% revenue growth, though EBIT declined sharply, suggesting some margin pressure despite overall profitability gains and favorable expense management.
Which one has the stronger fundamentals?
Perfect Corp. demonstrates stronger fundamentals, with consistent revenue and net income growth, favorable gross and net margins, and controlled interest expenses. In contrast, Strategy Inc faces ongoing losses with unfavorable margins and shrinking revenue, signaling financial instability. Perfect Corp.’s income statement portrays a healthier and more sustainable financial trajectory over the analyzed period.
Financial Ratios Comparison
The table below presents the most recent key financial ratios for Strategy Inc (MSTR) and Perfect Corp. (PERF) as of fiscal year 2024. These ratios provide insight into profitability, liquidity, valuation, leverage, efficiency, and dividend metrics.
| Ratios | Strategy Inc (MSTR) | Perfect Corp. (PERF) |
|---|---|---|
| ROE | -6.40% | 3.42% |
| ROIC | -4.38% | -2.10% |
| P/E | -47.8 | 56.6 |
| P/B | 3.06 | 1.93 |
| Current Ratio | 0.71 | 5.52 |
| Quick Ratio | 0.71 | 5.52 |
| D/E (Debt to Equity) | 0.40 | 0.0035 |
| Debt-to-Assets | 28.1% | 0.28% |
| Interest Coverage | -29.9 | -449 |
| Asset Turnover | 0.018 | 0.33 |
| Fixed Asset Turnover | 5.73 | 57.9 |
| Payout Ratio | 0 | 0 |
| Dividend Yield | 0% | 0% |
Interpretation of the Ratios
Strategy Inc
Strategy Inc shows predominantly unfavorable ratios, including negative net margin (-251.73%) and return on equity (-6.4%), indicating operational and profitability challenges. The low current and quick ratios (0.71) suggest liquidity concerns. The company does not pay dividends, likely due to negative earnings and a focus on reinvestment or growth. No dividend yield or payout is reported.
Perfect Corp.
Perfect Corp. displays mixed ratios with a positive net margin (8.34%) but weak return on equity (3.42%) and return on invested capital (-2.1%), suggesting modest profitability. The high current ratio (5.52) indicates strong liquidity, while debt levels are minimal. Like Strategy Inc, Perfect Corp. does not pay dividends, possibly prioritizing growth and R&D over shareholder payouts.
Which one has the best ratios?
Neither company presents a fully favorable financial profile, but Perfect Corp. has a more balanced set of ratios with better liquidity and profitability metrics despite some weaknesses. Strategy Inc faces more significant issues with profitability and liquidity. Overall, Perfect Corp.’s ratios are slightly less unfavorable compared to Strategy Inc’s.
Strategic Positioning
This section compares the strategic positioning of Strategy Inc and Perfect Corp., focusing on Market position, Key segments, and exposure to technological disruption:
Strategy Inc
- Large market cap of 50B facing competitive pressure in software and bitcoin treasury sectors.
- Diversified revenue from software licenses, maintenance, subscriptions, and tech services.
- Exposure to disruption through AI-powered analytics and bitcoin-related financial products.
Perfect Corp.
- Small market cap of 179M operating in AI and AR beauty tech niche.
- Concentrated on SaaS AI and AR solutions for beauty and fashion industries.
- High exposure via AI and AR innovation in virtual try-ons and beauty technology.
Strategy Inc vs Perfect Corp. Positioning
Strategy Inc has a diversified business model combining bitcoin treasury and enterprise software, providing multiple revenue streams. Perfect Corp. focuses narrowly on AI and AR beauty tech, offering specialized SaaS solutions but with less diversification and scale.
Which has the best competitive advantage?
Both companies are shedding value relative to their cost of capital, but Perfect Corp. shows improving profitability with a growing ROIC trend, while Strategy Inc exhibits a declining ROIC trend, indicating a weaker competitive advantage.
Stock Comparison
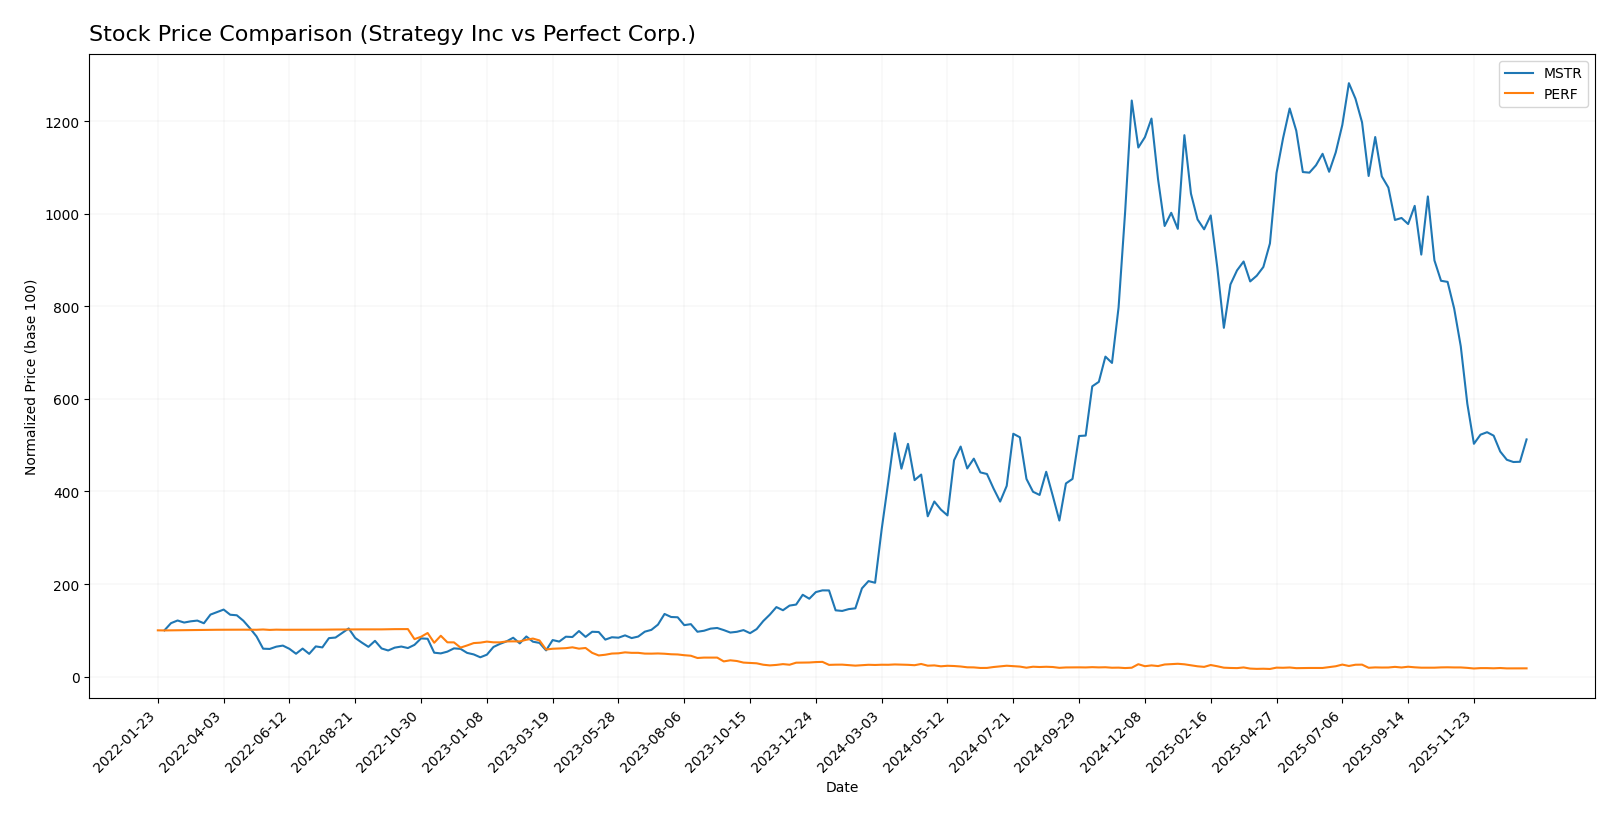
The stock price movements over the past 12 months reveal a strong bullish rally for Strategy Inc (MSTR) contrasted with a sustained bearish trend for Perfect Corp. (PERF), highlighting divergent trading dynamics and market sentiment.
Trend Analysis
Strategy Inc’s stock shows a bullish trend with a 152.71% price increase over the past year, although the growth is decelerating. The stock experienced high volatility with a standard deviation of 103.09 and a peak price of 434.58.
Perfect Corp. displays a bearish trend, declining 28.98% over the same period, also with decelerating movement. Price volatility remains low at 0.27 standard deviation, with a highest price recorded at 2.7.
Comparing both, Strategy Inc delivered the highest market performance with a strong positive return, while Perfect Corp. faced significant losses and weaker trading momentum.
Target Prices
Here is the latest consensus on target prices from verified analysts for these companies:
| Company | Target High | Target Low | Consensus |
|---|---|---|---|
| Strategy Inc | 705 | 175 | 433.57 |
| Perfect Corp. | 7 | 7 | 7 |
Analysts expect Strategy Inc’s stock to have significant upside potential compared to its current price of 173.71 USD. Perfect Corp.’s target consensus is flat at 7 USD, well above its current price of 1.74 USD, indicating a bullish outlook.
Analyst Opinions Comparison
This section compares analysts’ ratings and grades for Strategy Inc and Perfect Corp.:
Rating Comparison
Strategy Inc Rating
- Rating: A-, assessed as Very Favorable overall.
- Discounted Cash Flow Score: 1, indicating a Very Unfavorable valuation.
- ROE Score: 4, considered Favorable for profit generation efficiency.
- ROA Score: 5, rated Very Favorable for asset utilization.
- Debt To Equity Score: 3, Moderate financial risk level.
- Overall Score: 4, Favorable financial standing summary.
Perfect Corp. Rating
- Rating: A-, assessed as Very Favorable overall.
- Discounted Cash Flow Score: 5, indicating a Very Favorable valuation.
- ROE Score: 2, considered Moderate for profit generation efficiency.
- ROA Score: 3, rated Moderate for asset utilization.
- Debt To Equity Score: 4, Favorable lower financial risk.
- Overall Score: 4, Favorable financial standing summary.
Which one is the best rated?
Both companies hold an identical A- rating and a Favorable overall score of 4. Strategy Inc scores higher on ROE and ROA, while Perfect Corp. has a significantly better Discounted Cash Flow and Debt to Equity score, reflecting different strengths in financial metrics.
Scores Comparison
The following table compares the Altman Z-Score and Piotroski Score for Strategy Inc and Perfect Corp.:
Strategy Inc Scores
- Altman Z-Score: 2.78, in the grey zone indicating moderate bankruptcy risk.
- Piotroski Score: 4, categorized as average financial strength.
Perfect Corp. Scores
- Altman Z-Score: 1.31, in the distress zone indicating high bankruptcy risk.
- Piotroski Score: 6, categorized as average financial strength.
Which company has the best scores?
Based strictly on the provided data, Strategy Inc has a better Altman Z-Score, indicating lower bankruptcy risk, while Perfect Corp. has a higher Piotroski Score. Both show average financial strength by Piotroski standards.
Grades Comparison
Here is a detailed comparison of the latest reliable grades for Strategy Inc and Perfect Corp.:
Strategy Inc Grades
The table below shows recent analyst grades for Strategy Inc from verified grading companies.
| Grading Company | Action | New Grade | Date |
|---|---|---|---|
| Mizuho | Maintain | Outperform | 2026-01-16 |
| TD Cowen | Maintain | Buy | 2026-01-15 |
| Citigroup | Maintain | Buy | 2025-12-22 |
| Bernstein | Maintain | Outperform | 2025-12-08 |
| Monness, Crespi, Hardt | Upgrade | Neutral | 2025-11-10 |
| HC Wainwright & Co. | Maintain | Buy | 2025-11-03 |
| Canaccord Genuity | Maintain | Buy | 2025-11-03 |
| BTIG | Maintain | Buy | 2025-10-31 |
| Cantor Fitzgerald | Maintain | Overweight | 2025-10-31 |
| TD Cowen | Maintain | Buy | 2025-10-31 |
Strategy Inc shows a consistent pattern of buy and outperform ratings, with most recent upgrades and no downgrades.
Perfect Corp. Grades
The table below shows recent analyst grades for Perfect Corp. from verified grading companies.
| Grading Company | Action | New Grade | Date |
|---|---|---|---|
| Piper Sandler | Maintain | Neutral | 2024-02-29 |
| Goldman Sachs | Maintain | Neutral | 2023-10-26 |
| Piper Sandler | Maintain | Neutral | 2023-10-25 |
| Piper Sandler | Maintain | Neutral | 2023-07-26 |
| Piper Sandler | Maintain | Neutral | 2023-07-25 |
| Piper Sandler | Maintain | Neutral | 2023-04-27 |
| Oppenheimer | Downgrade | Perform | 2023-04-20 |
| Oppenheimer | Downgrade | Perform | 2023-04-19 |
| Oppenheimer | Downgrade | Perform | 2023-04-18 |
| Piper Sandler | Maintain | Neutral | 2023-03-08 |
Perfect Corp. grades predominantly remain neutral with some downgrades from outperform to perform, indicating a cautious stance.
Which company has the best grades?
Strategy Inc consistently receives buy and outperform ratings, reflecting stronger analyst confidence compared to Perfect Corp.’s mostly neutral grades. This difference may affect investor sentiment and potential portfolio positioning.
Strengths and Weaknesses
Below is a comparative table summarizing the main strengths and weaknesses of Strategy Inc (MSTR) and Perfect Corp. (PERF) based on recent financial performance and market positioning.
| Criterion | Strategy Inc (MSTR) | Perfect Corp. (PERF) |
|---|---|---|
| Diversification | Moderate: Revenue from licenses, maintenance, subscriptions, and tech services | Limited data on diversification; likely focused in core business |
| Profitability | Very unfavorable: Negative net margin (-252%), ROIC and ROE negative | Slightly unfavorable: Positive net margin (8.3%), but ROIC and ROE slightly negative or low |
| Innovation | Moderate: Stable tech services revenue but declining profitability | Moderate: Improving ROIC trend indicates growing profitability potential |
| Global presence | Established through product segmentation and service offerings | Presumed smaller global footprint; no segmentation data available |
| Market Share | Struggling: Declining ROIC and value destruction | Slightly unfavorable: Growing ROIC but still shedding value |
Key takeaways: Strategy Inc faces serious profitability and value destruction issues despite diversified revenue streams. Perfect Corp. shows some promising signs with improving profitability trends but remains slightly unfavorable overall. Investors should weigh risk carefully and watch for operational improvements.
Risk Analysis
Below is a comparative table outlining key risk factors for Strategy Inc (MSTR) and Perfect Corp. (PERF) as of 2024:
| Metric | Strategy Inc (MSTR) | Perfect Corp. (PERF) |
|---|---|---|
| Market Risk | High (Beta 3.43, volatile price range 149.75-457.22) | Low (Beta 0.45, stable price range 1.51-2.87) |
| Debt Level | Moderate (Debt/Assets 28.09%, favorable) | Very Low (Debt/Assets 0.28%, favorable) |
| Regulatory Risk | Moderate (Bitcoin exposure may invite scrutiny) | Moderate (Tech and AI regulations in Taiwan & global markets) |
| Operational Risk | Moderate (Negative margins and ROE, product diversification) | Moderate (Negative ROIC, but positive net margin) |
| Environmental Risk | Low (Technology sector, limited direct impact) | Low (Technology sector, limited direct impact) |
| Geopolitical Risk | Moderate (US-based with international markets) | Moderate to High (Taiwan location with geopolitical tensions) |
In summary, Strategy Inc faces the most impactful risk from market volatility driven by its high beta and exposure to Bitcoin-related assets, while Perfect Corp.’s key risk lies in geopolitical tensions affecting Taiwan. Both companies show moderate operational risks due to mixed profitability and efficiency metrics, warranting cautious consideration by investors.
Which Stock to Choose?
Strategy Inc (MSTR) shows a declining income trend with unfavorable profitability and financial ratios in 2024, including a negative net margin (-251.73%) and return on equity (-6.4%). Despite moderate debt levels and a strong overall rating (A-), the company is shedding value with a very unfavorable moat status.
Perfect Corp. (PERF) exhibits favorable income growth and a positive net margin (8.34%) in 2024, though some ratios like return on equity (3.42%) remain unfavorable. The company maintains low debt and a very favorable rating (A-), yet it is also shedding value, albeit with a slightly unfavorable moat and improving profitability trend.
For investors, Strategy Inc’s very unfavorable moat and deteriorating income suggest higher risk, while Perfect Corp.’s favorable income growth and improving moat might appeal more to those seeking growth potential despite some financial weaknesses. Conservative investors might view both stocks with caution given their challenges.
Disclaimer: Investment carries a risk of loss of initial capital. The past performance is not a reliable indicator of future results. Be sure to understand risks before making an investment decision.
Go Further
I encourage you to read the complete analyses of Strategy Inc and Perfect Corp. to enhance your investment decisions: