Choosing the right tech company to invest in requires careful analysis of market position and innovation. Shopify Inc. (SHOP) and Perfect Corp. (PERF) both operate in the software application sector but serve distinct niches: e-commerce platforms versus AI-driven beauty and fashion tech. Their growth strategies and market dynamics offer unique investment opportunities. In this article, I will help you determine which company presents the most compelling case for your portfolio.
Table of contents
Companies Overview
I will begin the comparison between Shopify Inc. and Perfect Corp. by providing an overview of these two companies and their main differences.
Shopify Inc. Overview
Shopify Inc. is a Canadian commerce company operating a comprehensive platform that supports merchants in managing, marketing, and selling products across multiple sales channels worldwide. Its services include product management, order processing, payments, fulfillment, merchant solutions, and access to financing. Founded in 2004 and headquartered in Ottawa, Shopify is a leading player in the software application industry with a market cap of $205B.
Perfect Corp. Overview
Perfect Corp., based in New Taipei City, Taiwan, specializes in SaaS artificial intelligence and augmented reality solutions for the beauty and fashion tech sectors. It offers a wide range of virtual try-on and AI-powered analysis tools through its applications. Established in 2015, Perfect operates in the software application industry with a market cap of $178M, providing innovative AR and AI experiences to enhance consumer engagement.
Key similarities and differences
Both companies operate in the software application sector, leveraging technology to deliver specialized digital solutions. Shopify focuses on e-commerce platform services facilitating multi-channel retail operations, while Perfect Corp. centers on AI and AR-driven beauty and fashion tech applications. They differ significantly in scale, with Shopify’s market cap vastly exceeding Perfect’s, and also in geographic base, with Shopify headquartered in Canada and Perfect in Taiwan.
Income Statement Comparison
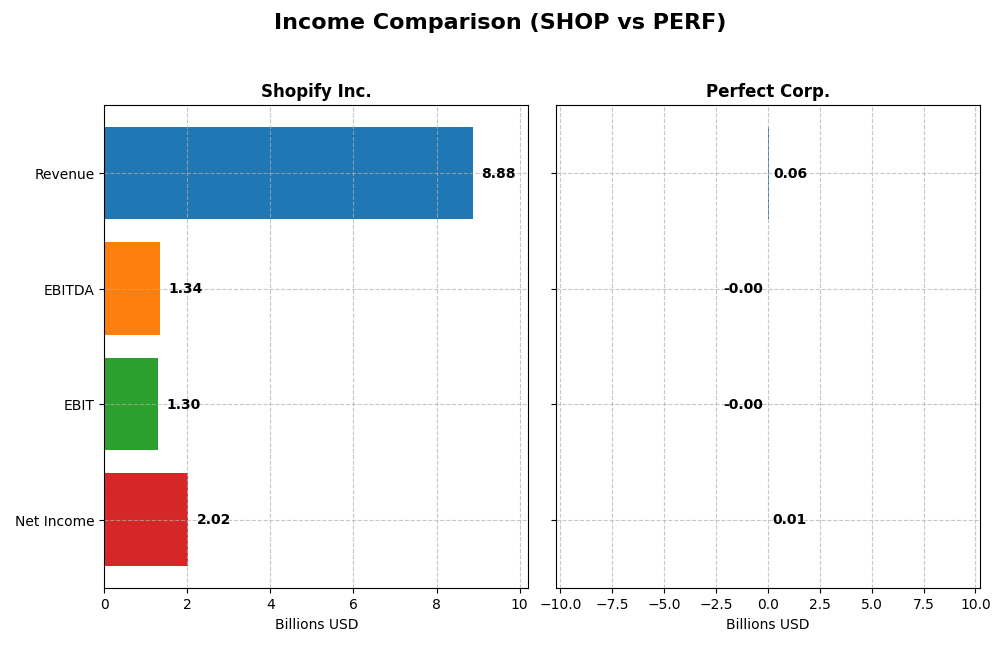
The following table compares the key income statement metrics for Shopify Inc. and Perfect Corp. for the fiscal year 2024.
| Metric | Shopify Inc. (SHOP) | Perfect Corp. (PERF) |
|---|---|---|
| Market Cap | 205B | 178M |
| Revenue | 8.88B | 60.2M |
| EBITDA | 1.34B | -2.05M |
| EBIT | 1.30B | -2.84M |
| Net Income | 2.02B | 5.02M |
| EPS | 1.56 | 0.05 |
| Fiscal Year | 2024 | 2024 |
Income Statement Interpretations
Shopify Inc.
Shopify’s revenue and net income have shown strong upward trends from 2020 to 2024, with revenue more than tripling to 8.88B and net income surging to 2.02B. Margins have improved significantly, with a gross margin of 50.36% and net margin of 22.74% in 2024. The latest year saw outstanding growth, with net margin and EPS increasing over 1100% and 1400% respectively.
Perfect Corp.
Perfect Corp. experienced steady revenue growth, reaching 60.2M in 2024, doubling since 2020. Net income improved to 5M despite a negative EBIT margin of -4.72%, reflecting operational challenges. The gross margin remains strong at 77.98%. However, EBIT and net margin declined in the most recent year, indicating some profit pressure despite overall favorable growth in net income and EPS.
Which one has the stronger fundamentals?
Shopify demonstrates robust fundamentals with consistent and substantial growth in revenue, net income, and margins, supported by zero interest expense and strong operating performance. Perfect Corp. shows solid revenue expansion and high gross margins, but EBIT weakness and margin decline signal operational inefficiencies. Overall, Shopify’s financial metrics present a more favorable and stable foundation.
Financial Ratios Comparison
The table below provides a side-by-side comparison of key financial ratios for Shopify Inc. and Perfect Corp. based on the latest fiscal year ending 2024.
| Ratios | Shopify Inc. (SHOP) | Perfect Corp. (PERF) |
|---|---|---|
| ROE | 17.47% | 3.42% |
| ROIC | 7.55% | -2.10% |
| P/E | 68.18 | 56.60 |
| P/B | 11.91 | 1.93 |
| Current Ratio | 3.71 | 5.52 |
| Quick Ratio | 3.70 | 5.52 |
| D/E (Debt-to-Equity) | 0.10 | 0.0035 |
| Debt-to-Assets | 8.09% | 0.28% |
| Interest Coverage | 0 | -449 |
| Asset Turnover | 0.64 | 0.33 |
| Fixed Asset Turnover | 63.43 | 57.94 |
| Payout Ratio | 0 | 0 |
| Dividend Yield | 0% | 0% |
Interpretation of the Ratios
Shopify Inc.
Shopify displays generally strong ratios, with a favorable net margin of 22.74% and return on equity at 17.47%, indicating profitability and shareholder value creation. However, its high price-to-earnings (PE) ratio of 68.18 and price-to-book (PB) ratio of 11.91 suggest overvaluation risks, while the current ratio at 3.71 is marked unfavorable. Shopify does not pay dividends, likely reinvesting earnings to fuel growth, aligning with its high valuation and technology sector positioning.
Perfect Corp.
Perfect Corp. shows mixed financial health; net margin stands neutral at 8.34%, but returns on equity and invested capital are unfavorable, reflecting lower profitability. The company benefits from a low weighted average cost of capital (WACC) of 5.91%, yet challenges include negative interest coverage and asset turnover. Perfect Corp. does not issue dividends, probably prioritizing reinvestment and product development given its smaller market cap and growth focus.
Which one has the best ratios?
Shopify holds the advantage with a higher proportion of favorable ratios, including strong profitability and efficient asset utilization, despite some valuation and liquidity concerns. Perfect Corp. faces more unfavorable metrics, especially in profitability and coverage ratios, suggesting more financial strain. Overall, Shopify’s ratios appear more robust in the current comparison.
Strategic Positioning
This section compares the strategic positioning of Shopify Inc. and Perfect Corp., including market position, key segments, and exposure to technological disruption:
Shopify Inc.
- Leading global commerce platform with large market cap and high competitive pressure
- Diverse revenue streams from merchant solutions and subscription services
- Moderate exposure to disruption through evolving e-commerce and payment technologies
Perfect Corp.
- Smaller market cap focused on AI and AR beauty and fashion tech with moderate competition
- Concentrated on SaaS AI and AR virtual try-on and beauty tech applications
- High exposure to innovation in AI and augmented reality technologies
Shopify Inc. vs Perfect Corp. Positioning
Shopify follows a diversified commerce platform strategy with broad merchant and subscription services, offering scale advantages. Perfect Corp. concentrates on niche AI-driven beauty and fashion tech, focusing on innovation but with limited scale and market presence.
Which has the best competitive advantage?
Both companies are slightly unfavorable in MOAT evaluation, shedding value but showing improving profitability. Shopify’s larger scale contrasts with Perfect’s niche innovation; neither currently demonstrates a strong sustainable competitive advantage.
Stock Comparison
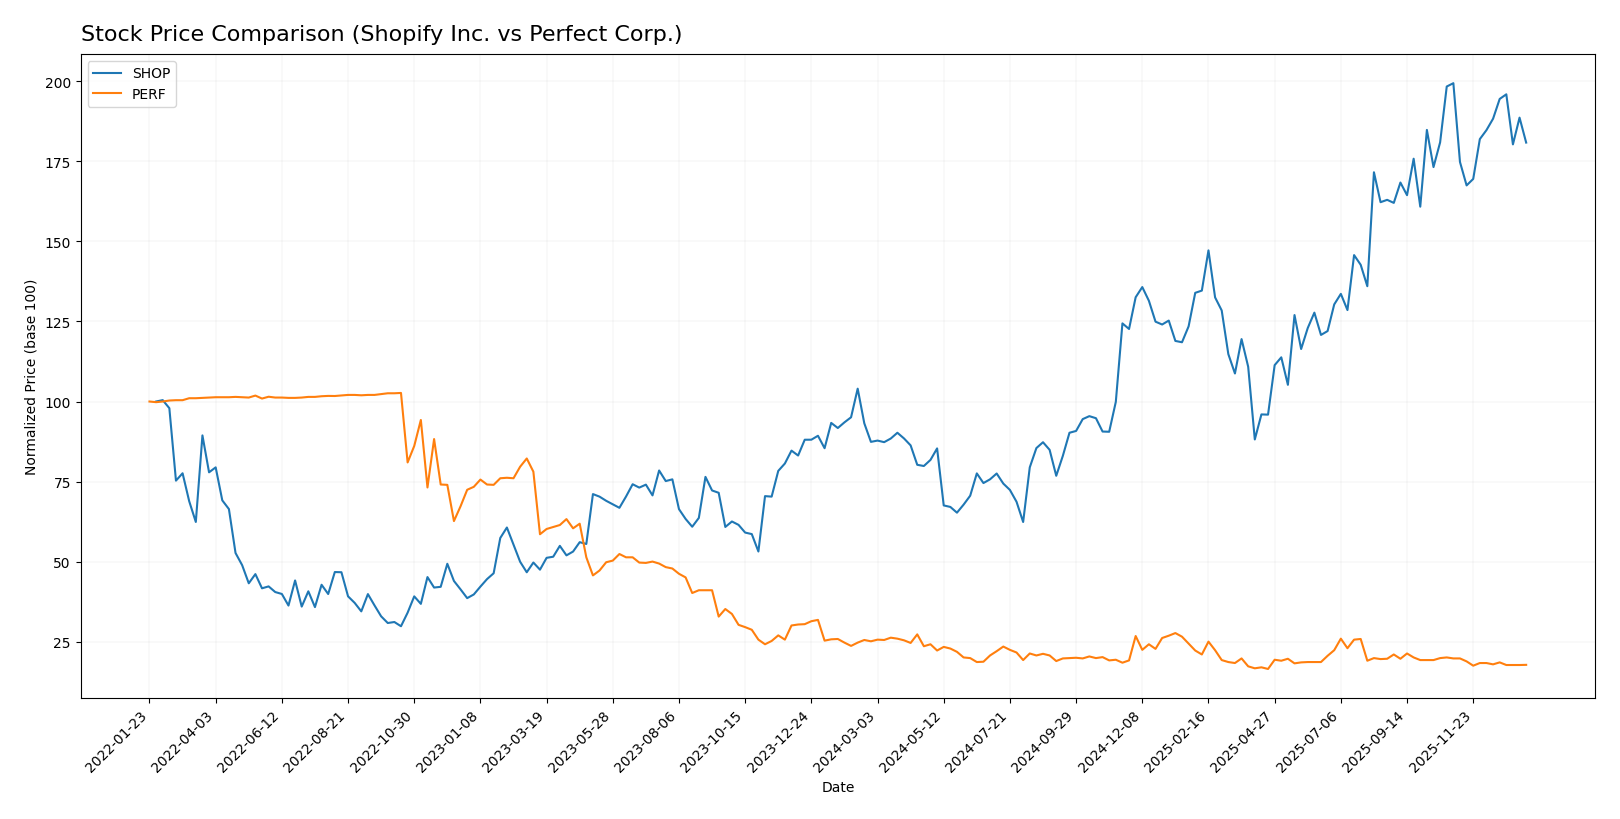
The stock price movements over the past year reveal significant divergence, with Shopify Inc. exhibiting strong gains amid decelerating momentum, while Perfect Corp. experienced notable declines with weakening bearish pressure.
Trend Analysis
Shopify Inc. showed a bullish trend over the past 12 months with a 106.83% price increase, although the trend is decelerating. Price volatility is elevated, with a 33.71 standard deviation and a high of 173.86 and low of 54.43.
Perfect Corp. recorded a bearish trend with a 29.18% price decline over the same period, also decelerating. The stock’s volatility is low, with a 0.27 standard deviation and prices ranging between 1.61 and 2.7.
Comparing both, Shopify delivered the highest market performance with a strong bullish trend, while Perfect Corp. underperformed with a sustained bearish trend.
Target Prices
Here is the consensus target price outlook from verified analysts for the selected companies:
| Company | Target High | Target Low | Consensus |
|---|---|---|---|
| Shopify Inc. | 200 | 140 | 186.24 |
| Perfect Corp. | 7 | 7 | 7 |
Analysts expect Shopify’s stock to appreciate from its current price of 157.48 USD, indicating bullish sentiment. Perfect Corp.’s target is significantly above its current price of 1.73 USD, suggesting substantial upside potential.
Analyst Opinions Comparison
This section compares analysts’ ratings and grades for Shopify Inc. and Perfect Corp.:
Rating Comparison
SHOP Rating
- Rating: B, evaluated as Very Favorable overall.
- Discounted Cash Flow Score: 3, indicating a Moderate valuation outlook.
- ROE Score: 4, showing a Favorable efficiency in generating profit from equity.
- ROA Score: 5, rated Very Favorable for asset utilization.
- Debt To Equity Score: 3, assessed as Moderate financial risk.
- Overall Score: 3, reflecting a Moderate overall financial standing.
PERF Rating
- Rating: A-, evaluated as Very Favorable overall.
- Discounted Cash Flow Score: 5, indicating a Very Favorable valuation outlook.
- ROE Score: 2, showing a Moderate efficiency in generating profit from equity.
- ROA Score: 3, rated Moderate for asset utilization.
- Debt To Equity Score: 4, assessed as Favorable financial risk management.
- Overall Score: 4, reflecting a Favorable overall financial standing.
Which one is the best rated?
Based on the data, Perfect Corp. holds a higher overall rating (A-) and better scores in discounted cash flow and debt-to-equity, whereas Shopify excels in return on assets and equity. Perfect Corp. is generally better rated overall.
Scores Comparison
Here is a comparison of the Altman Z-Score and Piotroski Score for the two companies:
SHOP Scores
- Altman Z-Score: 50.42, indicating a safe zone with very low bankruptcy risk.
- Piotroski Score: 6, classified as average financial strength.
PERF Scores
- Altman Z-Score: 1.31, in the distress zone, suggesting high bankruptcy risk.
- Piotroski Score: 6, classified as average financial strength.
Which company has the best scores?
Shopify Inc. shows a significantly higher Altman Z-Score, placing it clearly in the safe zone, while Perfect Corp. is in distress. Both companies share the same average Piotroski Score of 6.
Grades Comparison
Here is a summary of recent grades assigned to Shopify Inc. and Perfect Corp. by recognized grading companies:
Shopify Inc. Grades
The table below presents recent grade updates from credible financial institutions for Shopify Inc.:
| Grading Company | Action | New Grade | Date |
|---|---|---|---|
| Scotiabank | Upgrade | Sector Outperform | 2026-01-08 |
| Wolfe Research | Downgrade | Peer Perform | 2026-01-06 |
| Wells Fargo | Maintain | Overweight | 2025-12-17 |
| Truist Securities | Maintain | Hold | 2025-11-05 |
| CIBC | Maintain | Outperform | 2025-11-05 |
| Cantor Fitzgerald | Maintain | Neutral | 2025-11-05 |
| DA Davidson | Maintain | Buy | 2025-11-05 |
| Scotiabank | Maintain | Sector Perform | 2025-11-05 |
| Needham | Maintain | Buy | 2025-11-05 |
| JP Morgan | Maintain | Overweight | 2025-11-05 |
Shopify’s grades largely reflect a positive to neutral outlook, with several “Buy” and “Outperform” ratings and only one recent downgrade to “Peer Perform.”
Perfect Corp. Grades
The table below shows recent grades from recognized financial institutions for Perfect Corp.:
| Grading Company | Action | New Grade | Date |
|---|---|---|---|
| Piper Sandler | Maintain | Neutral | 2024-02-29 |
| Goldman Sachs | Maintain | Neutral | 2023-10-26 |
| Piper Sandler | Maintain | Neutral | 2023-10-25 |
| Piper Sandler | Maintain | Neutral | 2023-07-26 |
| Piper Sandler | Maintain | Neutral | 2023-07-25 |
| Piper Sandler | Maintain | Neutral | 2023-04-27 |
| Oppenheimer | Downgrade | Perform | 2023-04-20 |
| Oppenheimer | Downgrade | Perform | 2023-04-19 |
| Oppenheimer | Downgrade | Perform | 2023-04-18 |
| Piper Sandler | Maintain | Neutral | 2023-03-08 |
Perfect Corp.’s grades show a consistent “Neutral” stance, with multiple downgrades from “Outperform” to “Perform” by Oppenheimer in 2023, indicating more cautious sentiment.
Which company has the best grades?
Shopify Inc. has received more favorable grades overall, with a consensus “Buy” and multiple “Outperform” and “Buy” ratings versus Perfect Corp.’s consistent “Neutral” consensus and recent downgrades. This suggests investors may view Shopify as having stronger growth prospects and a more positive market assessment.
Strengths and Weaknesses
Below is a comparative overview of key strengths and weaknesses for Shopify Inc. (SHOP) and Perfect Corp. (PERF) based on the latest financial and strategic data.
| Criterion | Shopify Inc. (SHOP) | Perfect Corp. (PERF) |
|---|---|---|
| Diversification | Moderate; primarily e-commerce services with growing subscription revenue | Limited; focused mainly on beauty tech solutions |
| Profitability | Strong net margin (22.74%), ROE (17.47%), but ROIC below WACC indicating value destruction | Lower net margin (8.34%), weak ROE (3.42%), negative ROIC, also shedding value |
| Innovation | High; substantial growth in ROIC trend (+514%), ongoing platform enhancements | Moderate; positive ROIC trend (+46%) but still unprofitable overall |
| Global presence | Extensive, serving merchants worldwide with scalable solutions | More niche, less global but growing in select markets |
| Market Share | Significant in e-commerce platform space | Smaller, specialized player in AI beauty tech |
Key takeaways: Both companies face challenges as they currently destroy value relative to their capital costs. Shopify’s strong profitability ratios and rapid ROIC growth indicate potential for improvement. Perfect Corp. shows innovation promise but needs to address profitability and wider market penetration for a stronger competitive position.
Risk Analysis
Below is a comparative table outlining key risks for Shopify Inc. (SHOP) and Perfect Corp. (PERF) based on the most recent 2024 data:
| Metric | Shopify Inc. (SHOP) | Perfect Corp. (PERF) |
|---|---|---|
| Market Risk | High (Beta 2.84, volatile) | Low (Beta 0.454, stable) |
| Debt Level | Low (Debt/Equity 0.1) | Very Low (Debt/Equity 0.0) |
| Regulatory Risk | Moderate (Global operations) | Moderate (Tech & privacy laws) |
| Operational Risk | Moderate (Complex platform) | Moderate (AI integration) |
| Environmental Risk | Low | Low |
| Geopolitical Risk | Moderate (North America focus) | Higher (Taiwan base, geopolitical tensions) |
Shopify faces significant market risk due to high volatility and unfavorable valuation multiples, while maintaining strong financial stability with low debt. Perfect Corp. shows financial vulnerability with a distress-level Altman Z-score and geopolitical risks linked to its Taiwan base, despite low debt and stable market risk. Caution advised on Perfect Corp.’s financial health and geopolitical exposure.
Which Stock to Choose?
Shopify Inc. (SHOP) has shown strong income growth with a 25.78% revenue increase in 2024 and favorable profitability ratios, including a 22.74% net margin and 17.47% ROE. Its debt levels are low and comfortably managed, supported by a very favorable debt-to-equity ratio and interest coverage. Overall, SHOP holds a very favorable B rating with a slightly favorable global ratios evaluation, despite some unfavorable valuation multiples.
Perfect Corp. (PERF) demonstrates moderate income growth with a 12.52% revenue increase in 2024 and mixed profitability metrics, including an 8.34% net margin but unfavorable ROE and ROIC. The company maintains minimal debt levels, reflected in favorable debt-to-assets and debt-to-equity scores, yet it faces unfavorable interest coverage. PERF’s overall rating is very favorable at A-, but its global ratios evaluation is slightly unfavorable.
From an investor’s perspective, SHOP’s robust income growth and stronger profitability ratios might appeal to growth-oriented profiles, while PERF’s solid debt management and very favorable rating could be more attractive to risk-tolerant investors seeking value despite some operational challenges. The global evaluation suggests SHOP is slightly better positioned financially, whereas PERF’s financial health appears less consistent but improving.
Disclaimer: Investment carries a risk of loss of initial capital. The past performance is not a reliable indicator of future results. Be sure to understand risks before making an investment decision.
Go Further
I encourage you to read the complete analyses of Shopify Inc. and Perfect Corp. to enhance your investment decisions: