In today’s fast-evolving technology landscape, choosing the right software company to invest in requires careful analysis. Salesforce, Inc. (CRM) and Perfect Corp. (PERF) both operate in the software application industry but target different niches—CRM leads in customer relationship management, while PERF innovates in AI-driven beauty and fashion tech. This article will explore their strategies and market positions to help you decide which company holds the most promise for your investment portfolio.
Table of contents
Companies Overview
I will begin the comparison between Salesforce and Perfect Corp. by providing an overview of these two companies and their main differences.
Salesforce Overview
Salesforce, Inc. is a leading provider of customer relationship management (CRM) technology designed to connect companies with their customers worldwide. Its Customer 360 platform integrates sales, service, marketing, and commerce functionalities, supported by analytics and AI-powered tools such as Tableau and MuleSoft. Headquartered in San Francisco, Salesforce serves diverse industries including financial services and healthcare, employing over 76K people.
Perfect Corp. Overview
Perfect Corp. specializes in SaaS artificial intelligence and augmented reality solutions for the beauty and fashion industries. The company offers innovative virtual try-on applications and AI-driven analysis tools across multiple product categories, aiming to enhance customer engagement through immersive experiences. Founded in 2015 and based in New Taipei City, Perfect Corp. employs around 340 staff and has a market cap of approximately 179M USD.
Key similarities and differences
Both Salesforce and Perfect Corp. operate in the software application industry with a focus on technology-driven customer engagement. Salesforce targets broad enterprise CRM solutions across multiple sectors with a large workforce and global footprint, while Perfect Corp. focuses on niche AI and AR applications in beauty and fashion with a smaller scale. Their business models differ mainly in scope, scale, and industry specialization.
Income Statement Comparison
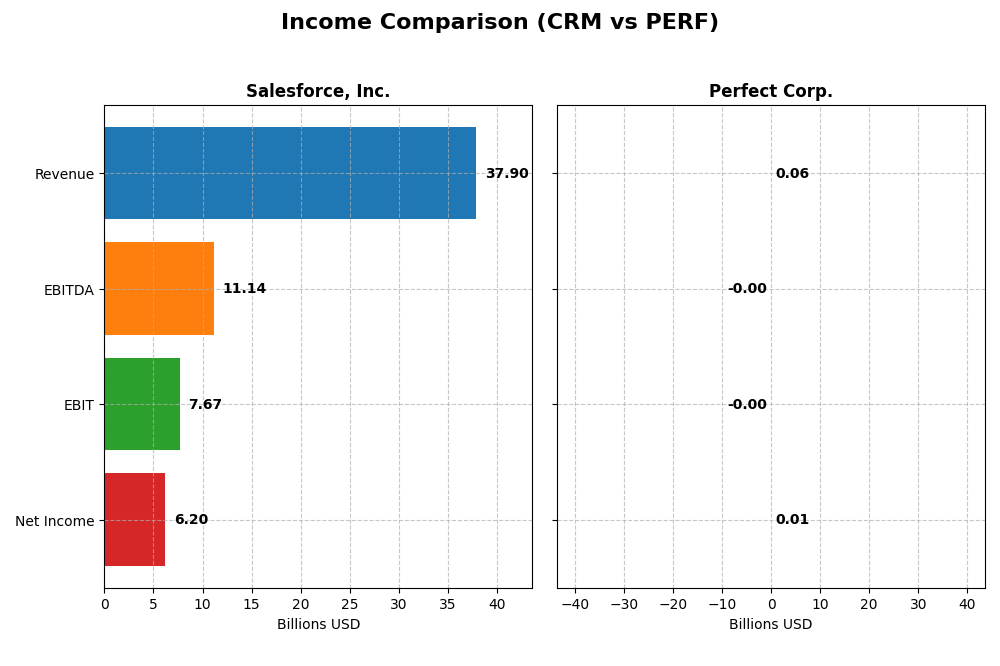
Below is a side-by-side comparison of key income statement metrics for Salesforce, Inc. and Perfect Corp. based on their most recent fiscal year results.
| Metric | Salesforce, Inc. (CRM) | Perfect Corp. (PERF) |
|---|---|---|
| Market Cap | 219.4B | 179M |
| Revenue | 37.9B | 60.2M |
| EBITDA | 11.1B | -2.0M |
| EBIT | 7.67B | -2.8M |
| Net Income | 6.20B | 5.02M |
| EPS | 6.44 | 0.05 |
| Fiscal Year | 2025 | 2024 |
Income Statement Interpretations
Salesforce, Inc.
Salesforce showed a strong upward trend in revenue and net income from 2021 to 2025, with revenue reaching $37.9B and net income $6.2B in 2025. Margins remained robust, notably a 77.19% gross margin and a 16.35% net margin, though net margin slightly declined overall. The latest year saw favorable growth in revenue (+8.7%) and net income (+37.8%), with improved EBIT margin signaling enhanced profitability.
Perfect Corp.
Perfect Corp. experienced an overall revenue increase to $60.2M in 2024, with net income of $5.0M. Gross margin stayed high at about 78%, but EBIT margin was negative at -4.7%, indicating operating losses despite positive net income. The most recent year showed favorable revenue growth (+12.5%) but EBIT and net margin declined, reflecting operational challenges despite expanding top-line and earnings per share.
Which one has the stronger fundamentals?
Salesforce displays stronger fundamentals with consistently favorable margins, significant scale, and solid net income growth, supported by favorable operational efficiency and profitability metrics. Perfect Corp. shows good revenue growth and improving net income but struggles with negative EBIT margins and higher operational costs. Salesforce’s financials suggest more stable and scalable earnings compared to Perfect Corp.’s more volatile profitability.
Financial Ratios Comparison
The table below compares the key financial ratios of Salesforce, Inc. and Perfect Corp. for their most recent fiscal year, providing an overview of profitability, liquidity, leverage, efficiency, and shareholder returns.
| Ratios | Salesforce, Inc. (2025) | Perfect Corp. (2024) |
|---|---|---|
| ROE | 10.13% | 3.42% |
| ROIC | 7.95% | -2.10% |
| P/E | 53.04 | 56.6 |
| P/B | 5.37 | 1.93 |
| Current Ratio | 1.06 | 5.52 |
| Quick Ratio | 1.06 | 5.52 |
| D/E (Debt-to-Equity) | 0.19 | 0.0035 |
| Debt-to-Assets | 11.07% | 0.28% |
| Interest Coverage | 26.49 | -449 |
| Asset Turnover | 0.37 | 0.33 |
| Fixed Asset Turnover | 7.03 | 57.94 |
| Payout ratio | 24.80% | 0% |
| Dividend yield | 0.47% | 0% |
Interpretation of the Ratios
Salesforce, Inc.
Salesforce shows a mix of favorable and unfavorable ratios, with a net margin of 16.35% rated favorable, but a high P/E of 53.04 and P/B of 5.37 considered unfavorable. Its debt levels and interest coverage are strong, while asset turnover is weak. The company pays dividends with a low yield of 0.47%, indicating modest shareholder returns and potential caution regarding payout sustainability.
Perfect Corp.
Perfect Corp. presents several unfavorable ratios, including a negative ROIC of -2.1% and an interest coverage ratio deeply negative at -406.29, despite a favorable WACC of 5.91%. The company does not pay dividends, reflecting a growth or reinvestment strategy typical for its stage. Its high current and quick ratios suggest strong liquidity, but low returns raise concerns.
Which one has the best ratios?
Salesforce’s ratios appear slightly favorable overall, benefiting from solid profitability and manageable debt, though valuation metrics are stretched. Perfect Corp. is rated slightly unfavorable due to profitability and coverage issues, despite strong liquidity and low leverage. Hence, Salesforce demonstrates a more balanced ratio profile compared to Perfect Corp.
Strategic Positioning
This section compares the strategic positioning of Salesforce and Perfect Corp., including market position, key segments, and exposure to technological disruption:
Salesforce, Inc.
- Leading global CRM provider with significant market cap and competitive pressure on NYSE.
- Diverse SaaS offerings across CRM, analytics, marketing, service, commerce, and platform solutions.
- Exposure to technological disruption through integration of AI and analytics in CRM and platform services.
Perfect Corp.
- Smaller market cap, niche player in AI and AR beauty tech with lower competitive pressure.
- Focused SaaS business in AI and AR for beauty and fashion virtual try-on applications.
- Technological disruption driven by AI and augmented reality innovations in beauty tech.
Salesforce vs Perfect Corp. Positioning
Salesforce demonstrates a diversified approach with multiple cloud-based segments and broad industry reach, while Perfect Corp. concentrates on AI-driven beauty and fashion tech solutions. Salesforce’s scale offers broad business drivers; Perfect Corp.’s niche focus may limit market breadth but targets specific innovation areas.
Which has the best competitive advantage?
Both companies are shedding value according to MOAT evaluations but show growing ROIC trends. Their competitive advantage is slightly unfavorable, reflecting challenges in profitability despite increasing operational efficiency over recent years.
Stock Comparison
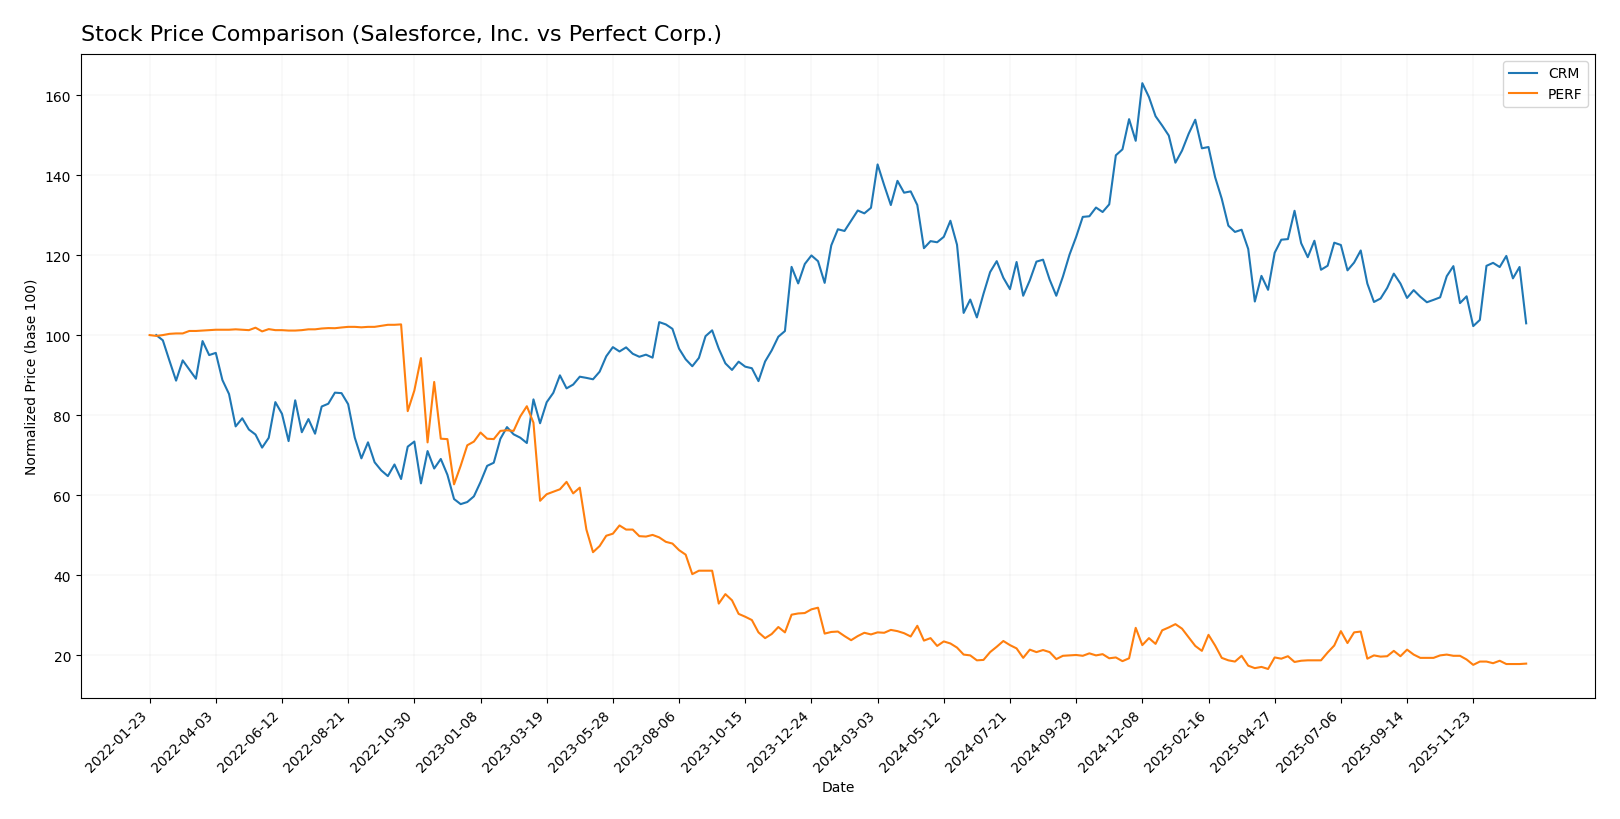
The stock prices of Salesforce, Inc. (CRM) and Perfect Corp. (PERF) have exhibited notable bearish trends over the past 12 months, with CRM showing accelerated decline amid high volatility, while PERF’s downward movement has decelerated with minimal price fluctuations.
Trend Analysis
Salesforce, Inc. (CRM) experienced a 21.91% decrease in stock price over the past year, indicating a bearish trend with accelerating decline and significant volatility reflected by a 31.8 standard deviation. The stock peaked at 361.99 and bottomed at 227.11.
Perfect Corp. (PERF) saw a 28.98% drop over the same period, also bearish but with decelerating trend and low volatility at 0.27 standard deviation. Its price ranged between 2.7 and 1.61.
Comparing these trends, CRM’s stock has outperformed PERF’s by delivering a smaller percentage loss over the past year, despite both experiencing bearish movements.
Target Prices
Here is the current analyst target consensus for Salesforce, Inc. and Perfect Corp.
| Company | Target High | Target Low | Consensus |
|---|---|---|---|
| Salesforce, Inc. | 400 | 250 | 324.17 |
| Perfect Corp. | 7 | 7 | 7 |
Analysts expect Salesforce’s stock to rise significantly from its current price of $229.5, reflecting strong growth potential. Perfect Corp.’s target is steady at $7, well above its current $1.74 price, indicating optimistic outlooks.
Analyst Opinions Comparison
This section compares analysts’ ratings and grades for Salesforce, Inc. and Perfect Corp.:
Rating Comparison
Salesforce, Inc. Rating
- Rating: B+, considered Very Favorable by analysts.
- Discounted Cash Flow Score: 4, indicating Favorable valuation based on future cash flows.
- ROE Score: 4, showing strong efficiency in generating profit from equity.
- ROA Score: 4, indicating effective asset utilization for earnings.
- Debt To Equity Score: 3, moderate financial risk with balanced debt levels.
- Overall Score: 3, reflecting a moderate overall financial standing.
Perfect Corp. Rating
- Rating: A-, also classified as Very Favorable.
- Discounted Cash Flow Score: 5, Very Favorable assessment of cash flow projections.
- ROE Score: 2, moderate efficiency in profit generation from equity.
- ROA Score: 3, moderate effectiveness in asset use to generate earnings.
- Debt To Equity Score: 4, favorable financial stability with lower leverage.
- Overall Score: 4, indicating a favorable overall financial condition.
Which one is the best rated?
Based strictly on provided data, Perfect Corp. holds a stronger overall rating (A-) and higher overall score (4) compared to Salesforce’s B+ and score of 3. Perfect Corp. also scores better in discounted cash flow and debt-to-equity metrics, though Salesforce outperforms in profitability ratios.
Scores Comparison
The scores comparison between Salesforce, Inc. and Perfect Corp. provides insight into their financial stability and strength:
Salesforce, Inc. Scores
- Altman Z-Score: 5.26, indicating a safe zone with low bankruptcy risk.
- Piotroski Score: 7, classified as strong financial health.
Perfect Corp. Scores
- Altman Z-Score: 1.31, indicating distress zone with high bankruptcy risk.
- Piotroski Score: 6, classified as average financial health.
Which company has the best scores?
Salesforce, Inc. has the best scores, with a significantly higher Altman Z-Score in the safe zone and a stronger Piotroski Score compared to Perfect Corp., which is in the distress zone and has an average Piotroski Score.
Grades Comparison
Here is a comparison of recent grades from recognized grading companies for the two companies:
Salesforce, Inc. Grades
The following table summarizes recent grades assigned to Salesforce, Inc. by reputable financial institutions:
| Grading Company | Action | New Grade | Date |
|---|---|---|---|
| Barclays | Maintain | Overweight | 2026-01-12 |
| RBC Capital | Maintain | Sector Perform | 2026-01-05 |
| Morgan Stanley | Maintain | Overweight | 2025-12-09 |
| Citigroup | Maintain | Neutral | 2025-12-08 |
| DA Davidson | Maintain | Neutral | 2025-12-05 |
| Citizens | Maintain | Market Outperform | 2025-12-04 |
| Deutsche Bank | Maintain | Buy | 2025-12-04 |
| Wedbush | Maintain | Outperform | 2025-12-04 |
| Northland Capital Markets | Maintain | Market Perform | 2025-12-04 |
| Canaccord Genuity | Maintain | Buy | 2025-12-04 |
Overall, Salesforce has consistently received favorable grades, predominantly “Buy,” “Overweight,” and “Outperform,” indicating positive analyst sentiment.
Perfect Corp. Grades
Recent grades for Perfect Corp. from established grading companies are as follows:
| Grading Company | Action | New Grade | Date |
|---|---|---|---|
| Piper Sandler | Maintain | Neutral | 2024-02-29 |
| Goldman Sachs | Maintain | Neutral | 2023-10-26 |
| Piper Sandler | Maintain | Neutral | 2023-10-25 |
| Piper Sandler | Maintain | Neutral | 2023-07-26 |
| Piper Sandler | Maintain | Neutral | 2023-07-25 |
| Piper Sandler | Maintain | Neutral | 2023-04-27 |
| Oppenheimer | Downgrade | Perform | 2023-04-20 |
| Oppenheimer | Downgrade | Perform | 2023-04-19 |
| Oppenheimer | Downgrade | Perform | 2023-04-18 |
| Piper Sandler | Maintain | Neutral | 2023-03-08 |
Perfect Corp.’s grades have mostly been “Neutral,” with a downgrade from “Outperform” to “Perform” in April 2023, showing a more cautious analyst perspective.
Which company has the best grades?
Salesforce, Inc. holds the stronger ratings with multiple “Buy” and “Overweight” grades, suggesting a generally more optimistic outlook. Perfect Corp.’s grades are mostly “Neutral,” indicating moderate confidence. Investors may perceive Salesforce’s higher grades as a sign of stronger growth expectations or stability.
Strengths and Weaknesses
Below is a comparison of key strengths and weaknesses for Salesforce, Inc. (CRM) and Perfect Corp. (PERF) based on their recent financial and operational data.
| Criterion | Salesforce, Inc. (CRM) | Perfect Corp. (PERF) |
|---|---|---|
| Diversification | Highly diversified revenue streams across multiple clouds and professional services; strong growth in Integration and Analytics segment (5.78B USD in 2025) | Limited diversification data publicly available; core focus on beauty tech solutions |
| Profitability | Net margin 16.35% (favorable); ROIC 7.95% (neutral); currently shedding value vs. WACC but ROIC is improving | Net margin 8.34% (neutral); ROIC -2.1% (unfavorable); also shedding value but with growing profitability |
| Innovation | Strong innovation in cloud platforms and analytics; consistent revenue growth in advanced segments | Innovation focused in AI beauty tech; financials suggest early-stage growth with some profitability challenges |
| Global presence | Extensive global footprint through cloud services and professional offerings | Smaller global presence; niche market focus limits scale |
| Market Share | Leading CRM market position with multiple product lines and significant scale (total revenues exceeding 40B USD in 2025) | Smaller market share in niche beauty tech industry; still expanding |
Key takeaways: Salesforce demonstrates strong diversification and profitability with improving returns despite some value shedding, reflecting its mature growth phase. Perfect Corp. is still in a developing stage with growth potential but shows weaker profitability and limited diversification, requiring cautious risk management for investors.
Risk Analysis
Below is a comparative risk assessment table for Salesforce, Inc. (CRM) and Perfect Corp. (PERF) based on the most recent data available for 2025 and 2024 respectively.
| Metric | Salesforce, Inc. (CRM) | Perfect Corp. (PERF) |
|---|---|---|
| Market Risk | Beta 1.27 indicates moderate volatility with market fluctuations impacting price. | Beta 0.45 suggests lower price volatility relative to the market. |
| Debt Level | Low debt-to-equity ratio (0.19), strong interest coverage (28.18), signaling low financial leverage. | Virtually no debt (0.0 debt-to-equity), but negative interest coverage indicates risk in covering interest expenses. |
| Regulatory Risk | Moderate, as a US-based tech giant facing evolving data privacy and software compliance laws. | Moderate, operating in Taiwan with potential cross-border regulatory challenges in AI and AR tech sectors. |
| Operational Risk | Large workforce (76K employees) and complex global operations increase operational risks. | Smaller scale (342 employees) but dependence on cutting-edge AI/AR tech introduces execution risk. |
| Environmental Risk | Moderate, typical for tech sector, managing energy use in data centers and sustainable practices. | Low to moderate, smaller footprint but emerging regulations on tech sustainability may apply. |
| Geopolitical Risk | Exposure to US-China tensions affecting tech supply chains and international sales. | Higher, due to Taiwan’s geopolitical tensions and reliance on global markets for growth. |
The most likely and impactful risks are market volatility and geopolitical tensions for both companies. Salesforce’s robust financial health and moderate leverage provide some cushion, while Perfect Corp.’s low debt is offset by operational and geopolitical uncertainties, including its distress-level Altman Z-score suggesting higher bankruptcy risk. Investors should weigh these factors carefully when considering exposure in these tech stocks.
Which Stock to Choose?
Salesforce, Inc. (CRM) shows a favorable income evolution with strong revenue and net income growth over recent years. Its financial ratios are slightly favorable overall, with solid profitability metrics and manageable debt levels. The company carries a slightly unfavorable MOAT rating due to ROIC below WACC, but with improving profitability. Its rating is very favorable with moderate overall scores, supported by strong Altman Z and Piotroski scores indicating sound financial health.
Perfect Corp. (PERF) exhibits favorable revenue and net income growth, though its profitability ratios are mixed with some unfavorable returns and high debt-to-EBITDA. The company’s financial ratios lean slightly unfavorable overall, reflecting challenges in value creation as ROIC remains below WACC despite growth trends. Its rating is also very favorable with a higher overall score than CRM, but Altman Z indicates financial distress and a moderate Piotroski score.
For investors prioritizing financial stability and strong income growth, Salesforce may appear more favorable given its robust profitability and sound financial health scores. Conversely, those more tolerant of risk and seeking growth potential might find Perfect Corp.’s improving income and rating appealing despite weaker MOAT and distress signals. The choice could thus depend on the investor’s risk profile and strategic focus.
Disclaimer: Investment carries a risk of loss of initial capital. The past performance is not a reliable indicator of future results. Be sure to understand risks before making an investment decision.
Go Further
I encourage you to read the complete analyses of Salesforce, Inc. and Perfect Corp. to enhance your investment decisions: