In the competitive world of non-alcoholic beverages, PepsiCo, Inc. (PEP) and Keurig Dr Pepper Inc. (KDP) stand out as prominent players with overlapping market footprints. Both companies innovate through diverse product portfolios and strategic distribution, targeting global and domestic consumers alike. This comparison highlights their strengths and challenges, helping you identify which company may offer the most compelling investment opportunity in 2026. Let’s explore which stock deserves a place in your portfolio.
Table of contents
Companies Overview
I will begin the comparison between PepsiCo and Keurig Dr Pepper by providing an overview of these two companies and their main differences.
PepsiCo Overview
PepsiCo, Inc. is a global leader in the non-alcoholic beverages and convenient foods industry. Founded in 1898 and headquartered in Purchase, New York, it operates through seven segments spanning multiple regions worldwide. The company offers a diverse product portfolio including snacks, cereals, beverages, and dairy products, distributing through various channels such as retail, foodservice, and e-commerce. PepsiCo employs approximately 319K people and has a market cap of $193B.
Keurig Dr Pepper Overview
Keurig Dr Pepper Inc. operates primarily in the U.S. and international beverage markets, focusing on coffee systems, packaged beverages, beverage concentrates, and Latin American beverages. Founded in 1981 and based in Burlington, Massachusetts, the company manufactures and distributes well-known brands like Dr Pepper, Canada Dry, and 7UP. With 29K employees and a market cap of $37.6B, Keurig Dr Pepper serves retailers, bottlers, and consumers through multiple distribution channels.
Key similarities and differences
Both companies operate in the non-alcoholic beverages industry and serve a wide range of customers including retailers and distributors. PepsiCo has a broader product portfolio, including food items and beverages, with a global presence across seven segments. In contrast, Keurig Dr Pepper focuses more specifically on beverages, including coffee systems and concentrates, with a strong emphasis on the U.S. market and Latin America. PepsiCo’s workforce and market capitalization are significantly larger than Keurig Dr Pepper’s.
Income Statement Comparison
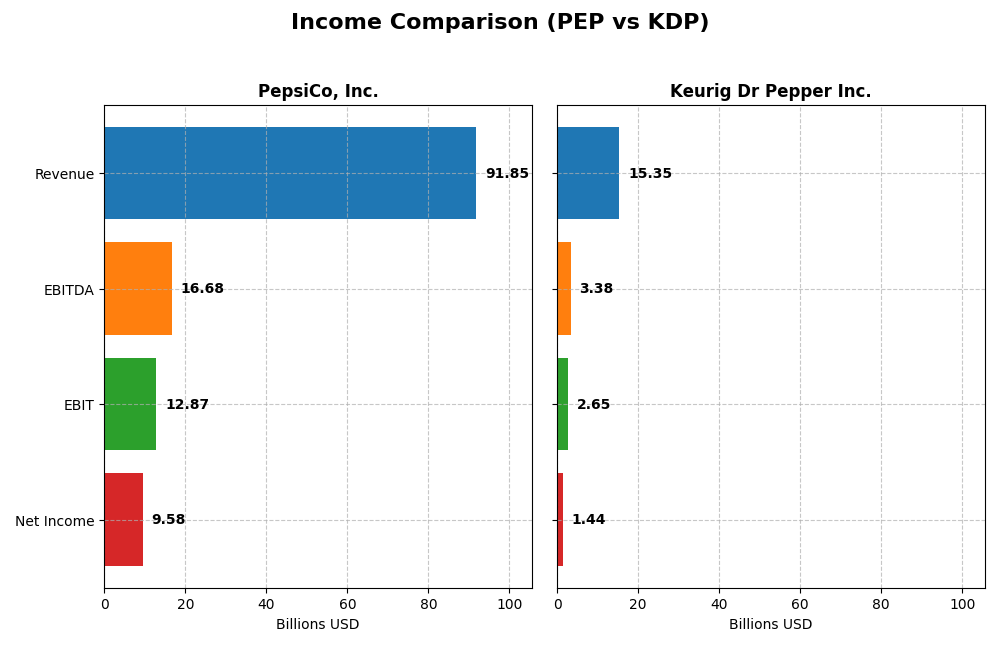
The table below presents a straightforward income statement comparison for PepsiCo, Inc. and Keurig Dr Pepper Inc. using their most recent fiscal year data.
| Metric | PepsiCo, Inc. (PEP) | Keurig Dr Pepper Inc. (KDP) |
|---|---|---|
| Market Cap | 193.3B | 37.6B |
| Revenue | 91.9B | 15.4B |
| EBITDA | 16.7B | 3.38B |
| EBIT | 12.9B | 2.65B |
| Net Income | 9.58B | 1.44B |
| EPS | 6.98 | 1.06 |
| Fiscal Year | 2024 | 2024 |
Income Statement Interpretations
PepsiCo, Inc.
PepsiCo’s revenue steadily increased from 70.4B in 2020 to 91.9B in 2024, marking a 30.5% growth over five years. Net income also rose consistently, reaching 9.6B in 2024. Margins remained stable, with a gross margin near 54.8% and a net margin improving slightly to 10.4%. The latest year saw modest revenue growth at 0.4%, but net margin and EPS improved by about 5%, indicating better profitability.
Keurig Dr Pepper Inc.
Keurig Dr Pepper experienced a revenue rise from 11.6B in 2020 to 15.4B in 2024, a 32.1% increase over five years. Net income grew more modestly to 1.44B in 2024. Margins showed mixed signals: a strong gross margin of 55.6% but a declining net margin down to 9.4%. The latest fiscal year saw revenue growth of 3.6%, but net income and EPS fell sharply by over 30%, reflecting weakening profitability.
Which one has the stronger fundamentals?
PepsiCo exhibits stronger fundamentals with more consistent revenue and net income growth, stable and improving margins, and favorable profitability trends. Keurig Dr Pepper shows decent revenue expansion but faces challenges with declining net margins and recent earnings contraction. Overall, PepsiCo’s income statement reflects more balanced and resilient financial health.
Financial Ratios Comparison
The table below presents a side-by-side comparison of key financial ratios for PepsiCo, Inc. (PEP) and Keurig Dr Pepper Inc. (KDP) based on their most recent fiscal year data ending 2024.
| Ratios | PepsiCo, Inc. (PEP) | Keurig Dr Pepper Inc. (KDP) |
|---|---|---|
| ROE | 53.1% | 5.9% |
| ROIC | 15.2% | 4.0% |
| P/E | 21.8 | 30.4 |
| P/B | 11.6 | 1.80 |
| Current Ratio | 0.82 | 0.49 |
| Quick Ratio | 0.65 | 0.33 |
| D/E | 2.49 | 0.71 |
| Debt-to-Assets | 45.2% | 32.3% |
| Interest Coverage | 15.6 | 3.79 |
| Asset Turnover | 0.92 | 0.29 |
| Fixed Asset Turnover | 2.93 | 3.99 |
| Payout Ratio | 75.5% | 82.9% |
| Dividend Yield | 3.46% | 2.73% |
Interpretation of the Ratios
PepsiCo, Inc.
PepsiCo shows predominantly strong financial ratios, including a favorable net margin of 10.43% and an impressive return on equity of 53.09%. However, some liquidity ratios like the current ratio (0.82) and quick ratio (0.65) are unfavorable, reflecting tight short-term liquidity. The company has a dividend yield of 3.46%, supported by a stable payout, but the high payout ratio and moderate free cash flow coverage suggest monitoring for sustainability.
Keurig Dr Pepper Inc.
Keurig Dr Pepper’s ratios present a mixed picture, with neutral net margin at 9.39% but unfavorable returns on equity (5.94%) and invested capital (4.04%). Liquidity ratios are weak, with a current ratio of 0.49 and quick ratio of 0.33, indicating potential short-term financial stress. The dividend yield stands at 2.73%, supported by dividends despite a comparatively lower coverage from free cash flow.
Which one has the best ratios?
PepsiCo’s ratios are overall more favorable, with strong profitability and return metrics despite some liquidity concerns. In contrast, Keurig Dr Pepper shows several unfavorable ratios, particularly in returns and liquidity, although it maintains a dividend. Therefore, PepsiCo demonstrates a stronger financial profile based on the available ratio evaluations.
Strategic Positioning
This section compares the strategic positioning of PepsiCo and Keurig Dr Pepper, focusing on market position, key segments, and exposure to technological disruption:
PepsiCo, Inc.
- Leading global beverage and snack company with diverse segments and strong competitive presence.
- Operates seven broad segments including snacks, beverages, and international markets.
- Exposure to disruption not explicitly stated in data provided.
Keurig Dr Pepper Inc.
- Mid-sized beverage company focused on coffee systems and packaged beverages with regional influence.
- Key segments include Coffee Systems, Packaged Beverages, Beverage Concentrates, and Latin America Beverages.
- Exposure to disruption not explicitly stated in data provided.
PepsiCo vs Keurig Dr Pepper Positioning
PepsiCo demonstrates a diversified approach spanning beverages and snacks across multiple global regions, while Keurig Dr Pepper concentrates on coffee systems and beverage concentrates. PepsiCo’s broad portfolio offers wide market coverage; Keurig Dr Pepper’s focus provides specialization but with narrower scale.
Which has the best competitive advantage?
PepsiCo shows a very favorable moat with growing ROIC above WACC, indicating value creation and durable competitive advantage. Keurig Dr Pepper’s moat is very unfavorable with declining ROIC below WACC, indicating value destruction and weakening profitability.
Stock Comparison
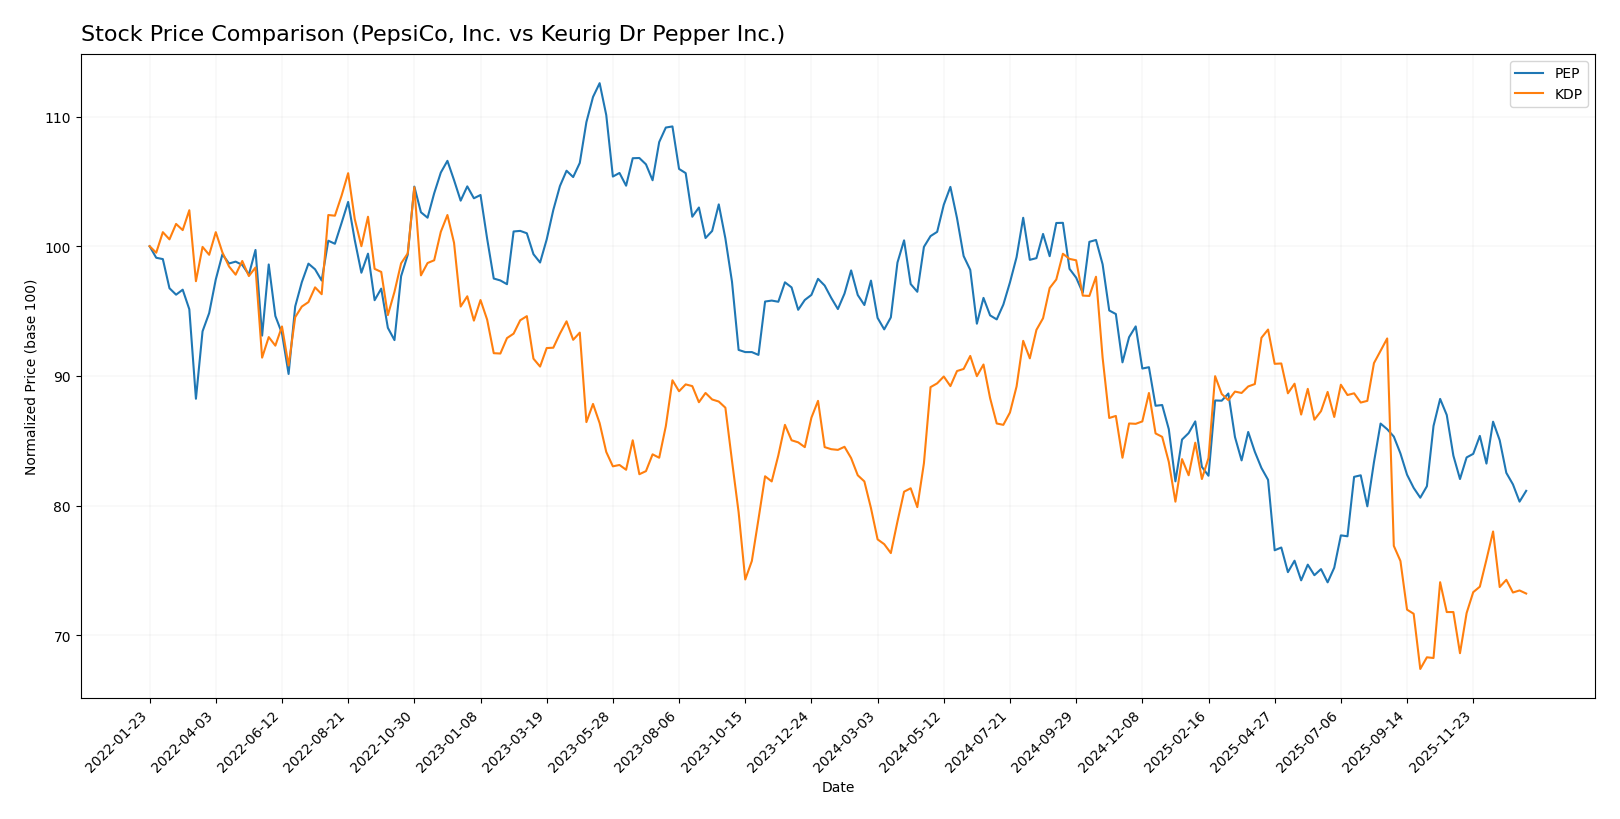
The stock prices of PepsiCo, Inc. and Keurig Dr Pepper Inc. have experienced notable bearish trends over the past 12 months, with varying degrees of price decline and recent trading dynamics indicating shifts in buyer-seller behavior.
Trend Analysis
PepsiCo, Inc. (PEP) shows a 16.65% price decline over the past year, indicating a bearish trend with accelerating downward momentum and high volatility (std deviation 14.7). The stock peaked at 182.19 and bottomed at 129.07.
Keurig Dr Pepper Inc. (KDP) experienced an 8.25% price decline over the same period, also bearish but with lower volatility (std deviation 2.98) and accelerating downward trend. The stock’s high was 37.61, and its low was 25.5.
Comparing the two, KDP has delivered a smaller price loss and a recent positive price change of 1.99%, outperforming PEP’s 3.24% recent decline, thus showing relatively better market performance.
Target Prices
The current analyst consensus for target prices indicates moderate upside potential for both PepsiCo, Inc. and Keurig Dr Pepper Inc.
| Company | Target High | Target Low | Consensus |
|---|---|---|---|
| PepsiCo, Inc. | 172 | 144 | 158.33 |
| Keurig Dr Pepper Inc. | 38 | 24 | 32 |
Analysts expect PepsiCo’s stock to trade above its current price of 141.36 USD, suggesting potential appreciation. Keurig Dr Pepper’s consensus target of 32 USD also indicates upside from its current 27.7 USD price.
Analyst Opinions Comparison
This section compares analysts’ ratings and grades for PepsiCo, Inc. and Keurig Dr Pepper Inc.:
Rating Comparison
PepsiCo, Inc. Rating
- Rating: B, assessed as Very Favorable
- Discounted Cash Flow Score: 4, indicating Favorable
- Return on Equity Score: 5, rated Very Favorable
- Return on Assets Score: 4, considered Favorable
- Debt To Equity Score: 1, marked Very Unfavorable
- Overall Score: 3, rated Moderate
Keurig Dr Pepper Inc. Rating
- Rating: B, assessed as Very Favorable
- Discounted Cash Flow Score: 4, indicating Favorable
- Return on Equity Score: 3, rated Moderate
- Return on Assets Score: 3, considered Moderate
- Debt To Equity Score: 2, marked Moderate
- Overall Score: 3, rated Moderate
Which one is the best rated?
Both companies share the same overall rating of B and an overall score of 3, indicating moderate performance. PepsiCo scores higher on return on equity and assets but has a weaker debt-to-equity score compared to Keurig Dr Pepper.
Scores Comparison
Here is a comparison of the Altman Z-Score and Piotroski Score for both companies:
PEP Scores
- Altman Z-Score: 3.46, indicating a safe zone with low bankruptcy risk.
- Piotroski Score: 6, classified as average financial strength.
KDP Scores
- Altman Z-Score: 1.33, indicating a distress zone with high bankruptcy risk.
- Piotroski Score: 6, classified as average financial strength.
Which company has the best scores?
Based on the provided data, PepsiCo has a notably higher Altman Z-Score indicating stronger financial stability, while both companies share an identical average Piotroski Score. Thus, PepsiCo shows better bankruptcy risk metrics.
Grades Comparison
The following presents the recent grades assigned to PepsiCo, Inc. and Keurig Dr Pepper Inc. by recognized financial institutions:
PepsiCo, Inc. Grades
This table summarizes recent analyst grades for PepsiCo, Inc. from established grading companies.
| Grading Company | Action | New Grade | Date |
|---|---|---|---|
| Citigroup | Maintain | Buy | 2025-12-17 |
| Barclays | Maintain | Equal Weight | 2025-12-11 |
| JP Morgan | Upgrade | Overweight | 2025-12-10 |
| Piper Sandler | Maintain | Overweight | 2025-12-09 |
| Piper Sandler | Maintain | Overweight | 2025-11-21 |
| Freedom Capital Markets | Downgrade | Hold | 2025-10-23 |
| Wells Fargo | Maintain | Equal Weight | 2025-10-10 |
| JP Morgan | Maintain | Neutral | 2025-10-06 |
| Barclays | Maintain | Equal Weight | 2025-10-03 |
| Citigroup | Maintain | Buy | 2025-09-25 |
PepsiCo’s ratings generally trend toward a Hold to Buy consensus, with multiple Overweight and Buy grades from major firms.
Keurig Dr Pepper Inc. Grades
This table summarizes recent analyst grades for Keurig Dr Pepper Inc. from established grading companies.
| Grading Company | Action | New Grade | Date |
|---|---|---|---|
| Jefferies | Downgrade | Hold | 2025-12-17 |
| Piper Sandler | Maintain | Overweight | 2025-12-15 |
| Barclays | Maintain | Equal Weight | 2025-10-28 |
| Wells Fargo | Maintain | Overweight | 2025-10-28 |
| JP Morgan | Maintain | Overweight | 2025-10-20 |
| B of A Securities | Maintain | Buy | 2025-10-08 |
| Goldman Sachs | Maintain | Neutral | 2025-10-02 |
| Wells Fargo | Maintain | Overweight | 2025-09-25 |
| Barclays | Downgrade | Equal Weight | 2025-09-24 |
| BNP Paribas | Downgrade | Underperform | 2025-09-22 |
Keurig Dr Pepper’s grades reveal a mixed picture with some downgrades but a majority maintaining Overweight or Buy ratings.
Which company has the best grades?
PepsiCo, Inc. displays a consistent Hold to Buy consensus with several upgrades, whereas Keurig Dr Pepper shows more volatility and downgrades despite some Overweight ratings. For investors, PepsiCo’s steadier grades may suggest more stable analyst confidence compared to Keurig Dr Pepper’s mixed outlook.
Strengths and Weaknesses
The table below summarizes the main strengths and weaknesses of PepsiCo, Inc. (PEP) and Keurig Dr Pepper Inc. (KDP) based on their recent financial and competitive performance indicators.
| Criterion | PepsiCo, Inc. (PEP) | Keurig Dr Pepper Inc. (KDP) |
|---|---|---|
| Diversification | Highly diversified product portfolio across beverages and snacks with strong global brands. | Moderate diversification focused on beverages with growing K-Cup pod segment but less broad range. |
| Profitability | Strong profitability: ROIC at 15.23%, net margin 10.43%, ROE 53.09%, and growing ROIC trend. | Lower profitability: ROIC at 4.04%, net margin 9.39%, ROE 5.94%, with declining ROIC trend. |
| Innovation | Consistent investment in new products and marketing, maintaining competitive edge and brand loyalty. | Innovation focused on coffee systems and pods, but financial returns indicate challenges maintaining value. |
| Global presence | Extensive global footprint with established markets worldwide. | More regional focus, especially strong in North America with growing presence in Latin America. |
| Market Share | Large market share in both beverage and snack sectors with durable competitive advantage. | Significant market share in specific beverage categories, but facing pressure from competitors and slower growth. |
Key takeaways: PepsiCo demonstrates a very favorable economic moat with strong and growing profitability supported by diversification and global reach. Keurig Dr Pepper shows signs of value erosion with weaker profitability and a declining ROIC, highlighting the need for caution despite niche strengths.
Risk Analysis
Below is a comparative risk table for PepsiCo, Inc. (PEP) and Keurig Dr Pepper Inc. (KDP) based on the most recent 2024 data:
| Metric | PepsiCo, Inc. (PEP) | Keurig Dr Pepper Inc. (KDP) |
|---|---|---|
| Market Risk | Low beta (0.42) indicates lower volatility vs. market | Low beta (0.35), also less volatile |
| Debt level | High debt-to-equity (2.49), leverage is unfavorable | Moderate debt-to-equity (0.71), neutral risk |
| Regulatory Risk | Moderate; operates globally, exposed to diverse regulations | Moderate; US-centric but with international exposure |
| Operational Risk | Large scale (319K employees), complexity may increase risk | Smaller scale (29K employees), less operational complexity |
| Environmental Risk | Moderate; consumer goods with sustainability focus | Moderate; beverage industry with environmental impact concerns |
| Geopolitical Risk | Exposure to multiple regions, including Latin America, Asia | Focus on North America and Latin America, moderate exposure |
In synthesis, PepsiCo’s most impactful risk is its high leverage, increasing financial risk despite stable operations and strong returns. Keurig Dr Pepper faces a higher bankruptcy risk (Altman Z-score in distress zone), with weaker profitability and operational efficiency, making financial risk more pronounced. Market volatility is low for both, but careful attention to debt management and operational efficiency is crucial.
Which Stock to Choose?
PepsiCo, Inc. (PEP) shows a favorable income evolution with a 30.52% revenue growth and 34.52% net income growth over 2020-2024. Its financial ratios are slightly favorable, highlighting strong profitability (ROE 53.09%) but with unfavorable liquidity and leverage ratios. The company maintains a very favorable rating and a very favorable moat status due to a growing ROIC well above WACC.
Keurig Dr Pepper Inc. (KDP) presents a favorable income statement overall, though with recent net margin and EPS declines. Its financial ratios are slightly unfavorable, marked by weak ROE (5.94%) and moderate debt levels. The company holds a very favorable rating but a very unfavorable moat status, reflecting declining ROIC below WACC and value destruction.
For investors prioritizing durable competitive advantages and profitability, PepsiCo may appear more favorable given its very favorable moat and strong income growth. Conversely, those focused on potential value plays with moderate risk tolerance might see Keurig Dr Pepper as an opportunity despite its challenges. Both stocks exhibit bearish recent price trends with differing volatility and acceleration patterns.
Disclaimer: Investment carries a risk of loss of initial capital. The past performance is not a reliable indicator of future results. Be sure to understand risks before making an investment decision.
Go Further
I encourage you to read the complete analyses of PepsiCo, Inc. and Keurig Dr Pepper Inc. to enhance your investment decisions: