Home > Comparison > Industrials > XYL vs PNR
The strategic rivalry between Xylem Inc. and Pentair plc shapes the industrial machinery sector globally. Xylem operates as a diversified water technology leader with integrated infrastructure and smart solutions. Pentair focuses on specialized consumer and industrial water treatment products, emphasizing filtration and flow technologies. This analysis pits broad-based innovation against niche specialization, aiming to identify which company offers a superior risk-adjusted return for a diversified industrial portfolio in 2026.
Table of contents
Companies Overview
Xylem Inc. and Pentair plc stand as pivotal leaders in the global water solutions market, shaping infrastructure and consumer applications.
Xylem Inc.: Water Technology Innovator
Xylem Inc. dominates the industrial water sector with a diversified portfolio spanning water infrastructure, applied water, and measurement solutions. It generates revenue by designing and servicing pumps, filtration systems, and smart water technologies worldwide. In 2026, Xylem focuses strategically on integrating advanced analytics and remote monitoring to enhance water management efficiency.
Pentair plc: Comprehensive Water Solutions Provider
Pentair plc commands a strong presence in both consumer and industrial water markets. Its revenue engine revolves around manufacturing residential pool equipment and sophisticated fluid treatment systems. In 2026, Pentair prioritizes expanding membrane filtration and water softening technologies to meet growing demand for sustainable water solutions globally.
Strategic Collision: Similarities & Divergences
Both companies emphasize innovative water technologies but diverge in market approach—Xylem invests heavily in smart infrastructure, while Pentair leans on broad product diversity across consumer and industrial segments. Their primary battleground lies in water treatment and management solutions. Investors face distinct profiles: Xylem’s tech-driven growth contrasts with Pentair’s stable, product-focused footprint.
Income Statement Comparison
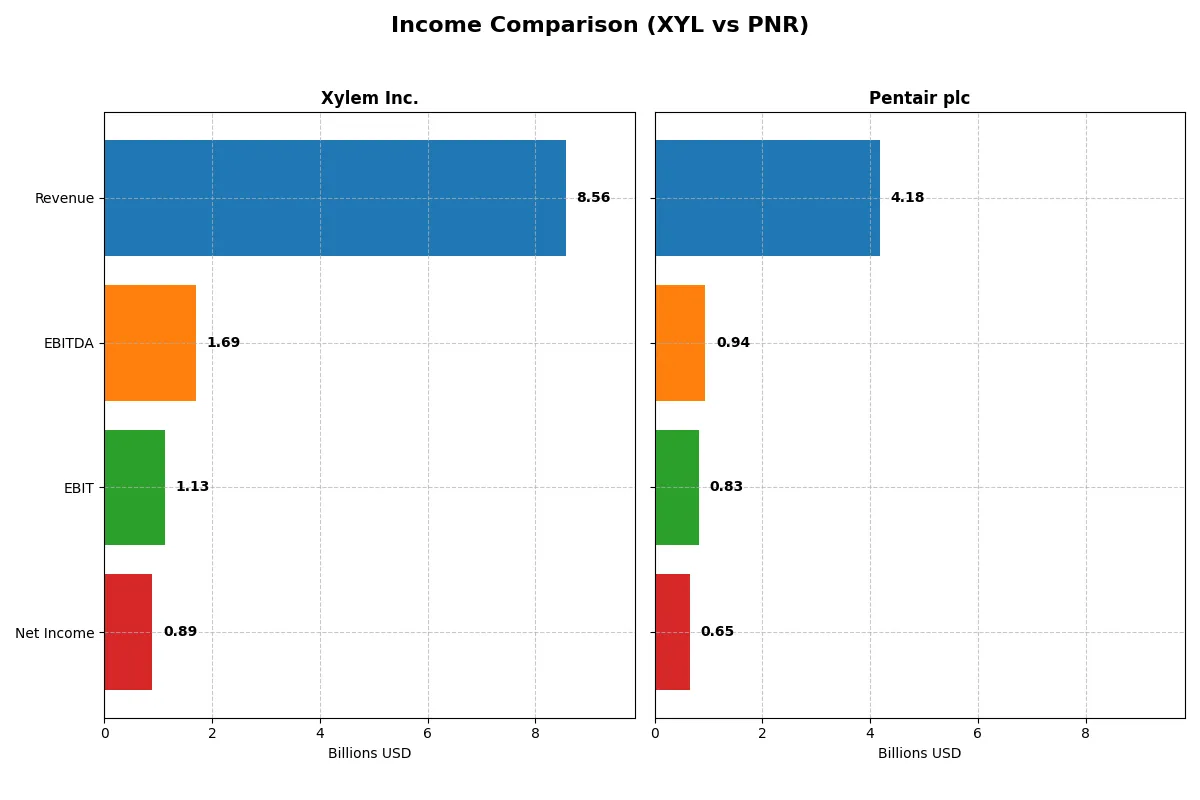
This data dissects the core profitability and scalability of both corporate engines to reveal who dominates the bottom line:
| Metric | Xylem Inc. (XYL) | Pentair plc (PNR) |
|---|---|---|
| Revenue | 8.56B | 4.18B |
| Cost of Revenue | 5.35B | 2.49B |
| Operating Expenses | 2.20B | 833M |
| Gross Profit | 3.21B | 1.69B |
| EBITDA | 1.69B | 944M |
| EBIT | 1.13B | 826M |
| Interest Expense | 44M | 69M |
| Net Income | 890M | 654M |
| EPS | 3.67 | 3.99 |
| Fiscal Year | 2024 | 2025 |
Income Statement Analysis: The Bottom-Line Duel
This income statement comparison reveals which company manages its revenues and expenses more efficiently to drive sustainable profits.
Xylem Inc. Analysis
Xylem’s revenue surged from 5.2B in 2021 to 8.6B in 2024, with net income tripling to 890M. Gross margin improved to 37.5%, and net margin reached a solid 10.4% in 2024. The company accelerated EBIT growth by 65% last year, showing strong momentum and operational leverage.
Pentair plc Analysis
Pentair’s revenue grew modestly from 3.8B in 2021 to 4.2B in 2025, with net income rising 18% to 654M. Gross margin stands higher at 40.5%, and net margin improved to 15.7%. Despite slower revenue growth, Pentair maintains robust profitability and consistent EPS gains, reflecting steady operational discipline.
Verdict: Growth Velocity vs. Margin Strength
Xylem excels in rapid revenue and profit expansion, reflecting dynamic operational execution. Pentair delivers superior margins and stable earnings growth, emphasizing profitability. For investors, Xylem offers high growth potential, while Pentair appeals as a reliable income generator with strong margin resilience.
Financial Ratios Comparison
These vital ratios act as a diagnostic tool to expose the underlying fiscal health, valuation premiums, and capital efficiency of the companies compared below:
| Ratios | Xylem Inc. (XYL) | Pentair plc (PNR) |
|---|---|---|
| ROE | 8.36% | 17.60% |
| ROIC | 5.78% | 12.52% |
| P/E | 31.63 | 26.89 |
| P/B | 2.64 | 4.72 |
| Current Ratio | 1.75 | 1.60 |
| Quick Ratio | 1.33 | 0.92 |
| D/E | 0.20 | 0.50 |
| Debt-to-Assets | 12.88% | 27.41% |
| Interest Coverage | 22.93 | 9.07 |
| Asset Turnover | 0.52 | 0.63 |
| Fixed Asset Turnover | 7.43 | 8.60 |
| Payout Ratio | 39.33% | 24.35% |
| Dividend Yield | 1.24% | 0.91% |
| Fiscal Year | 2024 | 2024 |
Efficiency & Valuation Duel: The Vital Signs
Ratios act as a company’s DNA, exposing hidden risks and operational strengths beyond surface-level financials.
Xylem Inc.
Xylem shows moderate profitability with an 8.36% ROE and a 10.39% net margin, signaling decent operational efficiency. However, its P/E of 31.63 suggests the stock trades at a premium, possibly stretched. The company returns value through a 1.24% dividend, balancing modest payouts with reinvestment in R&D for growth.
Pentair plc
Pentair delivers stronger profitability, boasting a 16.9% ROE and 15.66% net margin, indicating efficient capital use. Its P/E of 26.14 is lower than Xylem’s but the elevated P/B of 4.42 flags valuation concerns. Pentair’s sub-1% dividend yield hints at a focus on growth investments rather than shareholder payout.
Premium Valuation vs. Operational Safety
Pentair offers superior profitability and a favorable ratio profile but trades at a relatively stretched valuation. Xylem’s premium P/E contrasts with weaker ROE but a steadier dividend yield. Investors prioritizing operational efficiency may lean toward Pentair; those valuing income stability might prefer Xylem.
Which one offers the Superior Shareholder Reward?
I contrast Xylem Inc. (XYL) and Pentair plc (PNR) on shareholder reward. Xylem offers a 1.24% dividend yield with a 39.3% payout ratio, supported by solid free cash flow coverage (75%). Its buyback program is moderate, supporting sustainable capital returns. Pentair yields slightly less at 0.91%–1.21%, with a lower payout ratio near 25%, but it boasts a stronger buyback intensity, enhancing total returns. Pentair’s superior operating margins (19.7% vs. 13.2%) and higher free cash flow conversion (over 90%) underpin its aggressive buybacks. I see Pentair’s distribution model as more sustainable due to balanced dividends and buybacks funded by robust cash flow. For 2026 investors seeking total shareholder return, Pentair offers a superior reward through a stronger buyback emphasis combined with a prudent dividend policy.
Comparative Score Analysis: The Strategic Profile
The radar chart reveals the fundamental DNA and trade-offs of Xylem Inc. and Pentair plc, highlighting their operational strengths and valuation positioning:
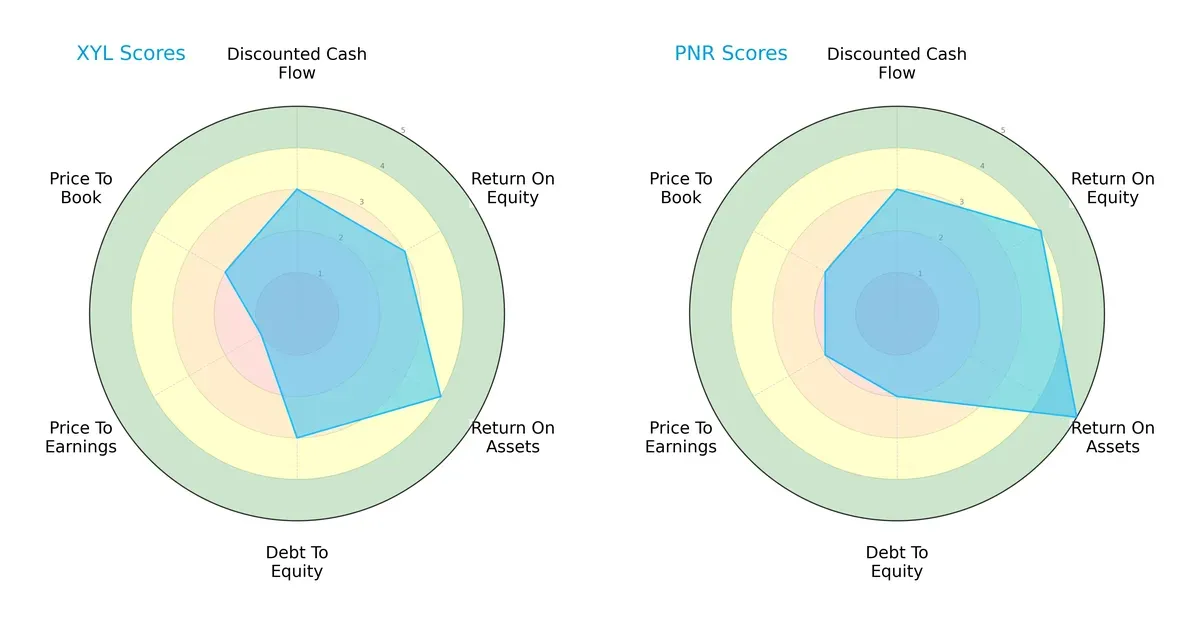
Pentair outperforms Xylem in profitability, showing stronger ROE (4 vs. 3) and ROA (5 vs. 4). Both have moderate DCF scores (3), but Pentair carries a slightly higher debt risk (Debt/Equity 2 vs. 3 for Xylem). Xylem’s valuation metrics lag, with a very unfavorable P/E score (1) compared to Pentair’s moderate (2). Overall, Pentair presents a more balanced profile, while Xylem relies heavily on asset efficiency to compensate for valuation weaknesses.
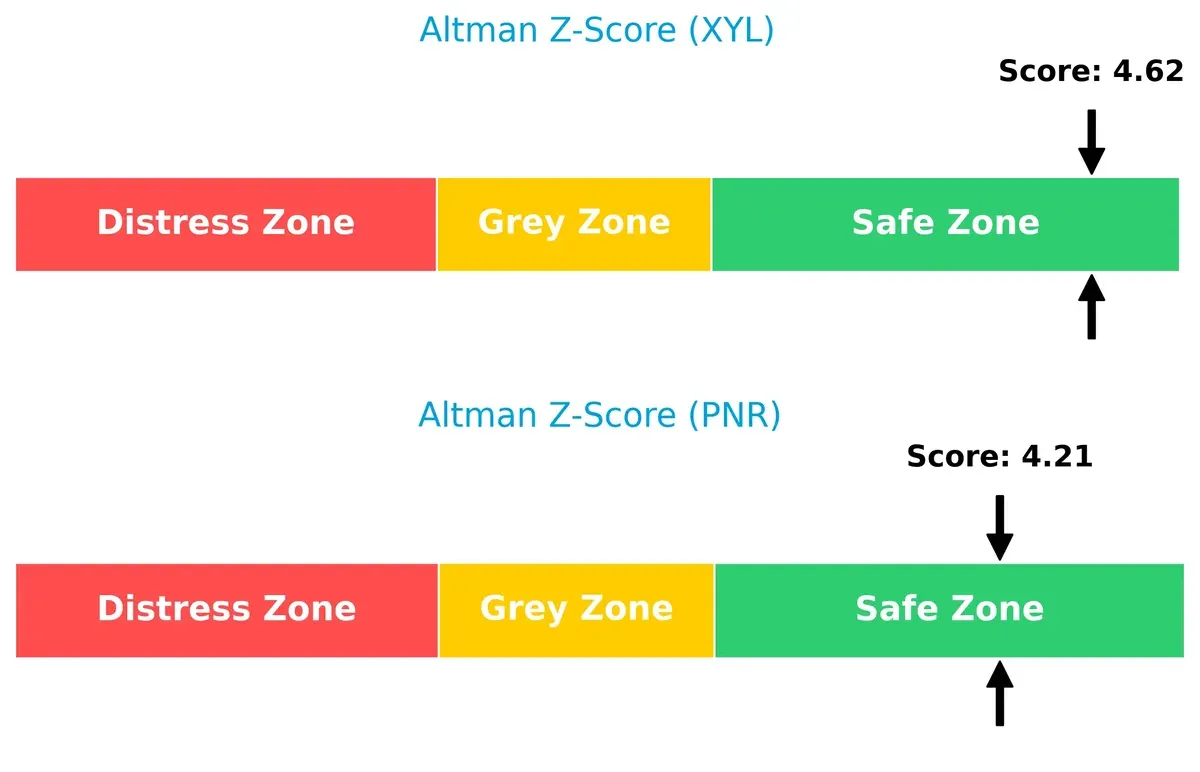
Bankruptcy Risk: Solvency Showdown
The Altman Z-Scores place both firms comfortably in the safe zone, with Xylem at 4.62 and Pentair at 4.21, indicating solid long-term solvency in today’s economic cycle:
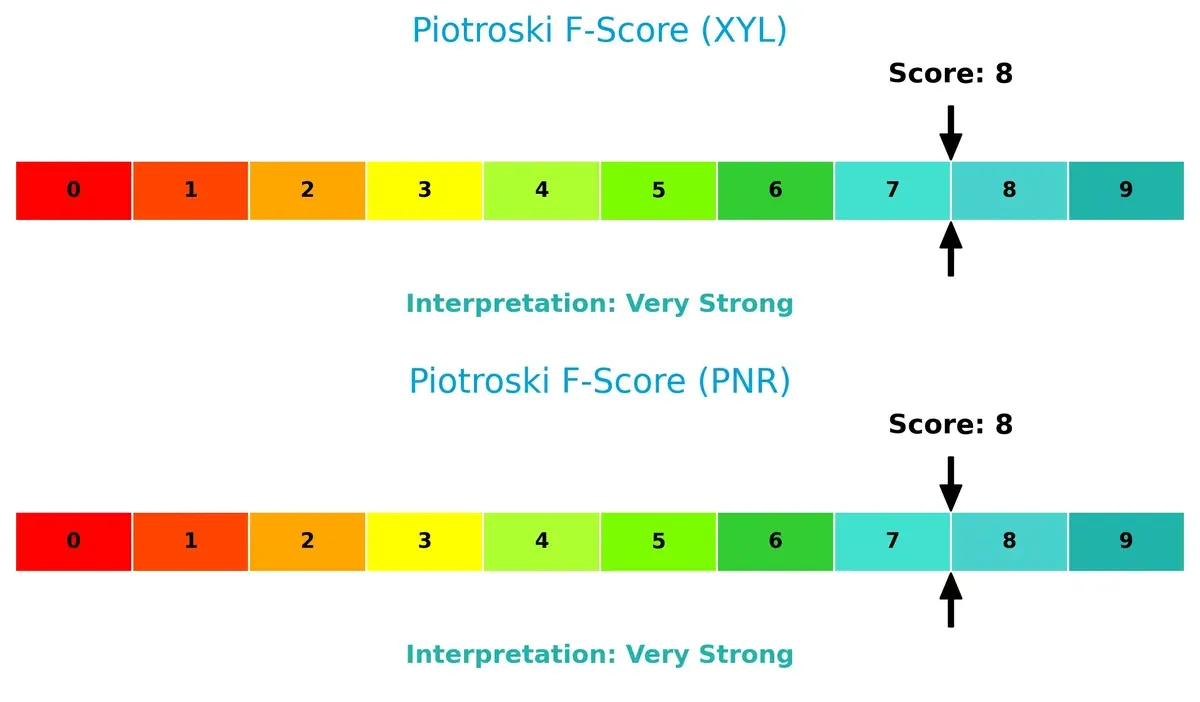
Financial Health: Quality of Operations
Both Xylem and Pentair score an impressive 8 on the Piotroski F-Score, signaling very strong financial health with no immediate red flags in operational quality or balance sheet strength:
How are the two companies positioned?
This section dissects the operational DNA of Xylem and Pentair by comparing their revenue segmentation alongside internal strengths and weaknesses. The final goal is to confront their economic moats to identify which model offers the most durable competitive advantage today.
Revenue Segmentation: The Strategic Mix
This visual comparison dissects how Xylem Inc. and Pentair plc diversify their income streams and where their primary sector bets lie:
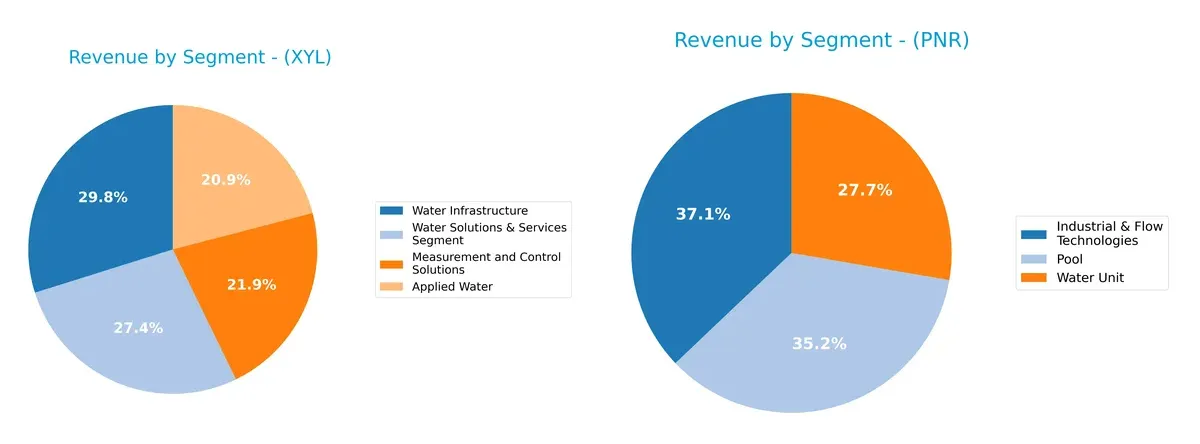
Xylem Inc. spreads revenue across four key segments, with Water Infrastructure anchoring at $2.56B in 2024, complemented closely by Water Solutions & Services at $2.34B. This balance signals a strong ecosystem lock-in. Pentair leans on Industrial & Flow Technologies ($1.51B) and Pool ($1.44B) segments but shows less diversification. Pentair’s reliance on fewer pillars suggests higher concentration risk compared to Xylem’s multi-segment approach.
Strengths and Weaknesses Comparison
This table compares the Strengths and Weaknesses of Xylem Inc. and Pentair plc:
Xylem Inc. Strengths
- Diverse water-related segments including Applied Water and Measurement & Control
- Strong US presence with 4.9B revenue
- Favorable net margin at 10.4%
- Low debt to assets at 12.9%
- High interest coverage at 25.7
Pentair plc Strengths
- Higher net margin at 15.7% and ROE at 16.9%
- Favorable ROIC at 12.5% above WACC
- Diversified product lines like Industrial & Flow and Pool
- Strong US revenue of 2.8B
- Favorable debt metrics and interest coverage
Xylem Inc. Weaknesses
- ROE below cost of capital at 8.4%
- Elevated PE ratio at 31.6
- Neutral asset turnover at 0.52
- Limited global revenue outside US and Europe
- PB ratio neutral at 2.64
Pentair plc Weaknesses
- Higher PB ratio at 4.42
- Quick ratio below 1.0 at 0.95
- Dividend yield unfavorable at 0.96%
- PE ratio still high at 26.1
- Slightly higher debt to assets at 23.9%
Xylem shows solid leverage and liquidity with broad water-sector diversification but struggles with capital efficiency. Pentair excels in profitability and capital returns yet faces valuation and liquidity caution. Both companies leverage strong US markets but differ in financial structure and market valuation.
The Moat Duel: Analyzing Competitive Defensibility
A structural moat is the only true shield preserving long-term profits from relentless competitive erosion. Let’s dissect the core moats of Xylem and Pentair:
Xylem Inc.: Innovation-Driven Intangible Assets
Xylem’s moat stems from its proprietary engineered water solutions and strong brand portfolio. Despite a slightly unfavorable ROIC vs. WACC, its growing profitability signals improving capital efficiency. Expansion in smart metering and digital water technologies may deepen its moat in 2026.
Pentair plc: Cost Advantage and Scale Efficiency
Pentair leverages scale and cost control to maintain above-WACC returns, unlike Xylem. Its higher margins reflect operational leverage. However, a declining ROIC trend warns of pressure on future profitability. Growth in advanced filtration and industrial water tech offers upside for market disruption.
Innovation Intangibles vs. Scale Cost Leadership
Xylem’s innovation moat is strengthening but lacks current value creation, while Pentair’s cost advantage delivers positive economic returns despite margin pressures. Pentair holds the deeper moat today, better equipped to defend market share amid intensifying competition.
Which stock offers better returns?
The past year shows distinct price dynamics: Xylem Inc. gains steadily with accelerating momentum, while Pentair plc posts stronger overall returns but slows recently with sharper declines.
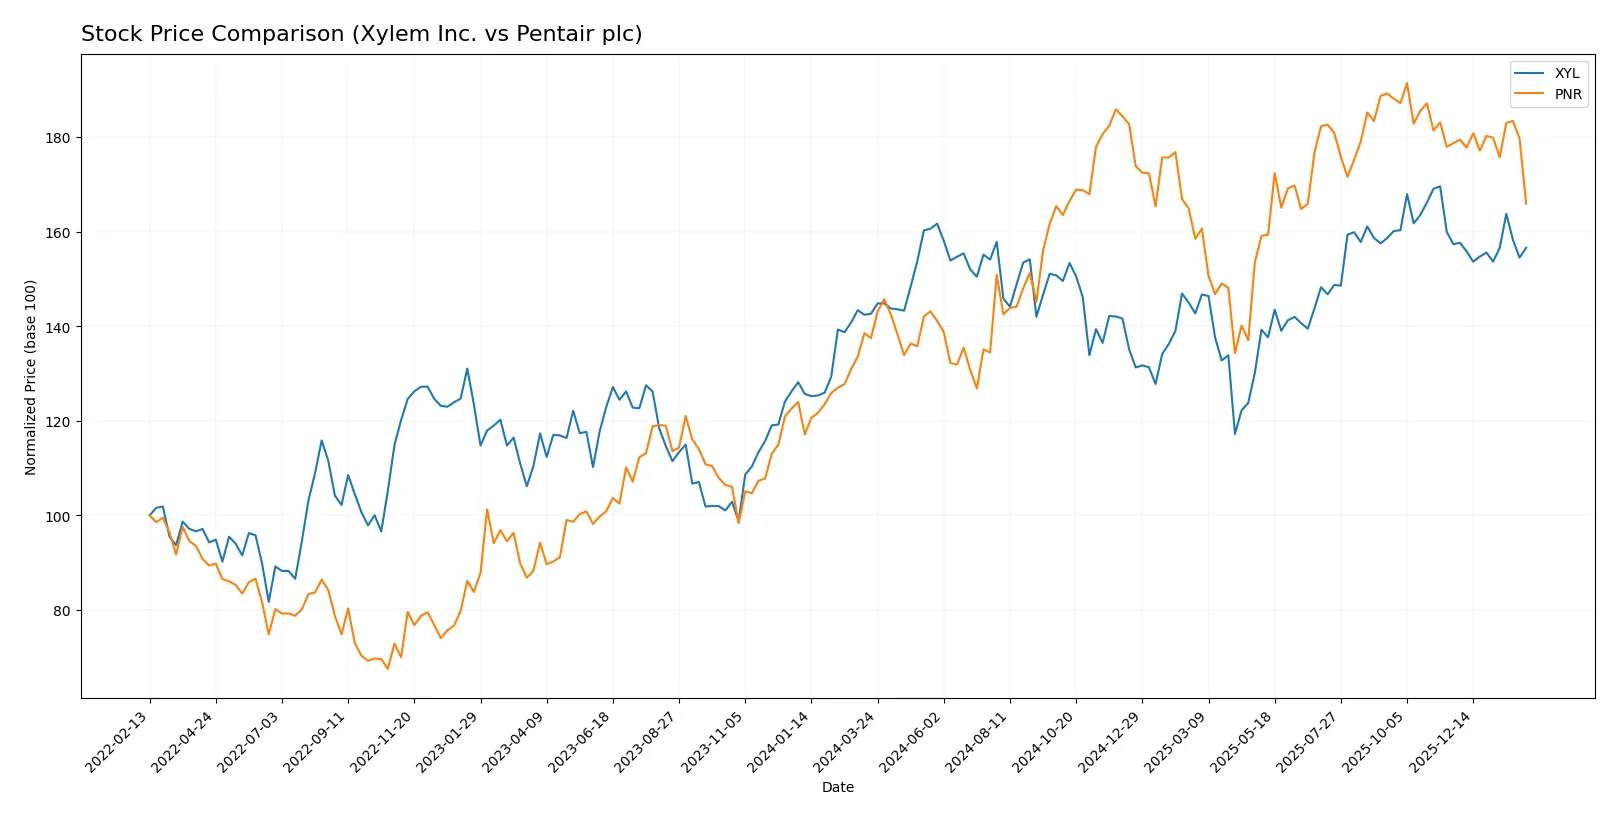
Trend Comparison
Xylem Inc. rose 9.78% over 12 months, marking a bullish trend with accelerating gains. It fluctuated between $104.6 and $151.31, showing moderate volatility at a 9.57% standard deviation.
Pentair plc gained 20.67% in the same period, also bullish but with decelerating momentum. Prices ranged from $74.39 to $112.23, paired with a higher volatility at a 10.7% standard deviation.
Pentair outperformed Xylem overall, despite recent weakness. Xylem’s trend accelerated, while Pentair’s slowed with a sharper recent decline.
Target Prices
Analysts present a bullish consensus for both Xylem Inc. and Pentair plc, signaling upside potential from current levels.
| Company | Target Low | Target High | Consensus |
|---|---|---|---|
| Xylem Inc. | 150 | 178 | 169.43 |
| Pentair plc | 90 | 135 | 120 |
Xylem’s consensus target at 169.43 exceeds its current 139.72 price by a solid margin, indicating confidence in growth. Pentair’s 120 target also outpaces the 97.3 current price, reflecting expected operational strength ahead.

Don’t Let Luck Decide Your Entry Point
Optimize your entry points with our advanced ProRealTime indicators. You’ll get efficient buy signals with precise price targets for maximum performance. Start outperforming now!
How do institutions grade them?
Xylem Inc. Grades
The following table lists recent grades from reputable institutions for Xylem Inc.:
| Grading Company | Action | New Grade | Date |
|---|---|---|---|
| Barclays | Maintain | Overweight | 2026-01-07 |
| Mizuho | Maintain | Neutral | 2026-01-05 |
| TD Cowen | Maintain | Hold | 2025-12-05 |
| UBS | Maintain | Buy | 2025-11-06 |
| Stifel | Maintain | Buy | 2025-10-29 |
| Citigroup | Maintain | Buy | 2025-10-29 |
| Barclays | Maintain | Overweight | 2025-10-29 |
| RBC Capital | Maintain | Outperform | 2025-10-29 |
| Citigroup | Maintain | Buy | 2025-10-09 |
| Mizuho | Maintain | Neutral | 2025-09-12 |
Pentair plc Grades
The following table lists recent grades from reputable institutions for Pentair plc:
| Grading Company | Action | New Grade | Date |
|---|---|---|---|
| Oppenheimer | Maintain | Outperform | 2026-02-04 |
| Citigroup | Maintain | Buy | 2026-02-04 |
| JP Morgan | Maintain | Overweight | 2026-01-16 |
| Citigroup | Maintain | Buy | 2026-01-12 |
| BNP Paribas Exane | Downgrade | Underperform | 2026-01-07 |
| TD Cowen | Downgrade | Sell | 2026-01-05 |
| Jefferies | Upgrade | Buy | 2025-12-10 |
| Barclays | Downgrade | Equal Weight | 2025-12-04 |
| Oppenheimer | Maintain | Outperform | 2025-11-20 |
| RBC Capital | Maintain | Outperform | 2025-10-22 |
Which company has the best grades?
Xylem Inc. consistently receives positive grades, mostly Buy or better, with no recent downgrades. Pentair plc’s grades show more variability, including several downgrades to Underperform and Sell. This contrast could influence investors prioritizing stability and positive analyst sentiment.
Risks specific to each company
The following categories identify the critical pressure points and systemic threats facing both firms in the 2026 market environment:
1. Market & Competition
Xylem Inc. (XYL)
- Faces pressure from global water infrastructure competitors amid increasing demand for smart water solutions.
Pentair plc (PNR)
- Operates in diverse water solutions markets with strong competition in residential and industrial segments.
2. Capital Structure & Debt
Xylem Inc. (XYL)
- Maintains low debt-to-equity at 0.2, indicating a conservative capital structure and strong interest coverage of 25.7x.
Pentair plc (PNR)
- Higher leverage with debt-to-equity of 0.42 and interest coverage of 11.9x, which may increase financial risk in downturns.
3. Stock Volatility
Xylem Inc. (XYL)
- Beta at 1.16 suggests moderate sensitivity to market swings consistent with industrial machinery sector.
Pentair plc (PNR)
- Slightly higher beta of 1.22 implies increased stock price volatility relative to the market.
4. Regulatory & Legal
Xylem Inc. (XYL)
- Subject to stringent US and international water quality and environmental regulations, with potential compliance cost risks.
Pentair plc (PNR)
- Faces complex regulations across multiple jurisdictions, including EU and UK, increasing exposure to legal and compliance challenges.
5. Supply Chain & Operations
Xylem Inc. (XYL)
- Global manufacturing footprint supports resilience but remains vulnerable to raw material price fluctuations.
Pentair plc (PNR)
- Smaller workforce and diversified product lines may limit operational flexibility during supply disruptions.
6. ESG & Climate Transition
Xylem Inc. (XYL)
- Strong focus on sustainable water technologies positions it well in the climate transition but requires ongoing innovation.
Pentair plc (PNR)
- ESG integration is advancing but less visible than XYL, which could affect investor appeal amid rising ESG scrutiny.
7. Geopolitical Exposure
Xylem Inc. (XYL)
- US-based but with significant international sales, exposing it to trade tensions and currency risks.
Pentair plc (PNR)
- UK-based with global operations, facing Brexit-related uncertainties and broader geopolitical volatility.
Which company shows a better risk-adjusted profile?
Pentair’s higher profitability and stronger returns on equity and assets reflect operational efficiency but come with elevated leverage and stock volatility risks. Xylem’s conservative debt and strong liquidity offer stability but face margin pressures and a higher P/E ratio. The most impactful risk for Xylem is its valuation premium amid moderate ROIC below WACC, raising concerns about growth sustainability. For Pentair, leverage and geopolitical exposure are key risks given its higher debt and complex international footprint. Overall, Xylem shows a slightly better risk-adjusted profile due to its balance sheet strength and lower financial risk despite moderate growth metrics.
Final Verdict: Which stock to choose?
Xylem Inc. (XYL) excels as a cash-generating powerhouse with accelerating profitability and strong operational efficiency. Its rising ROIC trend signals improving value creation despite current challenges. The main point of vigilance is its slightly unfavorable moat status, suggesting cautious monitoring. XYL suits aggressive growth portfolios seeking momentum with some risk tolerance.
Pentair plc (PNR) boasts a robust strategic moat backed by superior returns on capital and well-maintained financial stability. Its recurring revenue and conservative leverage provide a safety cushion compared to XYL. Despite a slowing price momentum, PNR fits well in GARP portfolios targeting steady growth and value preservation.
If you prioritize dynamic growth supported by improving profitability and cash flow, Xylem appears the compelling choice due to its accelerating operational metrics. However, if you seek better stability with a proven economic moat and solid returns, Pentair offers superior financial resilience and risk management. Both present distinct scenarios aligned with different investor risk appetites and time horizons.
Disclaimer: Investment carries a risk of loss of initial capital. The past performance is not a reliable indicator of future results. Be sure to understand risks before making an investment decision.
Go Further
I encourage you to read the complete analyses of Xylem Inc. and Pentair plc to enhance your investment decisions: