Home > Comparison > Industrials > SYM vs PNR
The strategic rivalry between Symbotic Inc. and Pentair plc shapes the industrial machinery sector’s evolution. Symbotic operates as a cutting-edge automation technology provider, revolutionizing warehouse efficiency. In contrast, Pentair delivers diversified water solutions with a broad product portfolio spanning consumer and industrial applications. This analysis will dissect their competitive dynamics to identify which corporate path offers superior risk-adjusted returns for a diversified portfolio in today’s complex industrial landscape.
Table of contents
Companies Overview
Symbotic Inc. and Pentair plc stand as key players in the industrial machinery sector, shaping automation and water solutions markets respectively.
Symbotic Inc.: Cutting-Edge Warehouse Automation
Symbotic Inc. leads in warehouse automation technology, providing robotics solutions that boost efficiency for retailers and wholesalers. Its flagship Symbotic System integrates hardware and software to reduce costs and optimize inventory management. In 2026, the company strategically focused on expanding its automation footprint across U.S. supply chains, leveraging its innovation to scale operations.
Pentair plc: Global Water Solutions Provider
Pentair plc dominates with comprehensive water treatment and fluid management products worldwide. It generates revenue through residential pool equipment and industrial water filtration systems. In 2026, Pentair prioritized enhancing its product portfolio and expanding in commercial water management, maintaining a broad brand presence including Everpure and Sta-Rite.
Strategic Collision: Similarities & Divergences
Both companies emphasize industrial efficiency but differ in approach: Symbotic pursues automation-driven cost reduction, while Pentair focuses on diverse water solutions. Their competition centers on industrial infrastructure upgrades, targeting operational optimization. Symbotic offers a tech-heavy, high-growth profile, whereas Pentair provides steady, diversified exposure to global water markets.
Income Statement Comparison
This data dissects the core profitability and scalability of both corporate engines to reveal who dominates the bottom line:
| Metric | Symbotic Inc. (SYM) | Pentair plc (PNR) |
|---|---|---|
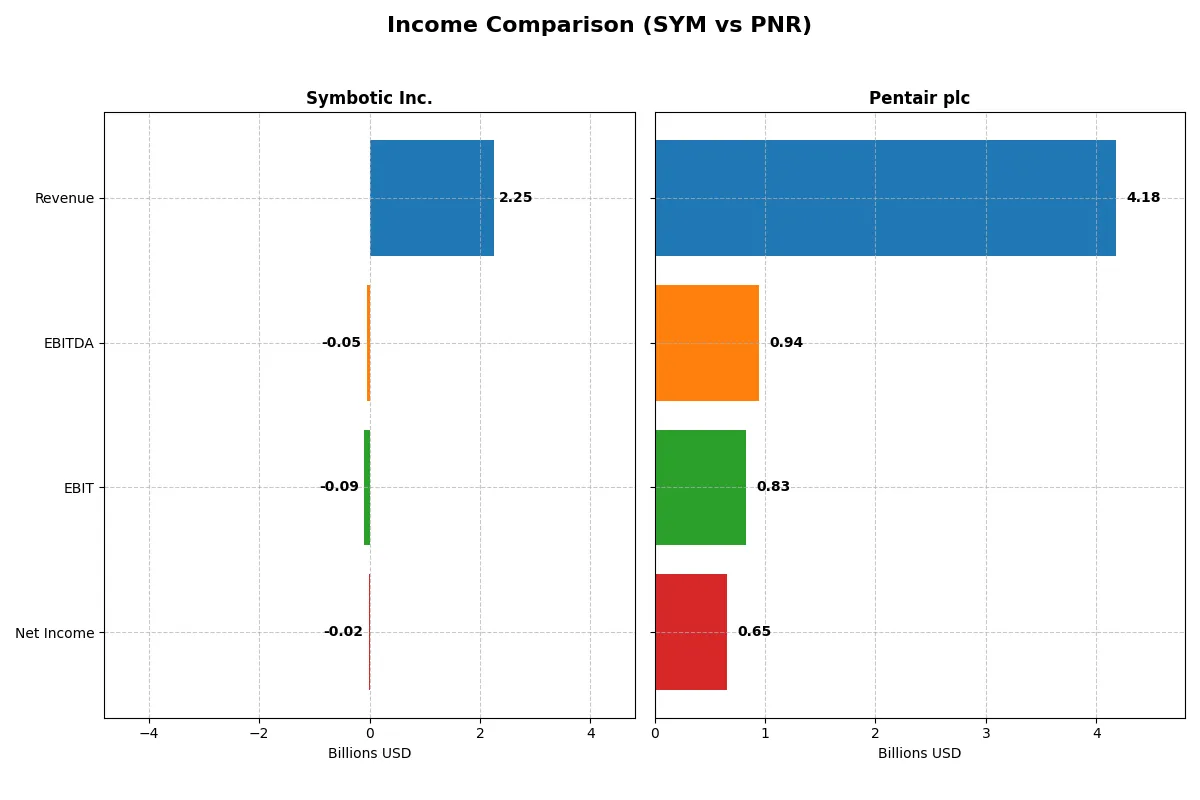
| Revenue | 2.25B | 4.18B |
| Cost of Revenue | 1.82B | 2.49B |
| Operating Expenses | 538M | 833M |
| Gross Profit | 423M | 1.69B |
| EBITDA | -48M | 944M |
| EBIT | -92M | 826M |
| Interest Expense | 0 | 69M |
| Net Income | -17M | 654M |
| EPS | -0.16 | 3.99 |
| Fiscal Year | 2025 | 2025 |
Income Statement Analysis: The Bottom-Line Duel
This income statement comparison exposes how efficiently each company converts revenue into profit, revealing the true strength of their business models.
Symbotic Inc. Analysis
Symbotic Inc. grew revenue sharply from $252M in 2021 to $2.25B in 2025, reflecting rapid top-line expansion. Despite gross margin holding steady near 19%, net income remained negative, with a slight bottom-line loss of $17M in 2025. Operating losses persist, signaling ongoing challenges in controlling costs amid growth momentum.
Pentair plc Analysis
Pentair plc sustains robust revenue around $4.18B in 2025, with a solid gross margin of 40.5%. EBIT margin at nearly 20% and a healthy net margin above 15% underline strong profitability. Net income rose to $654M in 2025, showing consistent earnings power and disciplined expense management over several years.
Margin Power vs. Revenue Scale
Pentair clearly outperforms Symbotic in profitability and margin quality, converting scale into substantial net income. Symbotic’s rapid revenue growth contrasts with continuing losses, suggesting a higher-risk growth profile. Investors seeking stable earnings and margin strength will find Pentair’s profile more attractive.
Financial Ratios Comparison
These vital ratios act as a diagnostic tool to expose the underlying fiscal health, valuation premiums, and capital efficiency of the companies compared below:
| Ratios | Symbotic Inc. (SYM) | Pentair plc (PNR) |
|---|---|---|
| ROE | -7.65% | 16.90% |
| ROIC | -16.63% | 12.46% |
| P/E | -335 | 26.14 |
| P/B | 25.60 | 4.42 |
| Current Ratio | 1.08 | 1.61 |
| Quick Ratio | 0.99 | 0.95 |
| D/E (Debt-to-Equity) | 0.14 | 0.42 |
| Debt-to-Assets | 1.32% | 23.86% |
| Interest Coverage | 0 | 12.36 |
| Asset Turnover | 0.94 | 0.61 |
| Fixed Asset Turnover | 15.92 | 11.08 |
| Payout ratio | 0 | 25.13% |
| Dividend yield | 0% | 0.96% |
| Fiscal Year | 2025 | 2025 |
Efficiency & Valuation Duel: The Vital Signs
Financial ratios serve as a company’s DNA, exposing hidden risks and revealing operational strength.
Symbotic Inc.
Symbotic shows negative profitability, with ROE at -7.65% and ROIC at -16.63%, signaling operational struggles. Its valuation appears stretched, with a negative P/E and a high PB ratio of 25.6. The company pays no dividends, instead reinvesting heavily in R&D (9.6% of revenue), aiming for future growth despite current losses.
Pentair plc
Pentair delivers solid profitability: ROE stands at 16.9%, ROIC at 12.46%, and a net margin of 15.66%. The stock trades at a premium with a P/E of 26.14 and PB of 4.42. It maintains a modest dividend yield near 1%, balancing shareholder returns with stable operational efficiency and manageable debt levels.
Premium Valuation vs. Operational Safety
Pentair offers a more balanced risk-reward profile, combining profitability with reasonable leverage and shareholder returns. Symbotic’s negative returns and stretched valuation signal higher risk, fitting investors focused on aggressive growth tolerance rather than capital preservation.
Which one offers the Superior Shareholder Reward?
Symbotic Inc. (SYM) pays no dividends and runs no buybacks, focusing cash flow on reinvestment amid ongoing losses. Pentair plc (PNR) yields ~0.96%, with a steady 24–25% payout ratio and consistent buybacks fueling 4.5 free cash flow per share. I see PNR’s balanced dividend and buyback approach as a more sustainable, shareholder-friendly model in 2026, offering a clearer path to total return than SYM’s growth gamble.
Comparative Score Analysis: The Strategic Profile
The radar chart reveals the fundamental DNA and trade-offs of Symbotic Inc. and Pentair plc, highlighting their financial strengths and vulnerabilities:
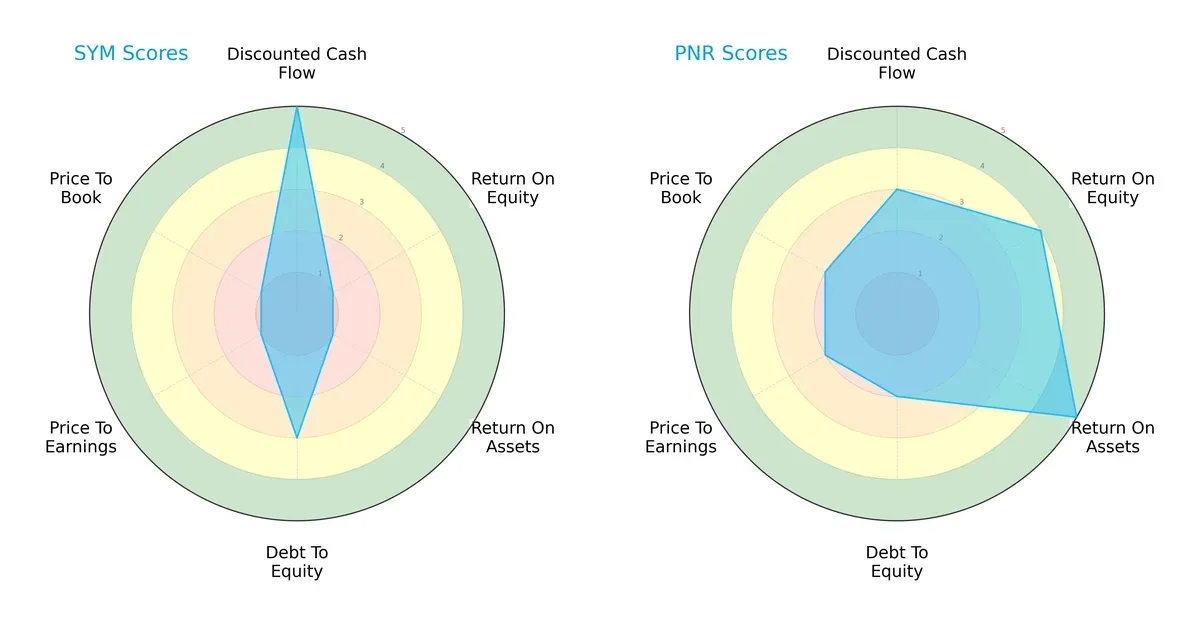
Symbotic excels in discounted cash flow with a top score of 5 but scores very low on profitability metrics like ROE and ROA (both 1). Pentair offers a more balanced profile, showing strong asset efficiency (ROA 5) and solid equity returns (ROE 4). Pentair also maintains moderate leverage and valuation scores, while Symbotic’s valuation metrics signal potential overpricing. Overall, Pentair relies on operational efficiency and financial stability, whereas Symbotic depends heavily on cash flow projections.
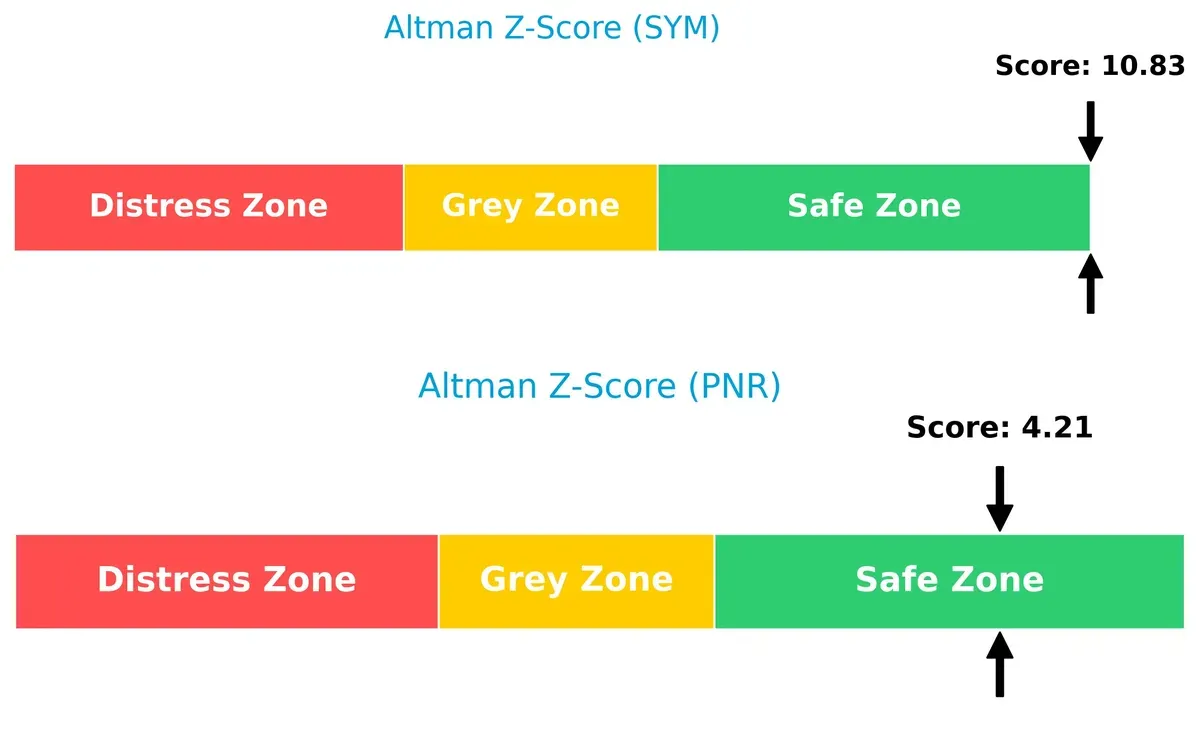
Bankruptcy Risk: Solvency Showdown
Symbotic’s Altman Z-Score of 10.8 far exceeds Pentair’s 4.2, placing both comfortably in the safe zone but indicating Symbotic’s exceptional solvency and lower bankruptcy risk in this cycle:
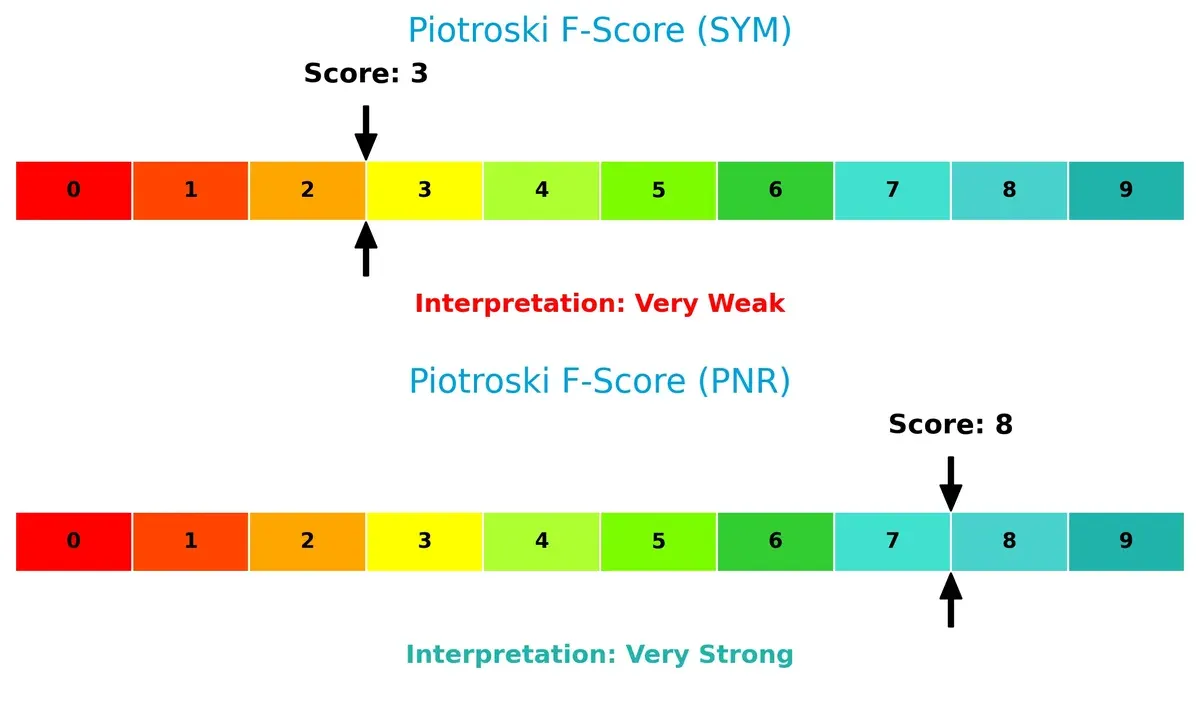
Financial Health: Quality of Operations
Pentair’s Piotroski F-Score of 8 signals robust financial health and operational strength, while Symbotic’s score of 3 raises red flags about internal financial quality and potential weaknesses:
How are the two companies positioned?
This section dissects the operational DNA of Symbotic and Pentair by comparing their revenue distribution by segment and internal dynamics. The goal is to confront their economic moats to reveal which business model delivers the most resilient and sustainable competitive advantage today.
Revenue Segmentation: The Strategic Mix
This visual comparison dissects how Symbotic Inc. and Pentair plc diversify their income streams and where their primary sector bets currently lie:
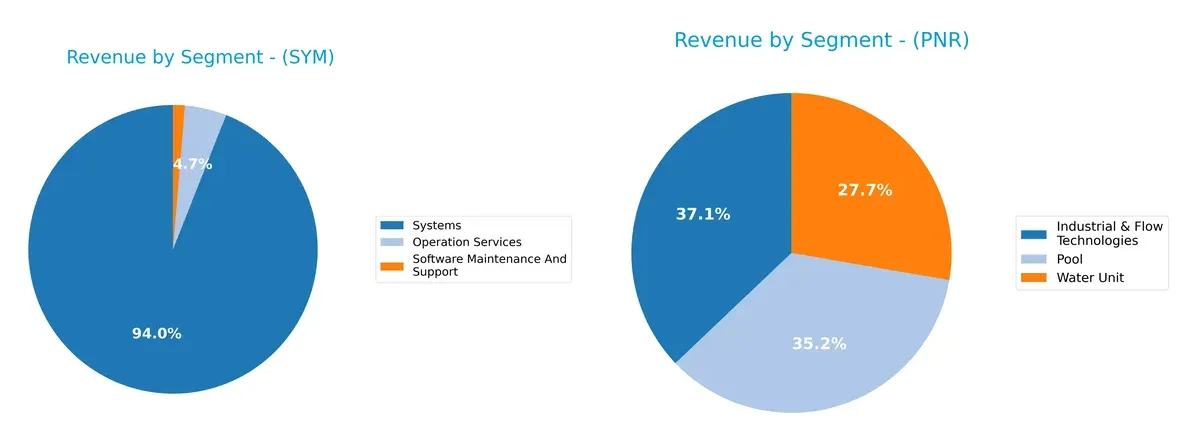
Symbotic Inc. anchors 2.12B of its 2.19B total revenue in Systems, showing a heavy concentration in one core segment. Operation Services and Software Maintenance add moderate diversification with 105M and 30M respectively. In contrast, Pentair splits roughly evenly across Industrial & Flow Technologies (1.51B), Pool (1.44B), and Water Unit (1.13B), demonstrating a balanced revenue mix. Symbotic’s focus reflects infrastructure dominance but poses concentration risk. Pentair’s diversified base supports resilience amid market shifts.
Strengths and Weaknesses Comparison
This table compares the strengths and weaknesses of Symbotic Inc. (SYM) and Pentair plc (PNR):
SYM Strengths
- Low debt-to-assets at 1.32%
- Favorable debt-to-equity at 0.14
- High fixed asset turnover at 15.92
- Large US revenue base of 2.2B
- Systems segment dominates revenue at 2.1B
PNR Strengths
- Strong profitability with net margin 15.66%
- Robust ROE at 16.9% and ROIC 12.46%
- Favorable interest coverage at 11.9
- Diversified global presence including US, Europe, developing countries
- Balanced revenue streams across Industrial, Pool, Water units
SYM Weaknesses
- Negative net margin (-0.75%) and negative ROE (-7.65%)
- Unfavorable WACC higher than ROIC
- Poor interest coverage at 0
- High PB ratio at 25.6
- Limited international sales at under 50M
- Revenue concentrated in few segments
PNR Weaknesses
- Unfavorable P/E at 26.14 and PB at 4.42
- Dividend yield low at 0.96%
- Moderate asset turnover at 0.61
- Some revenue dependency on US market (2.8B)
- Neutral quick ratio at 0.95
Symbotic shows strengths in low leverage and asset efficiency but struggles with profitability and limited geographic diversification. Pentair delivers solid profitability and global diversification but faces valuation and dividend yield challenges. These contrasts highlight differing strategic priorities in capital structure and market expansion.
The Moat Duel: Analyzing Competitive Defensibility
A true structural moat shields long-term profits from relentless competition erosion. Let’s examine the competitive moats of Symbotic Inc. and Pentair plc:
Symbotic Inc.: Innovation-Driven Automation Moat
Symbotic’s moat stems from its proprietary warehouse automation technology, creating high switching costs for clients. Yet, negative EBIT margins and declining ROIC signal value erosion. New product rollouts in 2026 could either deepen or strain this fragile moat.
Pentair plc: Diversified Water Solutions Moat
Pentair’s moat relies on brand strength and broad product diversification across global water treatment markets. Its stable, favorable margins and positive ROIC above WACC underline efficient capital use. Expansion into developing countries in 2026 may reinforce its defense.
Innovation Lock-in vs. Diversified Market Presence
Pentair holds a wider and more durable moat, given its consistent value creation and margin robustness. Symbotic’s innovation moat is narrower and currently under pressure. Pentair is better equipped to defend and grow its market share in evolving industrial sectors.
Which stock offers better returns?
Over the past 12 months, both Symbotic Inc. and Pentair plc showed notable price appreciation with decelerating bullish trends, despite recent modest declines in their stock prices.
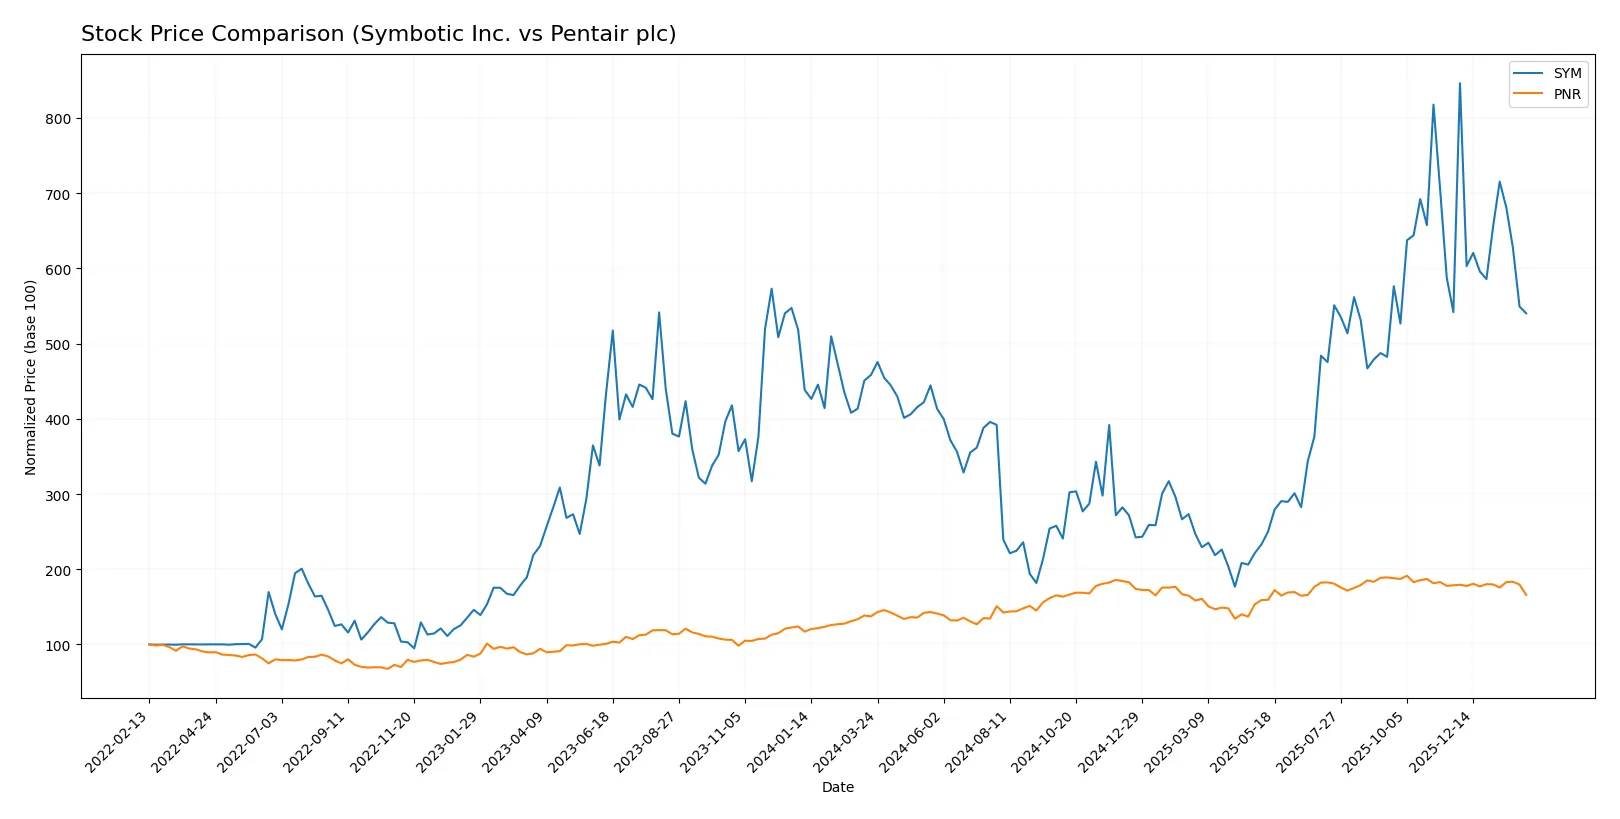
Trend Comparison
Symbotic Inc. posted a 17.9% price increase over the past year, signaling a bullish trend with deceleration. Its price ranged from a low of 17.5 to a high of 83.77.
Pentair plc gained 20.65% over the same period, also reflecting a decelerating bullish trend. The stock traded between 74.39 and 112.23.
Pentair plc outperformed Symbotic Inc. with a higher overall return, although both stocks faced recent downward pressure since late November 2025.
Target Prices
Analysts present a bullish consensus for Symbotic Inc. and Pentair plc, projecting meaningful upside from current prices.
| Company | Target Low | Target High | Consensus |
|---|---|---|---|
| Symbotic Inc. | 42 | 83 | 65.56 |
| Pentair plc | 90 | 135 | 120 |
The consensus target for Symbotic at 65.56 suggests a 22% upside versus the current 53.48 price. Pentair’s 120 consensus implies a 23% gain from 97.3 today, reflecting strong analyst confidence.

Don’t Let Luck Decide Your Entry Point
Optimize your entry points with our advanced ProRealTime indicators. You’ll get efficient buy signals with precise price targets for maximum performance. Start outperforming now!
How do institutions grade them?
The following tables summarize recent institutional grades for Symbotic Inc. and Pentair plc:
Symbotic Inc. Grades
This table lists recent grades from major financial institutions for Symbotic Inc.
| Grading Company | Action | New Grade | Date |
|---|---|---|---|
| Barclays | Maintain | Underweight | 2026-01-12 |
| Goldman Sachs | Downgrade | Sell | 2025-12-02 |
| Barclays | Maintain | Underweight | 2025-11-26 |
| Baird | Maintain | Neutral | 2025-11-26 |
| Cantor Fitzgerald | Maintain | Overweight | 2025-11-25 |
| Citigroup | Maintain | Buy | 2025-11-25 |
| Craig-Hallum | Upgrade | Buy | 2025-11-25 |
| DA Davidson | Maintain | Neutral | 2025-11-25 |
| Needham | Maintain | Buy | 2025-11-25 |
| Northland Capital Markets | Maintain | Outperform | 2025-11-25 |
Pentair plc Grades
This table shows recent grades issued by key institutions for Pentair plc.
| Grading Company | Action | New Grade | Date |
|---|---|---|---|
| Oppenheimer | Maintain | Outperform | 2026-02-04 |
| Citigroup | Maintain | Buy | 2026-02-04 |
| JP Morgan | Maintain | Overweight | 2026-01-16 |
| Citigroup | Maintain | Buy | 2026-01-12 |
| BNP Paribas Exane | Downgrade | Underperform | 2026-01-07 |
| TD Cowen | Downgrade | Sell | 2026-01-05 |
| Jefferies | Upgrade | Buy | 2025-12-10 |
| Barclays | Downgrade | Equal Weight | 2025-12-04 |
| Oppenheimer | Maintain | Outperform | 2025-11-20 |
| RBC Capital | Maintain | Outperform | 2025-10-22 |
Which company has the best grades?
Pentair plc consistently receives strong grades, including multiple “Outperform” and “Buy” ratings from reputable firms. Symbotic Inc. shows mixed signals with some “Buy” ratings but also notable “Underweight” and “Sell” grades. Investors may interpret Pentair’s grades as more favorable for potential upside.
Risks specific to each company
The following categories identify the critical pressure points and systemic threats facing both firms in the 2026 market environment:
1. Market & Competition
Symbotic Inc.
- Faces intense competition in warehouse automation with rapid tech changes and pressure on margins.
Pentair plc
- Operates in diverse water solutions markets with established brands but faces global competition and pricing pressure.
2. Capital Structure & Debt
Symbotic Inc.
- Maintains low debt with favorable debt-to-assets ratio but weak interest coverage indicates risk on servicing debt.
Pentair plc
- Higher leverage but strong interest coverage and solid current ratio reflect prudent capital management.
3. Stock Volatility
Symbotic Inc.
- Beta over 2 signals high volatility, exposing investors to significant price swings.
Pentair plc
- Beta around 1.22 shows moderate volatility, aligning closer to industrial sector norms.
4. Regulatory & Legal
Symbotic Inc.
- Subject to US industrial and technology regulations; risks include data security and automation standards.
Pentair plc
- Faces global regulatory frameworks on water quality and environmental compliance, increasing complexity and costs.
5. Supply Chain & Operations
Symbotic Inc.
- Relies on advanced component suppliers; disruptions could delay system deployments and cost overruns.
Pentair plc
- Global supply chain exposure with multiple product lines; operational efficiency critical but vulnerable to logistic issues.
6. ESG & Climate Transition
Symbotic Inc.
- Emerging company with limited ESG track record; pressure to demonstrate sustainable practices.
Pentair plc
- Long-standing ESG commitments in water conservation and energy efficiency, though climate transition risks remain.
7. Geopolitical Exposure
Symbotic Inc.
- Primarily US-focused, less exposed to geopolitical volatility but limited global diversification.
Pentair plc
- Global footprint subjects Pentair to currency, trade policy, and geopolitical tensions, especially in Europe and Asia.
Which company shows a better risk-adjusted profile?
Symbotic’s highest risk stems from its weak profitability and high stock volatility, threatening capital stability. Pentair’s main risk lies in its complex global regulatory and geopolitical exposures, though its solid financial health mitigates this. Pentair demonstrates a better risk-adjusted profile, supported by positive returns and strong liquidity. Notably, Symbotic’s negative ROIC (-16.6%) versus Pentair’s favorable 12.5% underscores the operational and financial challenges Symbotic must overcome.
Final Verdict: Which stock to choose?
Symbotic Inc. (SYM) impresses with its rapid revenue expansion and operational efficiency, positioning itself as a growth engine in robotics automation. However, its persistent negative returns on invested capital signal caution. SYM suits portfolios seeking aggressive growth with tolerance for early-stage volatility.
Pentair plc (PNR) boasts a solid strategic moat through stable cash flows and consistent value creation above its cost of capital. It offers a sturdier financial profile and more attractive profitability metrics, fitting well within Growth at a Reasonable Price (GARP) strategies aiming for stability with moderate upside.
If you prioritize high-growth potential and can weather uneven profitability, Symbotic Inc. might be the compelling choice due to its innovation-driven expansion. However, if you seek better financial stability and proven value creation, Pentair offers a more dependable foundation despite commanding a premium valuation. Each scenario aligns with distinct investor risk appetites and time horizons.
Disclaimer: Investment carries a risk of loss of initial capital. The past performance is not a reliable indicator of future results. Be sure to understand risks before making an investment decision.
Go Further
I encourage you to read the complete analyses of Symbotic Inc. and Pentair plc to enhance your investment decisions: