In the fast-evolving world of enterprise software, Workday, Inc. and Pegasystems Inc. stand out as key players shaping business operations and customer engagement. Both companies compete in the application software industry, targeting overlapping markets with innovative cloud-based solutions and automation strategies. This comparison will help investors like you understand which company offers the most compelling investment opportunity in 2026. Let’s explore their strengths and potential for growth.
Table of contents
Companies Overview
I will begin the comparison between Workday and Pegasystems by providing an overview of these two companies and their main differences.
Workday Overview
Workday, Inc. is a provider of enterprise cloud applications, focusing on financial management, human capital management, and analytics. The company serves various industries, including financial services, healthcare, education, and retail. Headquartered in Pleasanton, California, Workday aims to help organizations plan, execute, and analyze business operations through cloud-based software solutions.
Pegasystems Overview
Pegasystems Inc. develops enterprise software applications, specializing in customer engagement and digital process automation. Its product portfolio includes the Pega Platform and Pega Infinity, which support sales automation, customer service, and intelligent automation. Based in Cambridge, Massachusetts, Pegasystems serves sectors such as financial services, healthcare, government, and manufacturing globally.
Key similarities and differences
Both Workday and Pegasystems operate in the software application industry with a focus on enterprise solutions and cloud technology. While Workday emphasizes financial and human capital management, Pegasystems centers on customer engagement and process automation. Each targets a broad range of industries but differs in product specialization and scale, with Workday having a larger market capitalization and workforce.
Income Statement Comparison
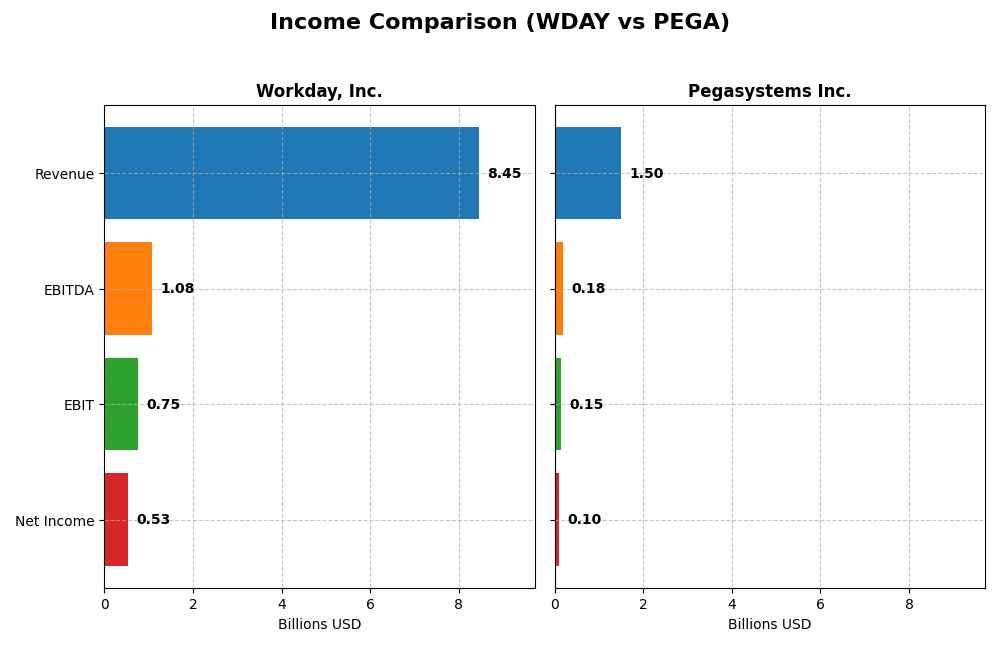
Below is a side-by-side comparison of the most recent full fiscal year income statement metrics for Workday, Inc. and Pegasystems Inc.
| Metric | Workday, Inc. (WDAY) | Pegasystems Inc. (PEGA) |
|---|---|---|
| Market Cap | 49.9B | 8.9B |
| Revenue | 8.45B | 1.50B |
| EBITDA | 1.08B | 185M |
| EBIT | 752M | 149M |
| Net Income | 526M | 99.2M |
| EPS | 1.98 | 0.58 |
| Fiscal Year | 2025 | 2024 |
Income Statement Interpretations
Workday, Inc.
Workday’s revenue showed strong growth from 4.3B in 2021 to 8.4B in 2025, nearly doubling over five years. Net income improved significantly, turning from losses in early years to 526M in 2025. Gross margin remained favorable at 75.5%, with stable operating margins. The latest year saw revenue growth accelerate by 16.35%, although net margin and EPS declined notably.
Pegasystems Inc.
Pegasystems’ revenue rose steadily from 1.0B in 2020 to 1.5B in 2024, showing moderate growth. Net income also improved markedly, reaching 99M in 2024 after prior losses. Gross margin was stable and favorable at 73.9%, while EBIT margin hovered near 10%. The most recent year saw moderate revenue growth of 4.5%, with strong net margin and EPS improvements.
Which one has the stronger fundamentals?
Both companies exhibit favorable income statement fundamentals with strong revenue and net income growth over their respective periods. Workday shows higher revenue scale and more dynamic revenue growth, though with recent margin pressure. Pegasystems presents steadier margin improvements and consistent profitability. The choice hinges on scale versus stability, with both demonstrating solid financial trends.
Financial Ratios Comparison
Below is a comparison of key financial ratios for Workday, Inc. and Pegasystems Inc. based on their most recent fiscal year data, illustrating relative performance and financial health.
| Ratios | Workday, Inc. (WDAY) FY 2025 | Pegasystems Inc. (PEGA) FY 2024 |
|---|---|---|
| ROE | 5.82% | 16.94% |
| ROIC | 2.73% | 7.40% |
| P/E | 132.15 | 80.12 |
| P/B | 7.69 | 13.57 |
| Current Ratio | 1.85 | 1.23 |
| Quick Ratio | 1.85 | 1.23 |
| D/E (Debt to Equity) | 0.37 | 0.94 |
| Debt-to-Assets | 18.70% | 31.09% |
| Interest Coverage | 3.64 | 18.12 |
| Asset Turnover | 0.47 | 0.85 |
| Fixed Asset Turnover | 5.36 | 14.36 |
| Payout Ratio | 0% | 10.28% |
| Dividend Yield | 0% | 0.13% |
Interpretation of the Ratios
Workday, Inc.
Workday displays a balanced mix of favorable and unfavorable ratios, with strengths in liquidity (current and quick ratios at 1.85) and debt management (debt-to-equity at 0.37, interest coverage at 6.6). However, profitability indicators like ROE (5.82%) and ROIC (2.73%) are weak, and valuation ratios (PE at 132.15, PB at 7.69) raise concerns. The company does not pay dividends, likely focusing on reinvestment and growth.
Pegasystems Inc.
Pegasystems shows favorable profitability with a strong ROE of 16.94% and decent net margin (6.63%), alongside solid interest coverage (21.87). Liquidity ratios are moderate (current ratio 1.23), and leverage is higher (debt-to-equity 0.94). Valuation metrics are less attractive (PE 80.12, PB 13.57). The company pays a small dividend yield (0.13%), reflecting modest shareholder returns amid reinvestment.
Which one has the best ratios?
Comparing both, Workday has stronger liquidity and lower leverage but weaker profitability and higher valuation multiples. Pegasystems exhibits better profitability and interest coverage but with higher debt and less liquidity. Overall, Pegasystems’ ratios lean slightly favorable due to profitability, while Workday’s mix results in a neutral stance.
Strategic Positioning
This section compares the strategic positioning of Workday, Inc. and Pegasystems Inc. including: Market position, Key segments, and disruption:
Workday, Inc.
- Large market cap of $49.9B with moderate beta, facing competitive pressure in enterprise cloud apps
- Key segments include subscription services and professional services mainly in finance and HCM
- Exposure through cloud-based applications with machine learning and augmented analytics features
Pegasystems Inc.
- Smaller market cap of $8.9B with moderate beta, competing in enterprise software and digital process automation
- Diverse segments including consulting, maintenance, cloud, and subscription licenses across various industries
- Exposure via intelligent automation, customer engagement, and cloud platform services
Workday, Inc. vs Pegasystems Inc. Positioning
Workday shows a concentrated focus on financial and human capital management cloud applications, benefiting from scale and innovation. Pegasystems offers a more diversified software portfolio emphasizing customer engagement and automation, targeting a broader industry base.
Which has the best competitive advantage?
Both companies exhibit slightly unfavorable MOAT status due to ROIC below WACC but demonstrate growing profitability trends, indicating improving competitive positioning despite current value destruction.
Stock Comparison
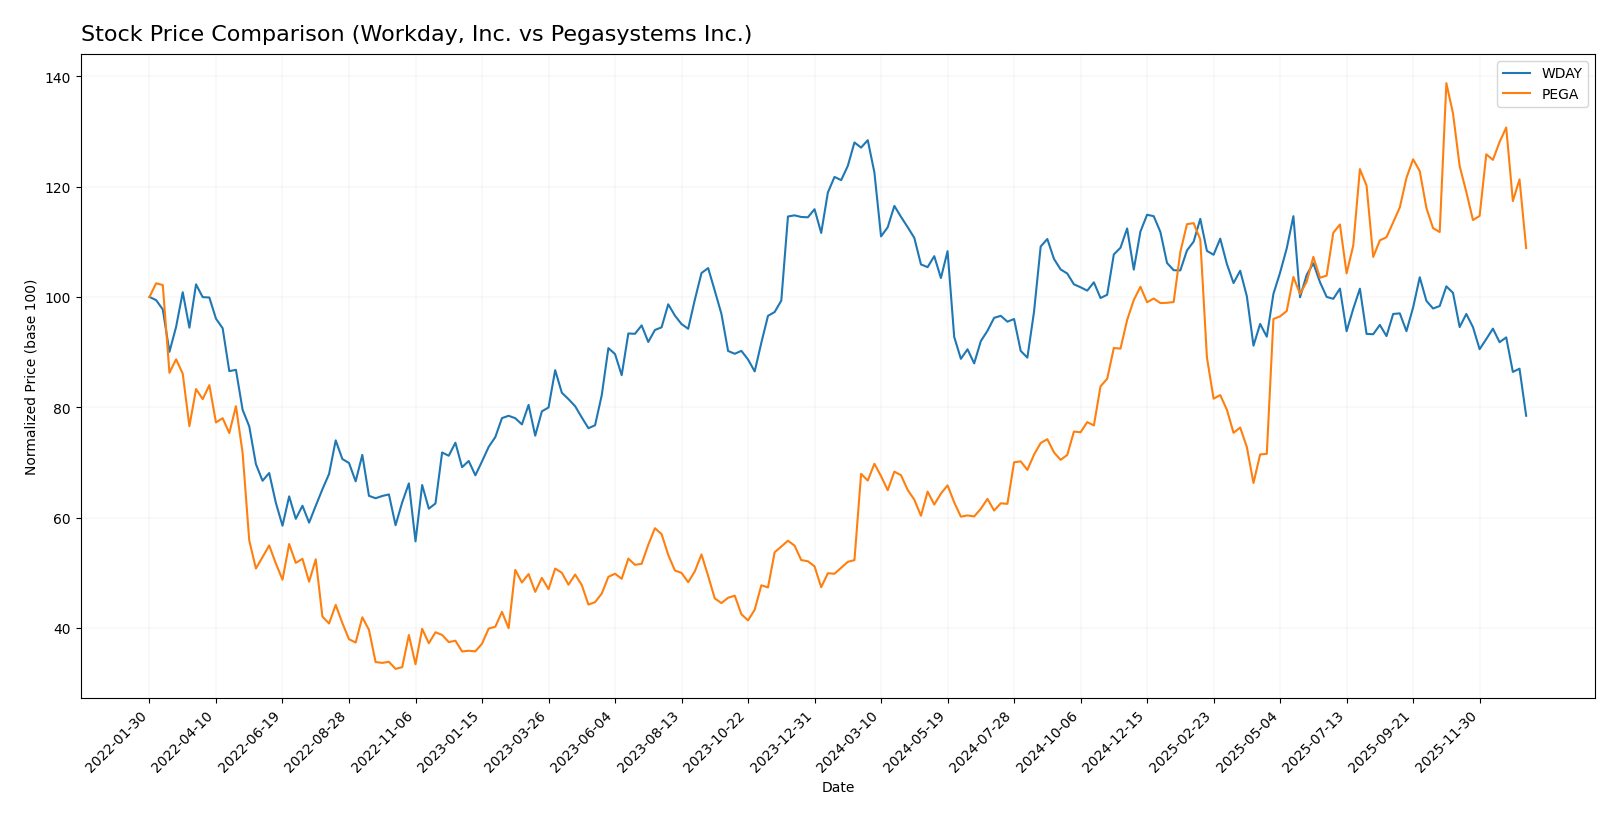
The stock price chart highlights significant divergence in performance over the past 12 months, with Pegasystems Inc. posting a strong rise while Workday, Inc. experienced a considerable decline and increased volatility.
Trend Analysis
Workday, Inc. shows a bearish trend over the past year with a price decline of 38.91%, decelerating in recent months and exhibiting high volatility with a standard deviation of 20.22. The stock peaked at 305.88 and bottomed at 186.86 during this period.
Pegasystems Inc. demonstrates a bullish trend with a strong 63.18% price increase over the past 12 months, although recent months show deceleration and a slight negative slope. Volatility is moderate with a standard deviation of 10.77, and prices ranged from 28.73 to 66.27.
Comparing both stocks, Pegasystems delivered the highest market performance with a 63.18% gain, contrasting with Workday’s 38.91% loss, indicating stronger upward momentum despite recent deceleration.
Target Prices
The current analyst consensus for target prices shows moderate upside potential for both Workday, Inc. and Pegasystems Inc.
| Company | Target High | Target Low | Consensus |
|---|---|---|---|
| Workday, Inc. | 320 | 235 | 274.47 |
| Pegasystems Inc. | 80 | 67 | 74 |
Analysts expect Workday’s stock to rise from its current price of $186.86 toward a consensus target near $274. Pegasystems’ stock, currently at $51.99, also shows potential to reach a consensus target of $74, signaling positive growth expectations.
Analyst Opinions Comparison
This section compares analysts’ ratings and financial scores for Workday, Inc. and Pegasystems Inc.:
Rating Comparison
WDAY Rating
- Rating: B-, classified as Very Favorable by analysts.
- Discounted Cash Flow Score: 4, indicating a Favorable DCF.
- ROE Score: 3, reflecting Moderate efficiency in equity use.
- ROA Score: 3, showing Moderate asset utilization.
- Debt To Equity Score: 2, indicating Moderate financial risk.
- Overall Score: 2, representing a Moderate overall rating.
PEGA Rating
- Rating: B+, classified as Very Favorable by analysts.
- Discounted Cash Flow Score: 3, indicating a Moderate DCF.
- ROE Score: 5, reflecting Very Favorable efficiency in equity use.
- ROA Score: 5, showing Very Favorable asset utilization.
- Debt To Equity Score: 3, indicating Moderate financial risk.
- Overall Score: 3, representing a Moderate overall rating.
Which one is the best rated?
Based strictly on the provided data, Pegasystems holds a higher rating (B+) with stronger ROE and ROA scores and a better overall score than Workday, which has a B- rating and lower scores in those categories.
Scores Comparison
Here is a comparison of the Altman Z-Score and Piotroski Score for Workday and Pegasystems:
WDAY Scores
- Altman Z-Score: 4.41, indicating financial safety.
- Piotroski Score: 6, reflecting average financial strength.
PEGA Scores
- Altman Z-Score: 10.31, indicating strong financial safety.
- Piotroski Score: 8, reflecting very strong financial strength.
Which company has the best scores?
Pegasystems has higher scores in both Altman Z-Score and Piotroski Score, indicating stronger financial health and lower bankruptcy risk than Workday based on the provided data.
Grades Comparison
Here is an overview of the recent grades assigned to Workday, Inc. and Pegasystems Inc. by various reputable grading companies:
Workday, Inc. Grades
The following table summarizes the latest grades given to Workday, Inc.:
| Grading Company | Action | New Grade | Date |
|---|---|---|---|
| Barclays | Maintain | Overweight | 2026-01-12 |
| RBC Capital | Maintain | Outperform | 2026-01-05 |
| TD Cowen | Maintain | Buy | 2025-11-26 |
| DA Davidson | Maintain | Neutral | 2025-11-26 |
| Wells Fargo | Maintain | Overweight | 2025-11-26 |
| Barclays | Maintain | Overweight | 2025-11-26 |
| Keybanc | Maintain | Overweight | 2025-11-26 |
| Citigroup | Maintain | Neutral | 2025-11-26 |
| JP Morgan | Maintain | Overweight | 2025-11-26 |
| UBS | Maintain | Neutral | 2025-11-26 |
Workday’s grades predominantly indicate a positive outlook, with most firms maintaining Overweight or Buy ratings, and a few Neutral ratings, showing stable confidence.
Pegasystems Inc. Grades
The following table summarizes the latest grades given to Pegasystems Inc.:
| Grading Company | Action | New Grade | Date |
|---|---|---|---|
| JP Morgan | Maintain | Overweight | 2025-12-05 |
| Wedbush | Maintain | Outperform | 2025-10-23 |
| RBC Capital | Maintain | Outperform | 2025-10-23 |
| Barclays | Maintain | Equal Weight | 2025-10-23 |
| Rosenblatt | Maintain | Buy | 2025-10-23 |
| DA Davidson | Upgrade | Buy | 2025-10-22 |
| Rosenblatt | Maintain | Buy | 2025-10-15 |
| Rosenblatt | Maintain | Buy | 2025-07-24 |
| DA Davidson | Maintain | Neutral | 2025-07-24 |
| Wedbush | Maintain | Outperform | 2025-07-24 |
Pegasystems shows a generally positive grade trend, with several Buy and Outperform ratings, one upgrade from Neutral to Buy, and a single Equal Weight rating, suggesting a cautiously optimistic consensus.
Which company has the best grades?
Both Workday, Inc. and Pegasystems Inc. hold a consensus “Buy” rating, but Workday exhibits a stronger concentration of Overweight and Buy grades from a broader set of analysts. This might imply relatively higher confidence from the market in Workday’s performance, potentially affecting investor sentiment and portfolio decisions.
Strengths and Weaknesses
Below is a comparison table highlighting the key strengths and weaknesses of Workday, Inc. and Pegasystems Inc. based on the most recent data available.
| Criterion | Workday, Inc. (WDAY) | Pegasystems Inc. (PEGA) |
|---|---|---|
| Diversification | Revenue mainly from Subscription Services (7.7B) with growing Professional Services (728M) | More diversified with Pega Cloud (1.13B), Subscription License (398M), Maintenance (341M), Consulting (213M), and smaller license revenues |
| Profitability | Net margin 6.23% (neutral); ROIC 2.73% (unfavorable) below WACC 8.86%; shedding value but ROIC growing | Net margin 6.63% (neutral); ROIC 7.4% (neutral) below WACC 8.58%; shedding value but ROIC growing |
| Innovation | Strong fixed asset turnover (5.36, favorable) indicating efficient asset use | Very high fixed asset turnover (14.36, favorable), strong interest coverage (21.87, favorable) |
| Global presence | Solid global footprint through cloud subscription model | Global presence supported by diverse cloud and consulting services |
| Market Share | Leading in cloud HCM and finance software | Strong in BPM and customer engagement software with growing cloud adoption |
Key takeaways: Both companies are currently shedding value as their ROICs are below WACC, though both show improving profitability trends. Workday is more focused on subscription services with consistent growth, while Pegasystems offers more diversified revenue streams and stronger profitability ratios. Investors should weigh growth potential against current value destruction and consider risk tolerance accordingly.
Risk Analysis
Below is a comparison of key risks for Workday, Inc. (WDAY) and Pegasystems Inc. (PEGA) based on the most recent data from 2025 and 2024 respectively:
| Metric | Workday, Inc. (WDAY) | Pegasystems Inc. (PEGA) |
|---|---|---|
| Market Risk | Beta 1.142, moderate volatility | Beta 1.084, moderate volatility |
| Debt level | Low debt-to-equity 0.37, favorable leverage | Moderate debt-to-equity 0.94, neutral leverage |
| Regulatory Risk | Moderate (tech sector, US-focused) | Moderate (global operations, diverse markets) |
| Operational Risk | Medium (cloud services; scalability challenges) | Medium (software platform complexity) |
| Environmental Risk | Low impact (software industry) | Low impact (software industry) |
| Geopolitical Risk | Moderate (mainly US, some international exposure) | Higher (broader international presence) |
The most likely and impactful risks center on market volatility and operational challenges inherent in software cloud platforms. Workday’s lower debt and stronger liquidity reduce financial risk, while Pegasystems’ broader global footprint exposes it more to geopolitical uncertainty. Both companies face moderate regulatory scrutiny typical for their sector.
Which Stock to Choose?
Workday, Inc. (WDAY) shows a favorable income statement with 16.35% revenue growth in 2025 and strong overall growth since 2021. Its financial ratios are mixed, with a neutral global evaluation, moderate profitability, low debt, and a very favorable B- rating.
Pegasystems Inc. (PEGA) presents a favorable income trend with moderate 4.51% revenue growth in 2024 and positive long-term net margin growth. Its financial ratios are slightly favorable overall, characterized by solid profitability, moderate debt levels, and a very favorable B+ rating.
For investors prioritizing growth, WDAY’s higher revenue expansion and improving profitability may appear attractive, while PEGA’s slightly favorable ratios and stronger profitability metrics might appeal to those seeking a balance of stability and value. The choice could depend on the investor’s risk tolerance and strategy.
Disclaimer: Investment carries a risk of loss of initial capital. The past performance is not a reliable indicator of future results. Be sure to understand risks before making an investment decision.
Go Further
I encourage you to read the complete analyses of Workday, Inc. and Pegasystems Inc. to enhance your investment decisions: