Home > Comparison > Technology > U vs PEGA
The strategic rivalry between Unity Software Inc. and Pegasystems Inc. shapes the technology sector’s software application landscape. Unity operates a cutting-edge interactive 3D content platform, focusing on real-time graphics across multiple devices. Pegasystems specializes in enterprise software with integrated customer engagement and process automation solutions. This analysis contrasts their operational models to reveal which trajectory offers superior risk-adjusted returns for diversified portfolios in a dynamic market environment.

Table of contents
Companies Overview
Unity Software Inc. and Pegasystems Inc. stand as pivotal software players shaping diverse technology landscapes.
Unity Software Inc.: Interactive 3D Content Pioneer
Unity Software Inc. dominates the interactive real-time 3D content platform market. It generates revenue by providing software that enables developers to create and monetize 2D and 3D content across multiple devices. In 2026, Unity sharpens its focus on expanding its global footprint and enhancing monetization tools for content creators.
Pegasystems Inc.: Enterprise Software Innovator
Pegasystems Inc. leads in enterprise software applications with a suite addressing customer engagement and automation. Its revenue stems from licensing, hosting, and support services for platforms like Pega Infinity. The company prioritizes intelligent automation and cloud-based solutions in 2026 to boost enterprise digital transformation.
Strategic Collision: Similarities & Divergences
Unity and Pegasystems pursue growth through software but diverge sharply: Unity thrives on an open interactive content ecosystem, while Pegasystems operates a closed, integrated enterprise platform. Their competition centers on digital innovation—content creation versus business process automation. Each presents a distinct risk-reward profile shaped by market focus and customer base.
Income Statement Comparison
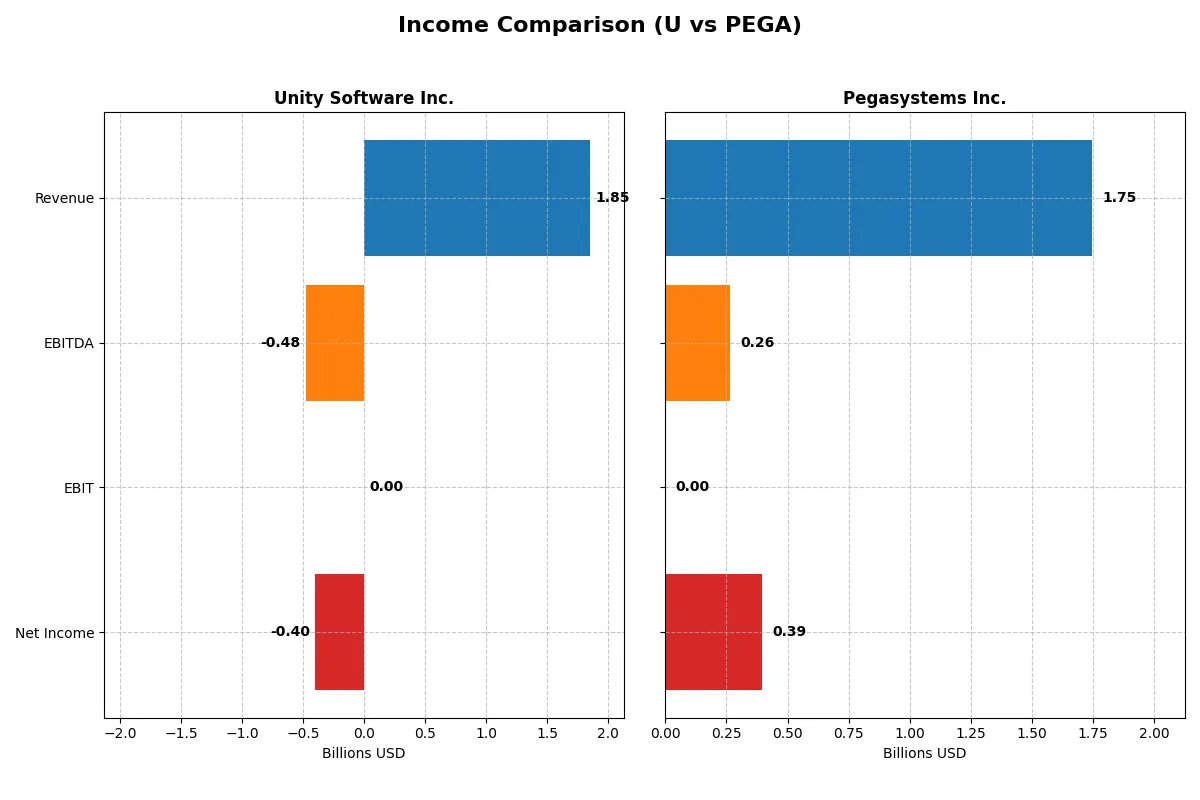
This data dissects the core profitability and scalability of both corporate engines to reveal who dominates the bottom line:
| Metric | Unity Software Inc. (U) | Pegasystems Inc. (PEGA) |
|---|---|---|
| Revenue | 1.85B | 1.75B |
| Cost of Revenue | 478M | 421M |
| Operating Expenses | 1.85B | 1.04B |
| Gross Profit | 1.37B | 1.32B |
| EBITDA | -479M | 263M |
| EBIT | 0 | 0 |
| Interest Expense | -24M | -1.3M |
| Net Income | -403M | 393M |
| EPS | -0.96 | 2.3 |
| Fiscal Year | 2025 | 2025 |
Income Statement Analysis: The Bottom-Line Duel
This income statement comparison reveals which company runs a more efficient and profitable business engine in 2025.
Unity Software Inc. Analysis
Unity’s revenue rose modestly to $1.85B in 2025, up 2% year-over-year, with gross profit holding strong at $1.37B, reflecting a solid 74.2% gross margin. However, net income remains deeply negative at -$403M, despite a 41% improvement in net margin, signaling continued operating losses and heavy R&D investment weighing on profitability.
Pegasystems Inc. Analysis
Pegasystems delivered stronger revenue growth, climbing 16.6% to $1.75B in 2025, and maintained a healthy 75.9% gross margin with $1.32B gross profit. The company swung to a positive net income of $393M, driven by disciplined expense control and a 22.5% net margin, demonstrating robust operational momentum and capital efficiency.
Verdict: Growth Resilience vs. Profit Leadership
Pegasystems outperforms Unity with superior revenue growth and a clear path to sustained profitability, boasting a positive net margin and significant net income gains. Unity shows improving margins but remains loss-making, burdened by high costs. For investors, Pegasystems offers a more attractive profile of scalable profits and operational discipline.
Financial Ratios Comparison
These vital ratios act as a diagnostic tool to expose the underlying fiscal health, valuation premiums, and capital efficiency of each company:
| Ratios | Unity Software Inc. (U) | Pegasystems Inc. (PEGA) |
|---|---|---|
| ROE | -12.4% | 49.97% |
| ROIC | -8.16% | 29.43% |
| P/E | -46.16 | 25.92 |
| P/B | 5.74 | 12.95 |
| Current Ratio | 1.84 | 1.33 |
| Quick Ratio | 1.84 | 1.33 |
| D/E | 0.69 | 0.08 |
| Debt-to-Assets | 32.7% | 3.7% |
| Interest Coverage | 19.95 | -204.75 |
| Asset Turnover | 0.27 | 1.07 |
| Fixed Asset Turnover | 27.09 | 0 |
| Payout ratio | 0 | 3.92% |
| Dividend yield | 0 | 0.15% |
| Fiscal Year | 2025 | 2025 |
Efficiency & Valuation Duel: The Vital Signs
Financial ratios act as the company’s DNA, exposing hidden risks and operational strengths that guide investor decisions.
Unity Software Inc.
Unity displays negative profitability with a -12.44% ROE and -21.78% net margin, signaling operational challenges. Its valuation metrics, including a negative P/E and a high P/B of 5.74, suggest a stretched stock price. Unity does not pay dividends, instead reinvesting heavily in R&D, dedicating over 50% of revenue to innovation.
Pegasystems Inc.
Pegasystems shows strong profitability with a 49.97% ROE and 22.54% net margin, reflecting efficient operations. Its P/E of 25.92 and P/B of 12.95 indicate a relatively expensive valuation. The company offers a modest 0.15% dividend yield, balancing shareholder returns with continued growth investments.
Operational Struggles vs. Profitability Premium
Pegasystems offers a superior balance of profitability and operational efficiency despite a premium valuation. Unity’s negative returns and stretched valuation pose higher risks. Investors prioritizing growth and innovation may lean toward Unity, while those seeking operational safety might prefer Pegasystems.
Which one offers the Superior Shareholder Reward?
Unity Software Inc. (U) does not pay dividends and shows negative net margins, reflecting ongoing losses. It relies on reinvestment in growth, with modest free cash flow of 0.96/share in 2025. Buybacks are negligible or absent. Pegasystems Inc. (PEGA) pays a modest dividend yield of 0.15% with a payout ratio around 4%. Its net margin of 22.5% and free cash flow of 2.96/share underpin sustainable payouts. PEGA also maintains active buybacks, enhancing total shareholder return. I see PEGA’s balanced dividend and buyback strategy as more sustainable and rewarding for investors in 2026.
Comparative Score Analysis: The Strategic Profile
The radar chart reveals the fundamental DNA and trade-offs of Unity Software Inc. and Pegasystems Inc., highlighting their distinct financial strengths and weaknesses:
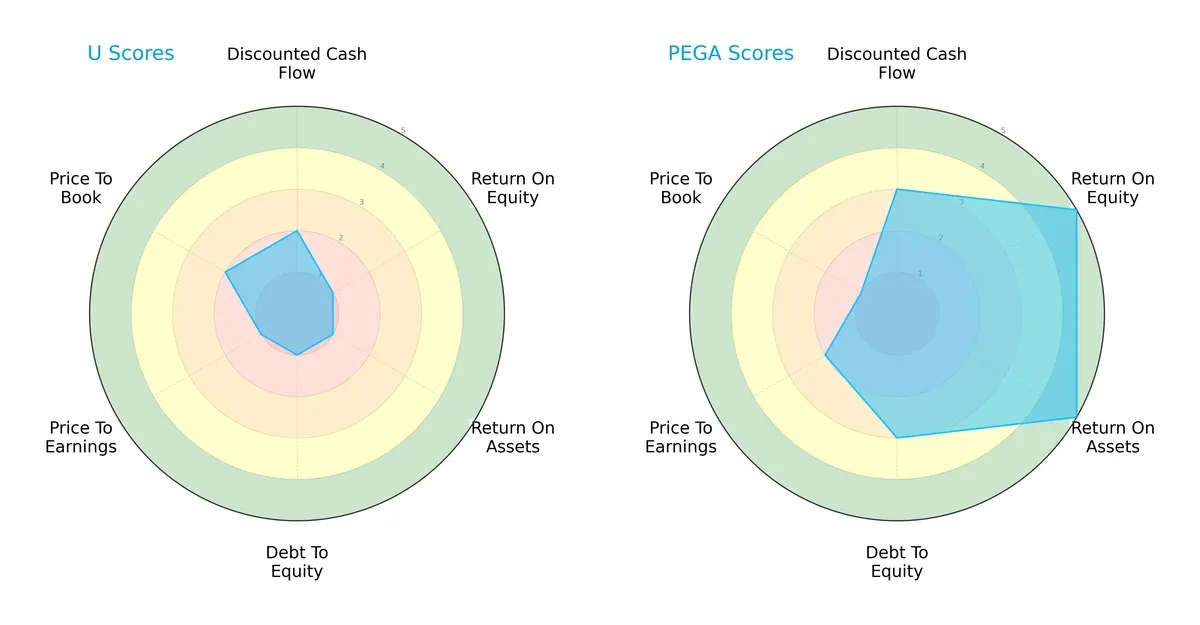
Pegasystems dominates across most metrics, boasting superior ROE (5 vs. 1) and ROA (5 vs. 1), signaling efficient profit generation and asset use. It maintains moderate debt-to-equity (3) and DCF scores (3), showing balanced risk and valuation. Unity Software relies on a weaker valuation edge (slightly better P/B at 2 vs. 1) but suffers from very unfavorable scores in debt, ROE, ROA, and P/E. Pegasystems offers a far more balanced and robust financial profile.
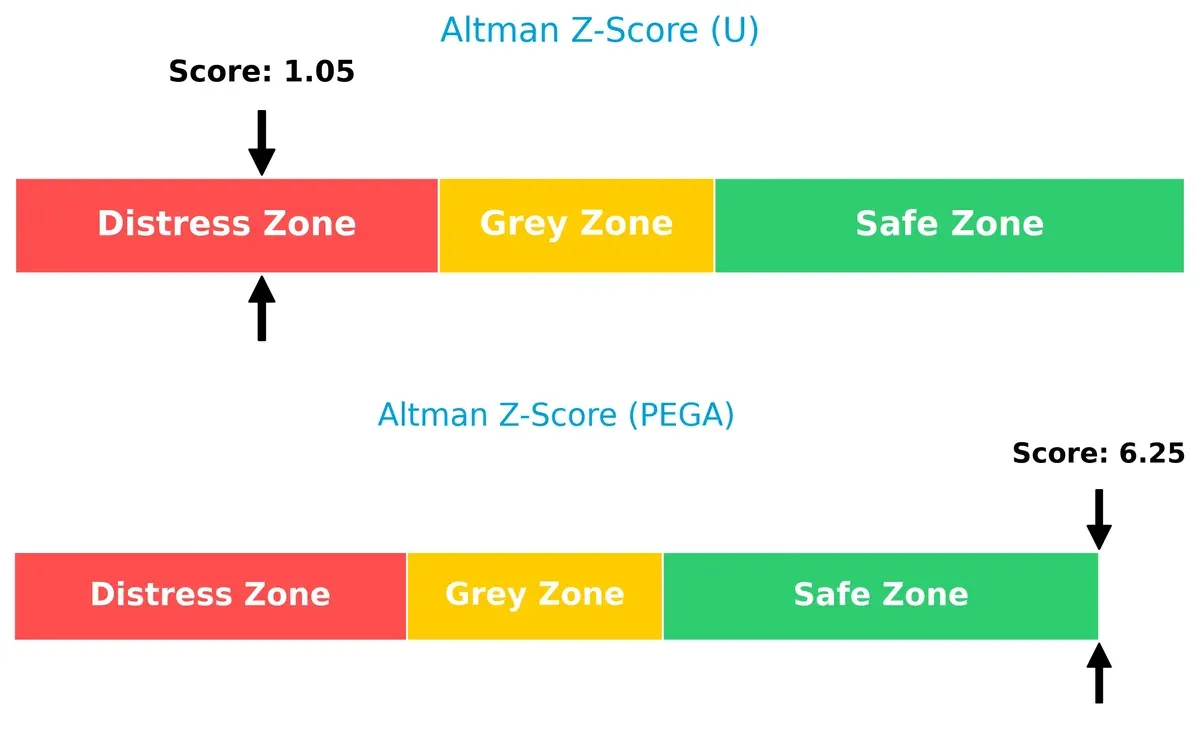
Bankruptcy Risk: Solvency Showdown
The Altman Z-Score gap sharply favors Pegasystems, placing it in the safe zone (6.25) versus Unity’s distress zone (1.05), signaling significant solvency risk for Unity:
Financial Health: Quality of Operations
Pegasystems scores an impressive 8 on the Piotroski F-Score, indicating very strong financial health. Unity’s score of 4 suggests average health with internal red flags:
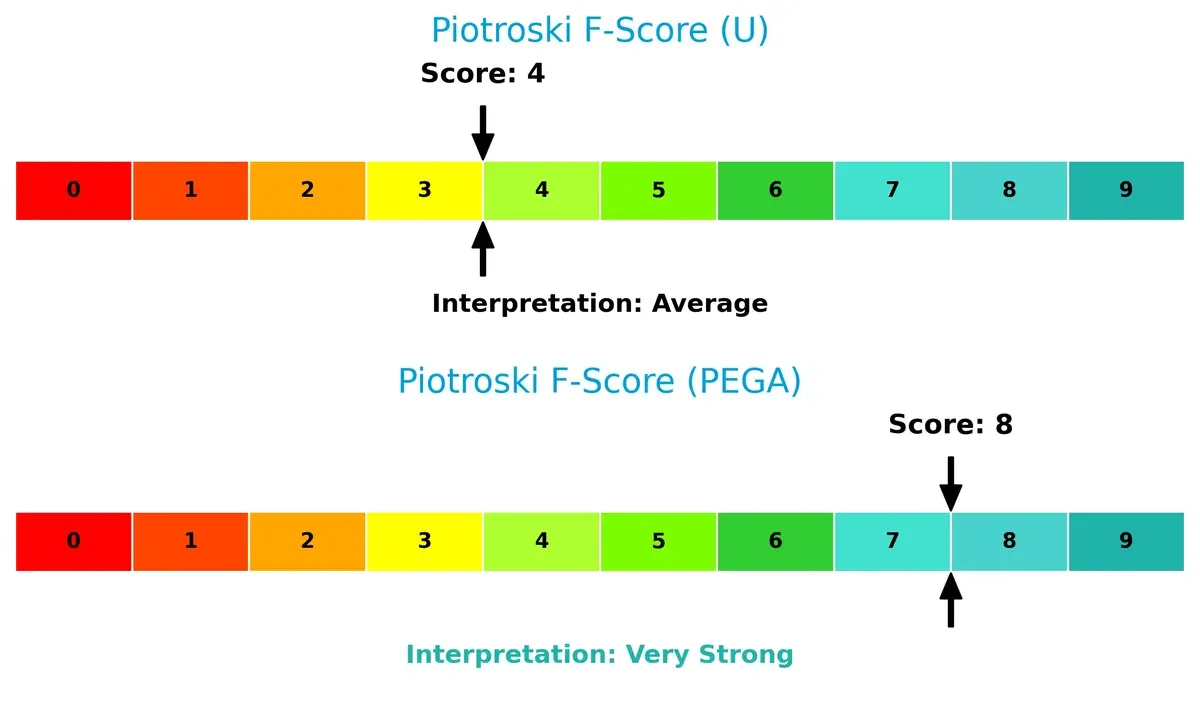
Pegasystems exhibits superior operational quality, reflecting prudent capital allocation and sound fundamentals. Unity’s middling score warns investors to approach cautiously due to weaker internal metrics.
How are the two companies positioned?
This section dissects the operational DNA of Unity and Pegasystems by comparing their revenue distribution and internal dynamics. The goal is to confront their economic moats and identify the more resilient, sustainable competitive advantage today.
Revenue Segmentation: The Strategic Mix
This visual comparison dissects how Unity Software Inc. and Pegasystems Inc. diversify income streams and highlights their primary sector bets:
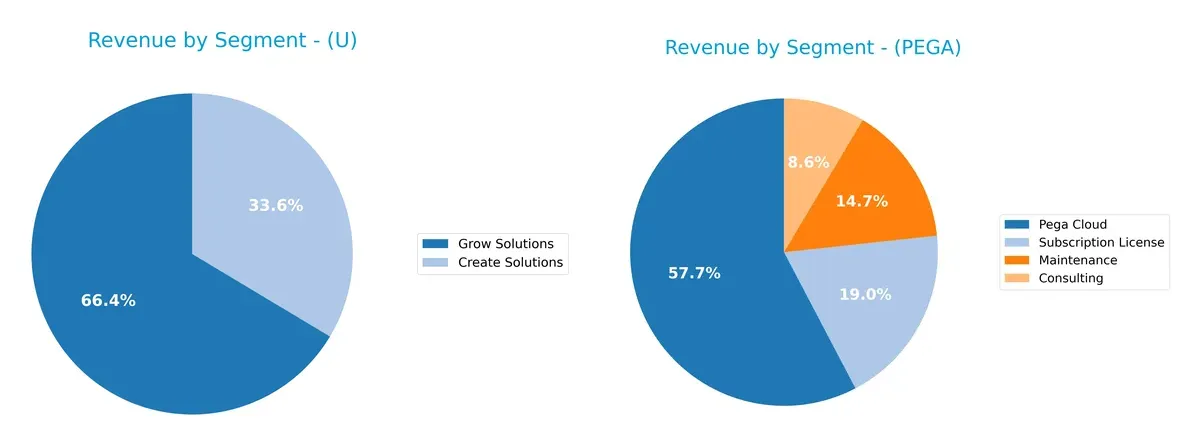
Unity Software anchors revenue in two clear segments: Grow Solutions at $1.23B and Create Solutions at $621M. Pegasystems presents a more diversified mix, with Pega Cloud dominating at $1.54B but supported by Subscription License ($507M), Maintenance ($393M), and Consulting ($228M). Unity’s focus signals a concentrated platform play, while Pegasystems leverages a broad service ecosystem, reducing concentration risk but requiring complex capital allocation.
Strengths and Weaknesses Comparison
This table compares the strengths and weaknesses of Unity Software Inc. and Pegasystems Inc.:
Unity Software Inc. Strengths
- Strong product revenue in Grow Solutions and Create Solutions
- Favorable current and quick ratios at 1.84
- Solid fixed asset turnover at 27.09
Pegasystems Inc. Strengths
- High profitability with net margin 22.54% and ROE 49.97%
- Favorable ROIC at 29.43% above WACC
- Low debt-to-assets at 3.73% with strong asset turnover 1.07
Unity Software Inc. Weaknesses
- Negative net margin (-21.78%) and ROE (-12.44%)
- Unfavorable interest coverage and asset turnover
- High PB ratio at 5.74 indicates valuation concerns
Pegasystems Inc. Weaknesses
- Elevated PB ratio at 12.95 and PE ratio above 25
- Unfavorable interest coverage and zero fixed asset turnover
- Low dividend yield at 0.15%
Unity shows strengths in product revenue diversification and liquidity but suffers from poor profitability and operational efficiency. Pegasystems demonstrates robust profitability and financial health with low leverage, yet faces valuation premium and some operational risks. Both companies’ profiles suggest differing strategic priorities and risk exposures.
The Moat Duel: Analyzing Competitive Defensibility
A structural moat is the sole barrier protecting long-term profits from competitive erosion. Let’s dissect the sources and strength of moats for these two software firms:
Unity Software Inc.: Network Effects Powerhouse
Unity’s moat stems from powerful network effects embedded in its real-time 3D content platform. This advantage reflects in its improving ROIC trend, despite a current value destruction relative to WACC. Expansion into AR/VR markets in 2026 could deepen its competitive edge but demands vigilance as profitability remains fragile.
Pegasystems Inc.: Intangible Assets and Efficient Capital Use
Pegasystems leverages intangible assets—its proprietary enterprise software—and demonstrates a strong, growing ROIC well above WACC. Unlike Unity, PEGA converts growth into consistent value creation, supported by favorable margins and global enterprise client penetration. Its platform innovation and automation offerings suggest robust moat expansion potential.
Verdict: Network Effects vs. Intangible Asset Moat
Pegasystems holds the deeper and more sustainable moat, evidenced by a 20.8% ROIC premium to WACC and accelerating profitability. Unity’s network effects show promise but currently fall short of efficiently converting capital into value. PEGA is better positioned to defend and grow market share in 2026.
Which stock offers better returns?
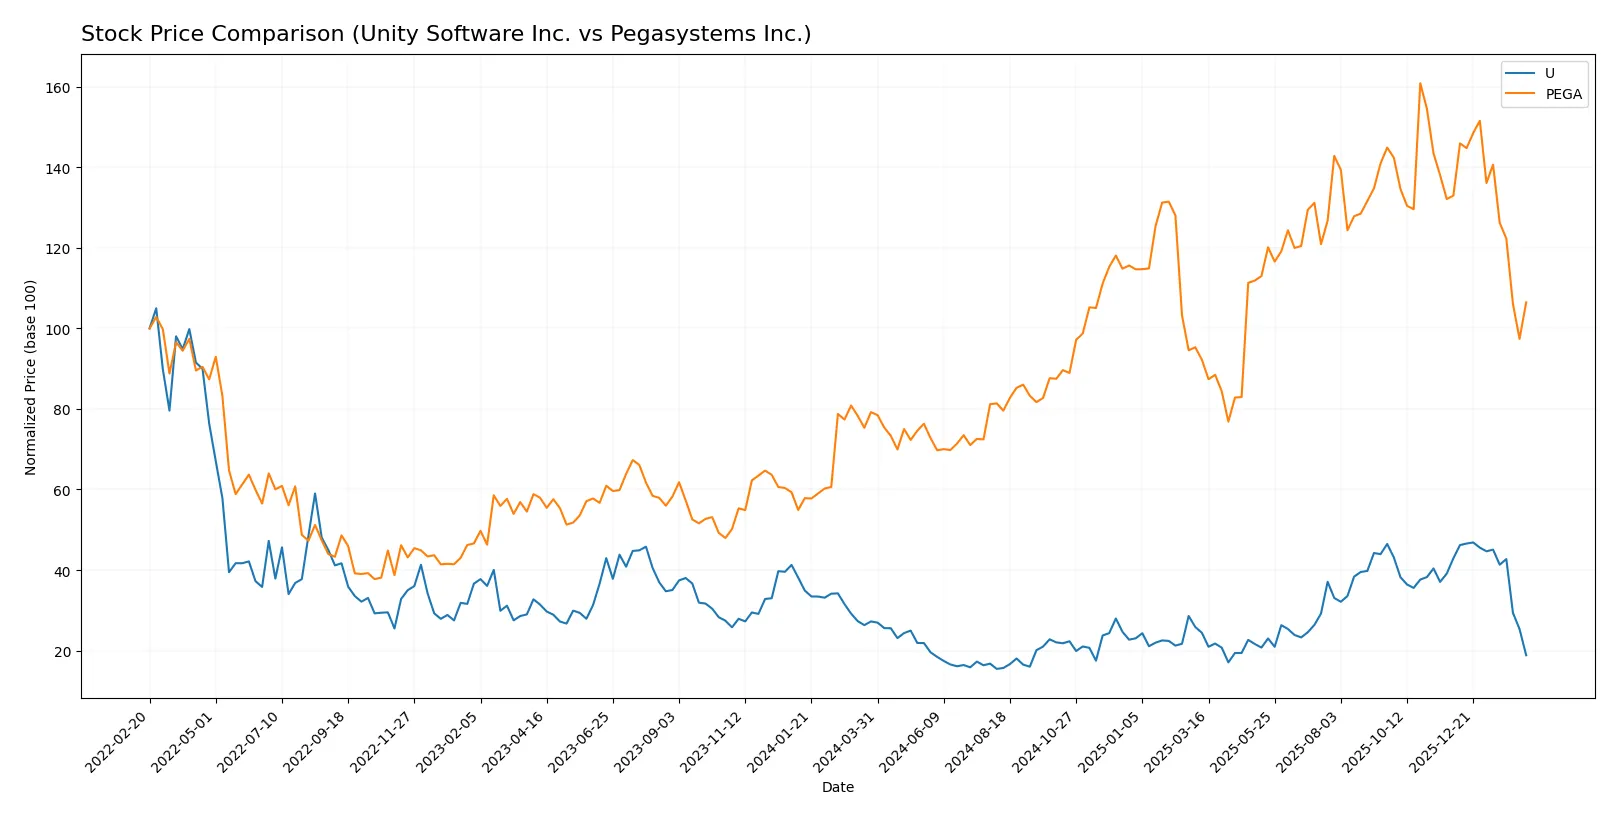
The past year saw divergent trajectories: Unity Software Inc. declined sharply, while Pegasystems Inc. gained ground before recent pullbacks shaped their trading dynamics.
Trend Comparison
Unity Software’s stock fell 30.79% over 12 months, marking a bearish trend with decelerating losses. It hit a high of 46.42 and dropped to a low of 15.32.
Pegasystems’ stock rose 34.39% over the same period, signaling a bullish trend despite deceleration. It peaked at 66.27 and bottomed at 28.73.
Comparing both, Pegasystems delivered superior market performance, outperforming Unity by a wide margin in total price appreciation.
Target Prices
Analysts present a wide range of targets, suggesting varied optimism for these software companies.
| Company | Target Low | Target High | Consensus |
|---|---|---|---|
| Unity Software Inc. | 26 | 60 | 37.7 |
| Pegasystems Inc. | 48 | 65 | 58.25 |
Unity’s consensus target of 37.7 implies more than 100% upside from the current 18.68 price. Pegasystems shows a 33% potential gain versus its 43.85 price.

Don’t Let Luck Decide Your Entry Point
Optimize your entry points with our advanced ProRealTime indicators. You’ll get efficient buy signals with precise price targets for maximum performance. Start outperforming now!
How do institutions grade them?
Unity Software Inc. Grades
The latest institutional grades for Unity Software Inc. as of February 12, 2026:
| Grading Company | Action | New Grade | Date |
|---|---|---|---|
| Goldman Sachs | maintain | Neutral | 2026-02-12 |
| BTIG | maintain | Buy | 2026-02-12 |
| Needham | maintain | Buy | 2026-02-12 |
| Wells Fargo | maintain | Overweight | 2026-02-12 |
| Wedbush | maintain | Outperform | 2026-02-12 |
| Macquarie | maintain | Outperform | 2026-02-12 |
| UBS | maintain | Neutral | 2026-02-12 |
| Citigroup | maintain | Buy | 2026-02-12 |
| Barclays | maintain | Equal Weight | 2026-02-12 |
| Citizens | maintain | Market Outperform | 2026-02-12 |
Pegasystems Inc. Grades
The latest institutional grades for Pegasystems Inc. as of February 12, 2026:
| Grading Company | Action | New Grade | Date |
|---|---|---|---|
| Rosenblatt | maintain | Buy | 2026-02-12 |
| RBC Capital | maintain | Outperform | 2026-02-12 |
| Citizens | maintain | Market Outperform | 2026-02-12 |
| Barclays | upgrade | Overweight | 2026-02-12 |
| Wedbush | maintain | Outperform | 2026-02-12 |
| Citigroup | maintain | Buy | 2026-02-12 |
| Rosenblatt | maintain | Buy | 2026-02-06 |
| JP Morgan | maintain | Overweight | 2025-12-05 |
| RBC Capital | maintain | Outperform | 2025-10-23 |
| Wedbush | maintain | Outperform | 2025-10-23 |
Which company has the best grades?
Pegasystems Inc. generally receives slightly higher grades, including an upgrade by Barclays to Overweight. This suggests stronger analyst confidence, potentially attracting more investor interest compared to Unity Software Inc.
Risks specific to each company
The following categories identify critical pressure points and systemic threats facing Unity Software Inc. and Pegasystems Inc. in the 2026 market environment:
1. Market & Competition
Unity Software Inc.
- Faces intense competition in real-time 3D content platforms, with pressure from larger tech firms and fast innovation cycles.
Pegasystems Inc.
- Competes in enterprise software with strong incumbents; benefits from diversified client base but must innovate continually to stay relevant.
2. Capital Structure & Debt
Unity Software Inc.
- Moderate leverage with 0.69 debt-to-equity; interest coverage near zero signals potential strain servicing debt.
Pegasystems Inc.
- Low leverage at 0.08 debt-to-equity; stronger balance sheet with manageable debt levels and better financial flexibility.
3. Stock Volatility
Unity Software Inc.
- High beta of 2.085 indicates significant price swings and market sensitivity.
Pegasystems Inc.
- Beta of 1.07 shows moderate volatility, closer to market benchmark, offering comparatively stable stock behavior.
4. Regulatory & Legal
Unity Software Inc.
- Operating globally exposes it to diverse regulatory environments, including data privacy and content compliance risks.
Pegasystems Inc.
- Broad global footprint also faces regulatory scrutiny, especially around data security and software licensing in regulated industries.
5. Supply Chain & Operations
Unity Software Inc.
- Relies on software delivery platforms and cloud infrastructure; operational risks include platform outages and developer ecosystem stability.
Pegasystems Inc.
- Dependent on cloud hosting and partner integrations; operational risks stem from service disruptions and technology shifts.
6. ESG & Climate Transition
Unity Software Inc.
- Limited direct environmental impact but faces pressure to enhance social governance and sustainable software practices.
Pegasystems Inc.
- Increasing focus on ESG compliance in client sectors adds pressure; must demonstrate strong governance and ethical standards.
7. Geopolitical Exposure
Unity Software Inc.
- Significant exposure to China and Europe; geopolitical tensions may disrupt market access and supply chains.
Pegasystems Inc.
- Exposure to global markets including Europe and Asia-Pacific; geopolitical risks could affect contract renewals and data regulations.
Which company shows a better risk-adjusted profile?
Unity Software’s most impactful risk lies in its precarious capital structure, indicated by weak interest coverage and financial distress signals. Pegasystems faces competitive and innovation pressures but benefits from a strong balance sheet and lower volatility. Pegasystems shows a better risk-adjusted profile, supported by its Altman Z-score of 6.25 (safe zone) versus Unity’s 1.05 (distress zone). This financial resilience, combined with superior profitability metrics, justifies my concern for Unity’s financial stability despite its market potential.
Final Verdict: Which stock to choose?
Unity Software’s superpower lies in its relentless investment in innovation, driving a growing return on invested capital despite current losses. Its point of vigilance is the ongoing value destruction and financial distress signals, which could pressure risk-averse investors. It suits an aggressive growth portfolio willing to tolerate volatility for long-term upside.
Pegasystems commands a strong strategic moat with efficient capital use and robust profitability, reflected in its superior ROIC versus WACC and solid cash flow generation. It offers better financial stability and a safer profile than Unity, making it attractive for investors focused on GARP—growth at a reasonable price—with moderate risk tolerance.
If you prioritize aggressive growth and can stomach near-term losses, Unity appears compelling due to its innovation-driven ROIC improvement. However, if you seek a more stable investment with clearer value creation and profitability, Pegasystems outshines as the better choice for risk-managed growth investors. Both scenarios require careful monitoring of evolving fundamentals.
Disclaimer: Investment carries a risk of loss of initial capital. The past performance is not a reliable indicator of future results. Be sure to understand risks before making an investment decision.
Go Further
I encourage you to read the complete analyses of Unity Software Inc. and Pegasystems Inc. to enhance your investment decisions: