Home > Comparison > Technology > UBER vs PEGA
The strategic rivalry between Uber Technologies, Inc. and Pegasystems Inc. shapes the evolution of the technology sector. Uber operates as a capital-intensive platform connecting mobility, delivery, and freight services globally. In contrast, Pegasystems focuses on high-margin enterprise software and digital process automation. This analysis examines their divergent business models to identify which offers a superior risk-adjusted return for a diversified portfolio amid ongoing technological disruption.
Table of contents
Companies Overview
Uber Technologies and Pegasystems hold pivotal roles in the software application market with distinct value propositions.
Uber Technologies, Inc.: Global Mobility and Delivery Powerhouse
Uber dominates the mobility and delivery services market by connecting riders with drivers and consumers with delivery providers across multiple continents. Its revenue streams stem from three segments: Mobility, Delivery, and Freight, leveraging proprietary technology to facilitate ride services, meal and grocery deliveries, and freight logistics. In 2026, Uber’s strategic focus remains on expanding its platform ecosystem and enhancing financial partnerships to solidify market leadership.
Pegasystems Inc.: Enterprise Software Innovator
Pegasystems leads in enterprise software applications, offering platforms that unify customer engagement and digital process automation. Its core revenue comes from licensing and hosting software like Pega Platform and Pega Infinity, which streamline customer service, sales automation, and intelligent automation across industries. In 2026, Pegasystems prioritizes cloud-based solutions and expanding automation capabilities to enhance enterprise digital transformation.
Strategic Collision: Similarities & Divergences
Both companies operate in technology but diverge sharply: Uber builds a platform-driven marketplace focusing on consumer services, while Pegasystems crafts enterprise software ecosystems targeting business process automation. Their primary battlefield is the intersection of digital engagement—Uber through user-facing mobility and delivery; Pegasystems via backend customer and sales automation. This contrast defines their investment profiles: Uber offers growth in consumer-driven network effects; Pegasystems delivers steady enterprise software innovation with automation at its core.
Income Statement Comparison
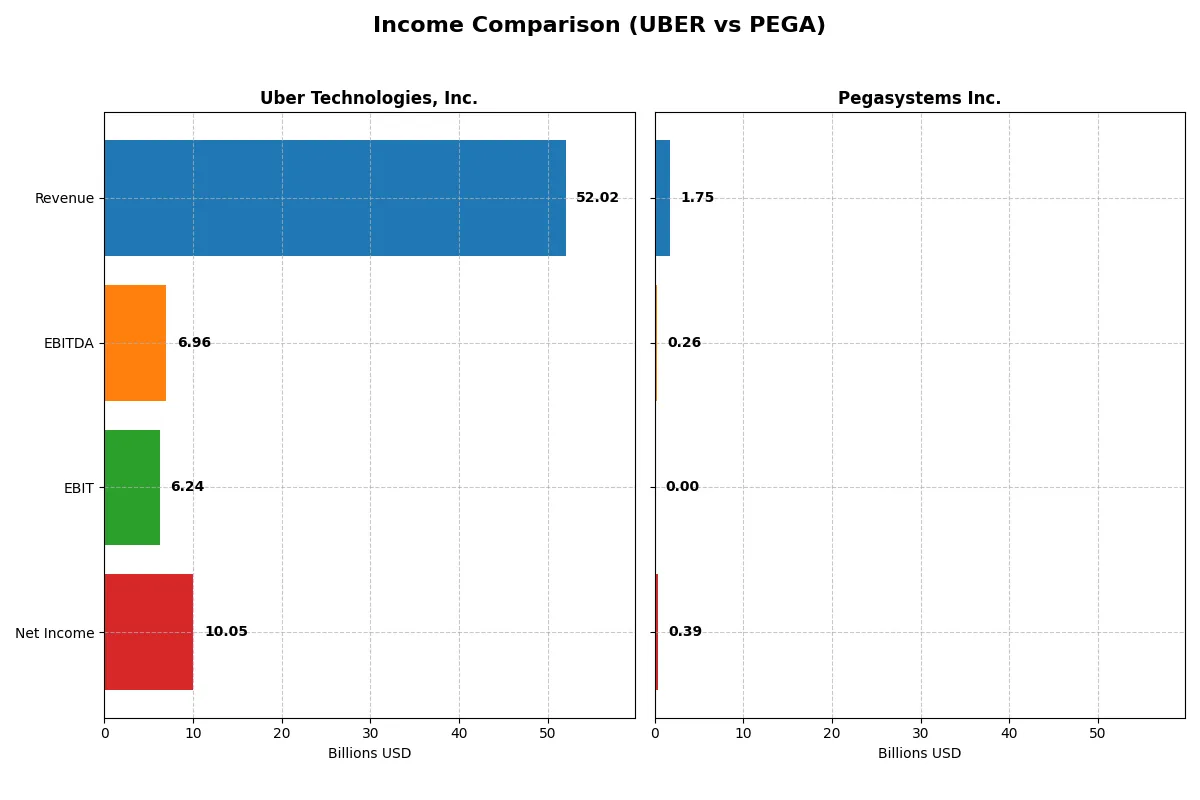
This data dissects the core profitability and scalability of both corporate engines to reveal who dominates the bottom line:
| Metric | Uber Technologies, Inc. (UBER) | Pegasystems Inc. (PEGA) |
|---|---|---|
| Revenue | 52B | 1.7B |
| Cost of Revenue | 31.3B | 421M |
| Operating Expenses | 15.1B | 1B |
| Gross Profit | 20.7B | 1.3B |
| EBITDA | 6.96B | 263M |
| EBIT | 6.24B | 0 |
| Interest Expense | 440M | -1.3M |
| Net Income | 10B | 393M |
| EPS | 4.82 | 2.3 |
| Fiscal Year | 2025 | 2025 |
Income Statement Analysis: The Bottom-Line Duel
This income statement comparison unveils how efficiently Uber and Pegasystems convert revenue into profit and growth momentum.
Uber Technologies, Inc. Analysis
Uber’s revenue surged from $17.5B in 2021 to $52B in 2025, with net income exploding from a $496M loss to $10B profit. Its gross margin holds steady near 40%, underpinning solid profitability. The 2025 fiscal year highlights robust operating efficiency, with an EBIT margin of 12% and nearly 20% net margin, reflecting strong momentum and disciplined cost control.
Pegasystems Inc. Analysis
Pegasystems grew revenue from $1.2B in 2021 to $1.7B in 2025, while net income rebounded sharply from a $63M loss to $393M profit. Its gross margin impresses at 76%, yet EBIT margin remains flat at zero, signaling limited operating leverage. The 2025 year shows solid top-line growth and net margin improvement to 22.5%, but operating income challenges temper enthusiasm.
Scale and Margin: Uber’s Dominance vs. Pegasystems’ Efficiency
Uber commands overwhelming revenue scale with high single-digit EBIT margin and accelerating profits, dwarfing Pegasystems’ smaller footprint. Pegasystems excels in gross margin and net margin percentage but lacks operating income growth. For investors, Uber’s high-growth, improving profitability profile offers a more compelling fundamental story than Pegasystems’ margin-centric but less scalable model.
Financial Ratios Comparison
These vital ratios act as a diagnostic tool to expose the underlying fiscal health, valuation premiums, and capital efficiency of the companies compared below:
| Ratios | Uber Technologies, Inc. (UBER) | Pegasystems Inc. (PEGA) |
|---|---|---|
| ROE | 37.18% | 49.97% |
| ROIC | 11.21% | 29.43% |
| P/E | 16.85 | 25.92 |
| P/B | 6.27 | 12.95 |
| Current Ratio | 1.14 | 1.33 |
| Quick Ratio | 1.14 | 1.33 |
| D/E (Debt-to-Equity) | 0.50 | 0.08 |
| Debt-to-Assets | 21.80% | 3.73% |
| Interest Coverage | 12.65 | -204.75 |
| Asset Turnover | 0.84 | 1.07 |
| Fixed Asset Turnover | 17.28 | 0 |
| Payout Ratio | 0 | 3.92% |
| Dividend Yield | 0 | 0.15% |
| Fiscal Year | 2025 | 2025 |
Efficiency & Valuation Duel: The Vital Signs
Financial ratios act as a company’s DNA, uncovering operational strengths and hidden risks crucial for investment decisions.
Uber Technologies, Inc.
Uber delivers strong profitability with a 37.18% ROE and a solid 19.33% net margin, signaling operational excellence. Its valuation is moderate, with a P/E of 16.85, suggesting the stock is fairly priced but its high P/B of 6.27 raises caution. Uber retains earnings to fuel growth, offering no dividends.
Pegasystems Inc.
Pegasystems excels in profitability, boasting a 49.97% ROE and a 22.54% net margin, reflecting efficiency. However, its valuation is stretched, with a high P/E of 25.92 and P/B of 12.95. Pegasystems pays a minimal dividend (0.15%) but mostly reinvests in R&D, supporting innovation-driven growth.
Balanced Profitability vs. Premium Pricing
Uber offers a balanced mix of strong returns and reasonable valuation, while Pegasystems shows superior profitability at a premium price. Investors seeking value with operational safety may favor Uber. Those targeting growth and can tolerate valuation risk might prefer Pegasystems.
Which one offers the Superior Shareholder Reward?
Uber Technologies, Inc. (UBER) does not pay dividends but aggressively reinvests free cash flow, maintaining a payout ratio of 0% and a robust buyback program. Pegasystems Inc. (PEGA) pays a modest dividend yield around 0.15%, with a payout ratio near 4%, supported by strong free cash flow. PEGA’s dividend is sustainable given its 100% free cash flow coverage, complemented by moderate buybacks. Uber’s zero dividend and high reinvestment signal growth focus, yet its buyback activity remains substantial for shareholder returns. I view PEGA’s balanced dividend and buyback mix as more sustainable and attractive for total return in 2026, particularly for income-focused investors. Uber suits growth-seekers willing to accept zero yield for capital appreciation. Overall, PEGA offers the superior shareholder reward combining yield and buyback stability.
Comparative Score Analysis: The Strategic Profile
The radar chart reveals the fundamental DNA and trade-offs of Uber Technologies, Inc. and Pegasystems Inc., highlighting their distinctive financial strengths and weaknesses:
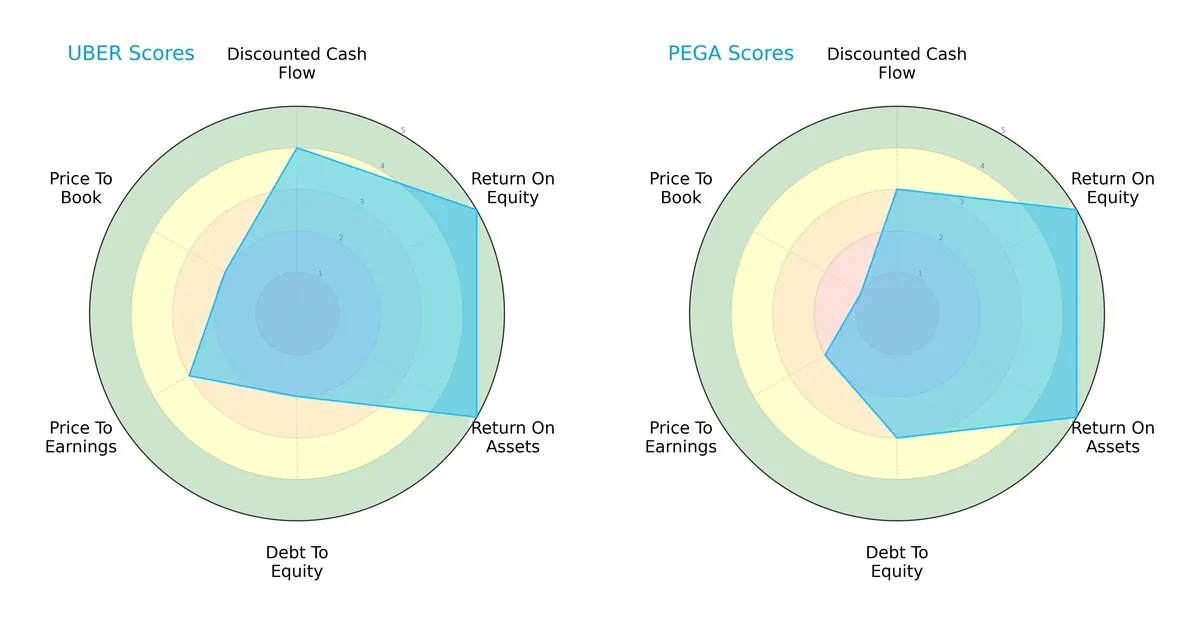
Uber shows a more balanced profile with strong DCF (4) and profitability metrics (ROE 5, ROA 5), but weaker leverage control (Debt/Equity 2) and valuation scores (PE 3, PB 2). Pegasystems relies on robust asset returns (ROE 5, ROA 5) but faces valuation headwinds with very low PE (2) and PB (1) scores and moderate leverage (Debt/Equity 3). Uber’s edge lies in better cash flow and valuation balance, while Pegasystems leans on operational efficiency but suffers valuation risk.
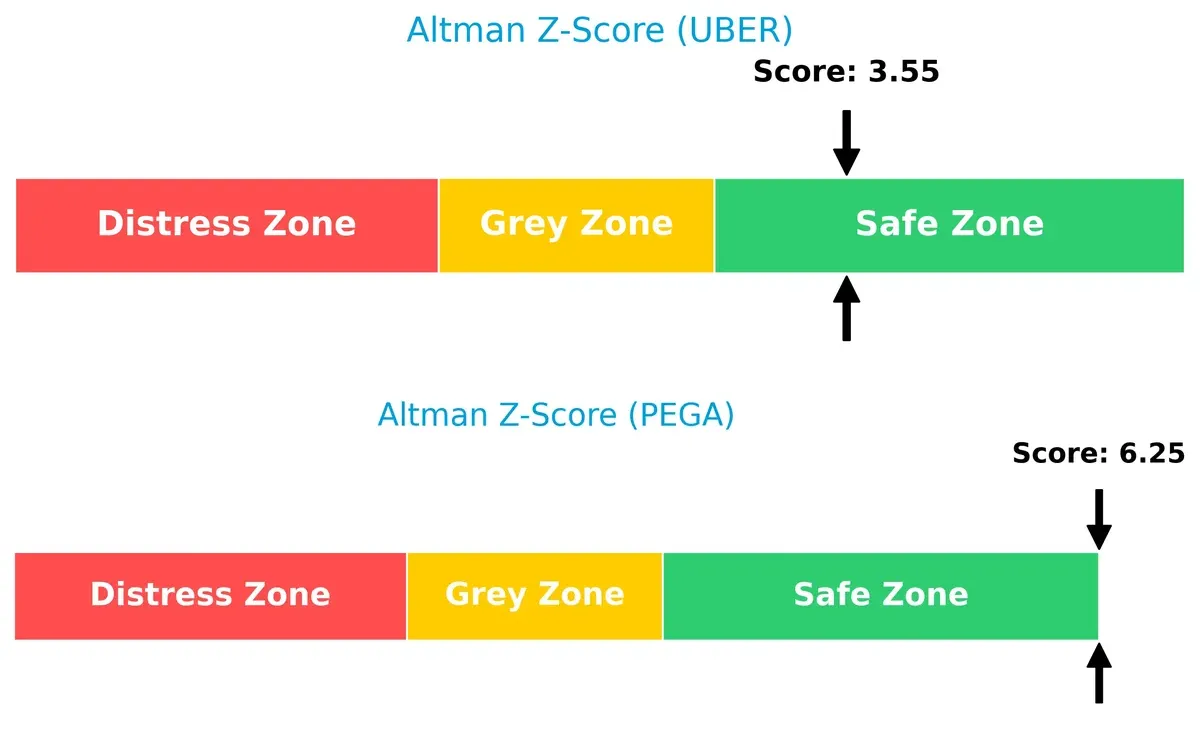
Bankruptcy Risk: Solvency Showdown
Uber’s Altman Z-Score of 3.55 versus Pegasystems’ 6.25 places both safely above distress thresholds, though Pegasystems exhibits a notably stronger buffer against bankruptcy risk in this cycle:
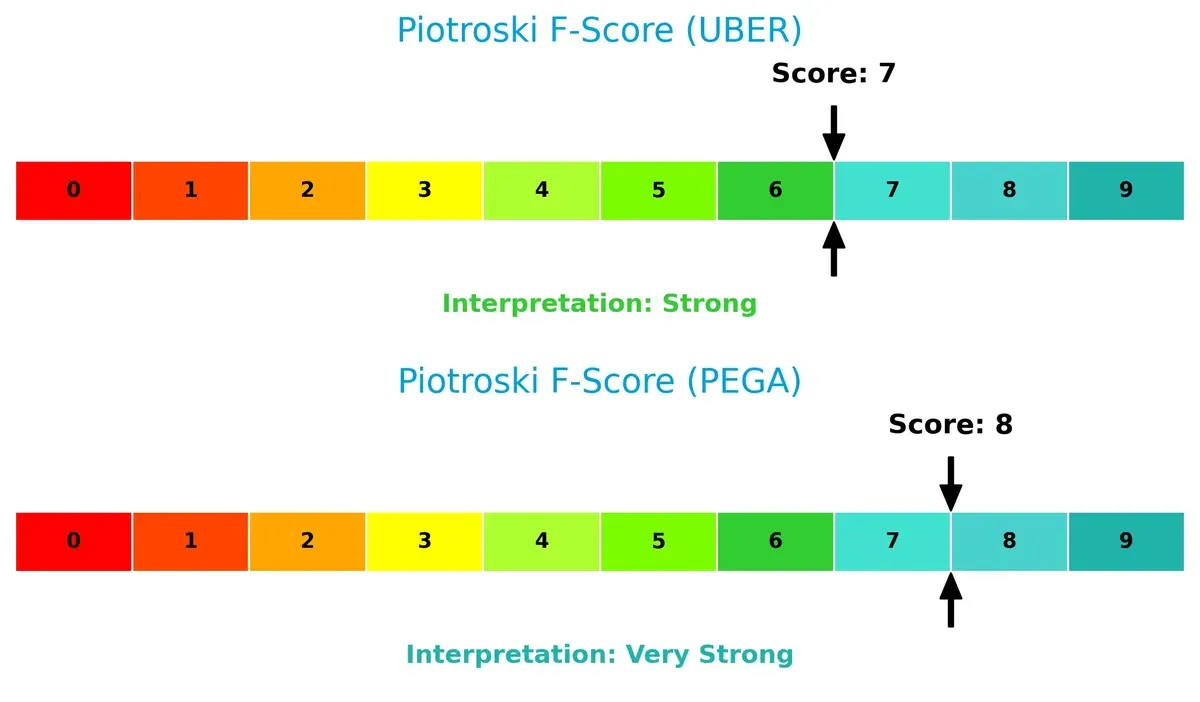
Financial Health: Quality of Operations
Pegasystems scores an 8 on the Piotroski F-Score, indicating very strong financial health. Uber, with a 7, remains strong but shows slightly weaker internal metrics relative to Pegasystems, suggesting fewer red flags but room for improvement in operational quality:
How are the two companies positioned?
This section dissects Uber and Pegasystems’ operational DNA by comparing their revenue distribution and internal dynamics. The goal is to confront their economic moats and identify the most resilient, sustainable competitive advantage today.
Revenue Segmentation: The Strategic Mix
This visual comparison dissects how Uber Technologies, Inc. and Pegasystems Inc. diversify their income streams and reveals their primary sector bets:
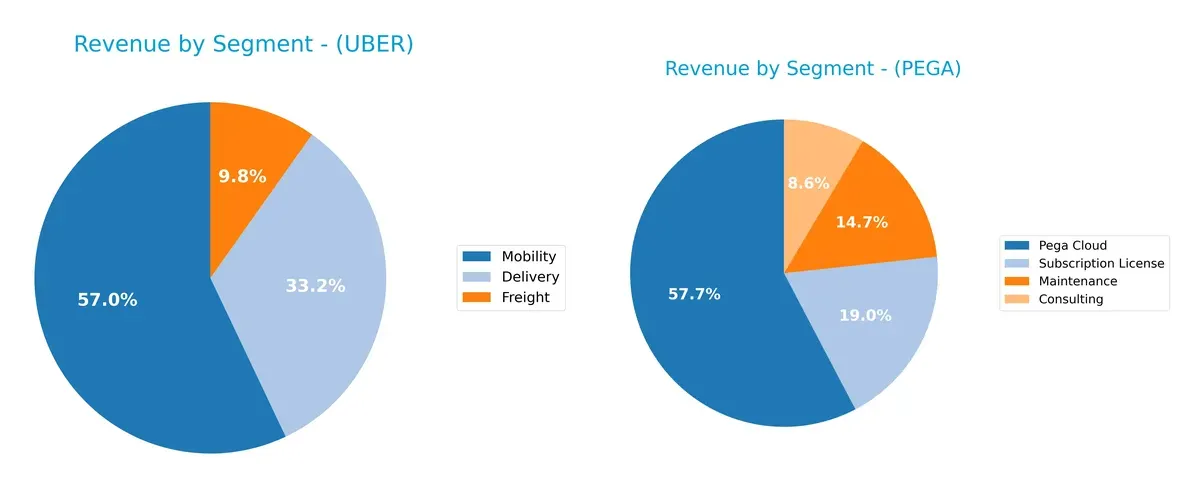
Uber’s revenue pivots heavily on Mobility, which dwarfs its Delivery and Freight segments at $29.7B versus $17.2B and $5.1B in 2025. This concentration signals strong dominance in ride-sharing but also heightens exposure to regulatory and competition risks. Pegasystems boasts a more diversified mix. Its Pega Cloud leads at $1.54B, supported by Subscription License ($507M) and Maintenance ($393M). This balanced portfolio anchors recurring revenue and reduces volatility, reflecting a strategic bet on SaaS and consulting services.
Strengths and Weaknesses Comparison
This table compares the Strengths and Weaknesses of Uber Technologies, Inc. and Pegasystems Inc.:
Uber Strengths
- Diversified revenue streams with strong Mobility and Delivery segments
- Favorable profitability metrics: net margin 19.33%, ROE 37.18%, ROIC 11.21%
- Solid financial health with low debt-to-assets 21.8% and high interest coverage 14.18
- Global presence spanning US, EMEA, Asia Pacific, and Latin America
- High fixed asset turnover 17.28 indicating efficient asset use
Pega Strengths
- Strong profitability with net margin 22.54%, ROE 49.97%, ROIC 29.43%
- Low leverage with debt-to-assets 3.73% and good current and quick ratios
- Revenue concentrated in Pega Cloud and Subscription License segments
- Established presence in US, EMEA, Asia Pacific, and Americas
- Favorable asset turnover 1.07 reflecting effective capital use
Uber Weaknesses
- Unfavorable price-to-book ratio 6.27 indicating potential overvaluation
- Neutral current ratio 1.14 suggests moderate liquidity risk
- No dividend yield limits income for shareholders
- Moderate WACC at 8.78% could pressure returns
- Revenue heavily reliant on North America
- Lower PE ratio 16.85 compared to Pega may indicate slower growth expectations
Pega Weaknesses
- Unfavorable price-to-earnings 25.92 and price-to-book 12.95 ratios suggest high valuation
- Negative interest coverage raises concerns over debt servicing
- Zero fixed asset turnover reflects possible asset underutilization
- Minimal dividend yield 0.15% offers limited shareholder return
- Revenue less diversified, with dependency on cloud services
Both companies show strong profitability and global reach but face valuation and liquidity challenges. Uber’s diversified revenue and asset efficiency contrast with Pega’s higher profitability yet weaker debt service metrics. These factors will influence strategic priorities around capital allocation and growth focus.
The Moat Duel: Analyzing Competitive Defensibility
A structural moat is the only true shield protecting long-term profits from relentless competitive erosion. Let’s dissect how Uber and Pegasystems defend their turf:
Uber Technologies, Inc.: Network Effects Powerhouse
Uber’s moat stems from powerful network effects linking millions of drivers and riders globally. This manifests in improving ROIC at 2.4% above WACC and steady margin stability. Expansion in freight and delivery markets in 2026 could deepen its competitive advantage.
Pegasystems Inc.: Intangible Assets and Platform Lock-in
Pegasystems relies on intangible assets—its proprietary software platform and customer engagement tools. Its ROIC outpaces WACC by a striking 20.8%, signaling superior capital efficiency. Continued innovation in digital process automation promises to fortify its moat further.
Verdict: Network Effects vs. Intangible Platform Dominance
Pegasystems holds a wider and deeper moat with a ROIC advantage nearly ninefold greater than Uber’s. While Uber’s broad network creates scale, Pegasystems’ platform lock-in delivers stronger, more sustainable value creation. Pegasystems stands better poised to defend and grow market share in 2026.
Which stock offers better returns?
Over the past year, Uber Technologies, Inc. and Pegasystems Inc. exhibited contrasting price movements, with Uber declining steadily while Pegasystems showed strong gains despite recent pullbacks.
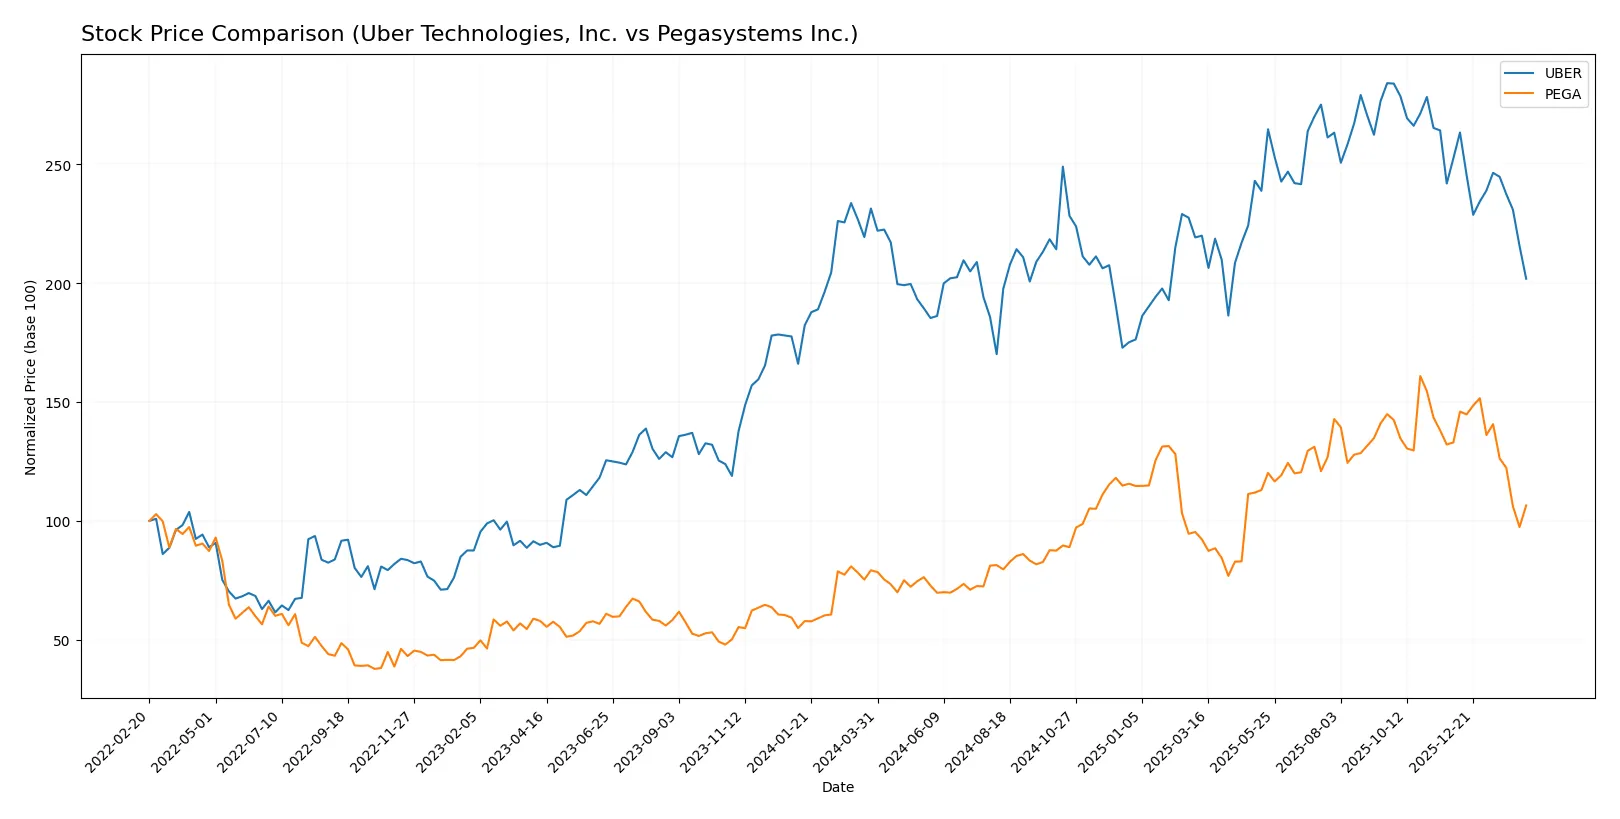
Trend Comparison
Uber Technologies, Inc. stock fell 12.76% over the past 12 months, marking a bearish trend with decelerating momentum. The price ranged from a high of 98.51 to a low of 58.99, showing significant volatility.
Pegasystems Inc. rose 34.39% over the same period, indicating a bullish trend with deceleration. The stock’s price fluctuated between 28.73 and 66.27, reflecting high volatility but positive market performance.
Comparing the two, Pegasystems delivered superior returns with a clear bullish trajectory, while Uber underperformed with a bearish trend and decelerating price decline.
Target Prices
Analysts present a moderately bullish consensus for Uber Technologies and Pegasystems, indicating upside potential from current prices.
| Company | Target Low | Target High | Consensus |
|---|---|---|---|
| Uber Technologies, Inc. | 72 | 140 | 105.76 |
| Pegasystems Inc. | 48 | 65 | 58.25 |
Uber’s consensus target sits roughly 51% above its current price of $69.99, signaling strong growth expectations. Pegasystems’ consensus target exceeds the current price of $43.85 by about 33%, reflecting solid analyst confidence.

Don’t Let Luck Decide Your Entry Point
Optimize your entry points with our advanced ProRealTime indicators. You’ll get efficient buy signals with precise price targets for maximum performance. Start outperforming now!
How do institutions grade them?
Here is a summary of recent institutional grades for Uber Technologies, Inc. and Pegasystems Inc.:
Uber Technologies, Inc. Grades
The following table shows the latest grades assigned to Uber by various reputable institutions.
| Grading Company | Action | New Grade | Date |
|---|---|---|---|
| Citigroup | Maintain | Buy | 2026-02-06 |
| Morgan Stanley | Maintain | Overweight | 2026-02-05 |
| Wedbush | Maintain | Neutral | 2026-02-05 |
| Benchmark | Maintain | Hold | 2026-02-05 |
| JP Morgan | Maintain | Overweight | 2026-02-05 |
| Citizens | Upgrade | Market Outperform | 2026-02-05 |
| RBC Capital | Maintain | Outperform | 2026-02-05 |
| Wells Fargo | Maintain | Overweight | 2026-02-05 |
| Mizuho | Maintain | Outperform | 2026-02-05 |
| Needham | Maintain | Buy | 2026-02-05 |
Pegasystems Inc. Grades
Below is the latest set of grades for Pegasystems from reliable financial institutions.
| Grading Company | Action | New Grade | Date |
|---|---|---|---|
| Rosenblatt | Maintain | Buy | 2026-02-12 |
| RBC Capital | Maintain | Outperform | 2026-02-12 |
| Citizens | Maintain | Market Outperform | 2026-02-12 |
| Barclays | Upgrade | Overweight | 2026-02-12 |
| Wedbush | Maintain | Outperform | 2026-02-12 |
| Citigroup | Maintain | Buy | 2026-02-12 |
| Rosenblatt | Maintain | Buy | 2026-02-06 |
| JP Morgan | Maintain | Overweight | 2025-12-05 |
| RBC Capital | Maintain | Outperform | 2025-10-23 |
| Wedbush | Maintain | Outperform | 2025-10-23 |
Which company has the best grades?
Both Uber and Pegasystems receive predominantly positive grades from respected institutions. Pegasystems shows a consistent “Outperform” and “Buy” trend with a recent upgrade by Barclays. Uber has a broader range of grades from “Hold” to “Buy,” but maintains strong “Overweight” and “Outperform” support. Investors may interpret Pegasystems’ more uniformly optimistic grades as a signal of steadier institutional confidence relative to Uber’s mixed signals.
Risks specific to each company
The following categories identify critical pressure points and systemic threats facing Uber Technologies, Inc. and Pegasystems Inc. in the 2026 market environment:
1. Market & Competition
Uber Technologies, Inc.
- Faces intense competition in global ridesharing and delivery sectors with pressure on pricing and market share.
Pegasystems Inc.
- Competes in enterprise software with strong incumbents; must innovate constantly to maintain client base.
2. Capital Structure & Debt
Uber Technologies, Inc.
- Moderate leverage (D/E 0.5), favorable interest coverage (14.18), manageable debt-to-assets (21.8%).
Pegasystems Inc.
- Low leverage (D/E 0.08), but unfavorable interest coverage near zero signals risk in servicing debt.
3. Stock Volatility
Uber Technologies, Inc.
- Beta of 1.206 suggests above-market volatility, reflecting sector cyclicality and operational risks.
Pegasystems Inc.
- Lower beta at 1.07 indicates moderate volatility, more stable relative to tech peers.
4. Regulatory & Legal
Uber Technologies, Inc.
- Faces regulatory scrutiny on gig-worker classification and data privacy across multiple jurisdictions.
Pegasystems Inc.
- Subject to software compliance and data security regulations; litigation risk lower but present.
5. Supply Chain & Operations
Uber Technologies, Inc.
- Operational risk from driver availability and logistics complexity; sensitive to regional disruptions.
Pegasystems Inc.
- Dependent on cloud infrastructure and software delivery; supply chain risks relate to tech partnerships.
6. ESG & Climate Transition
Uber Technologies, Inc.
- Exposure to climate transition via vehicle emissions; initiatives underway but regulatory pressure grows.
Pegasystems Inc.
- ESG risks moderate; focus on sustainable software solutions but indirect environmental impact.
7. Geopolitical Exposure
Uber Technologies, Inc.
- Global footprint exposes it to geopolitical tensions affecting operations in Latin America, Asia, Europe.
Pegasystems Inc.
- More concentrated in developed markets; geopolitical risk lower but not negligible due to global clients.
Which company shows a better risk-adjusted profile?
Uber’s primary risk lies in regulatory and operational complexity amid global competition. Pegasystems faces financial strain from weak interest coverage and valuation concerns. Despite Uber’s higher market volatility, it maintains stronger debt servicing and operational scale. Pegasystems’ very strong Piotroski score and safe Altman Z-score contrast with its unfavorable interest coverage. Overall, Uber offers a better risk-adjusted profile, supported by robust profitability and debt metrics in 2025.
Final Verdict: Which stock to choose?
Uber Technologies, Inc. excels as a cash machine, efficiently converting invested capital into growing profits with a very favorable moat. Its point of vigilance lies in a relatively high price-to-book ratio, which could pressure valuations. Uber fits best in portfolios targeting aggressive growth with some tolerance for valuation risk.
Pegasystems Inc. commands a strategic moat through robust recurring revenue and impressive return on invested capital far exceeding its cost of capital. It offers better financial stability than Uber but trades at a premium with less margin for error. Pegasystems suits growth-at-a-reasonable-price (GARP) investors who prioritize durable profitability.
If you prioritize aggressive growth and capital efficiency, Uber is the compelling choice due to its expanding profitability and strong income statement momentum. However, if you seek stability and a premium moat with recurring revenue safety, Pegasystems offers better stability despite higher valuation multiples. Both present analytical scenarios tailored to distinct investor profiles.
Disclaimer: Investment carries a risk of loss of initial capital. The past performance is not a reliable indicator of future results. Be sure to understand risks before making an investment decision.
Go Further
I encourage you to read the complete analyses of Uber Technologies, Inc. and Pegasystems Inc. to enhance your investment decisions: