Home > Comparison > Technology > TYL vs PEGA
The strategic rivalry between Tyler Technologies, Inc. and Pegasystems Inc. shapes the evolving landscape of the technology sector. Tyler operates as a capital-intensive provider of integrated public sector software, while Pegasystems focuses on high-margin enterprise software solutions emphasizing customer engagement and automation. This analysis pits Tyler’s government-centric model against Pegasystems’ broader digital transformation approach to identify which offers superior risk-adjusted returns for a diversified portfolio.
Table of contents
Companies Overview
Tyler Technologies and Pegasystems stand as key players in the enterprise software market, shaping public sector and customer engagement solutions.
Tyler Technologies, Inc.: Public Sector Software Leader
Tyler Technologies dominates public sector software with integrated management solutions. Its core revenue stems from modular applications for government agencies, including financial management, court systems, and public safety. In 2026, Tyler deepened its strategic collaboration with Amazon Web Services, enhancing its cloud hosting capabilities for scalable and secure service delivery.
Pegasystems Inc.: Customer Engagement Innovator
Pegasystems excels in customer engagement and digital process automation software. Its revenue engine revolves around platforms like Pega Infinity and Customer Decision Hub, automating sales and service processes for diverse industries. The company’s 2026 focus sharpens on expanding Pega Cloud and intelligent automation to boost client productivity and multi-channel customer experiences.
Strategic Collision: Similarities & Divergences
Both companies excel in application software but diverge in focus: Tyler builds a closed ecosystem tailored to public agencies, while Pegasystems offers an open, cross-industry platform. Their primary battleground lies in digital process automation, aiming to optimize operational efficiency. Investors should note Tyler’s stable government market versus Pegasystems’ scalable, innovation-driven growth profile.
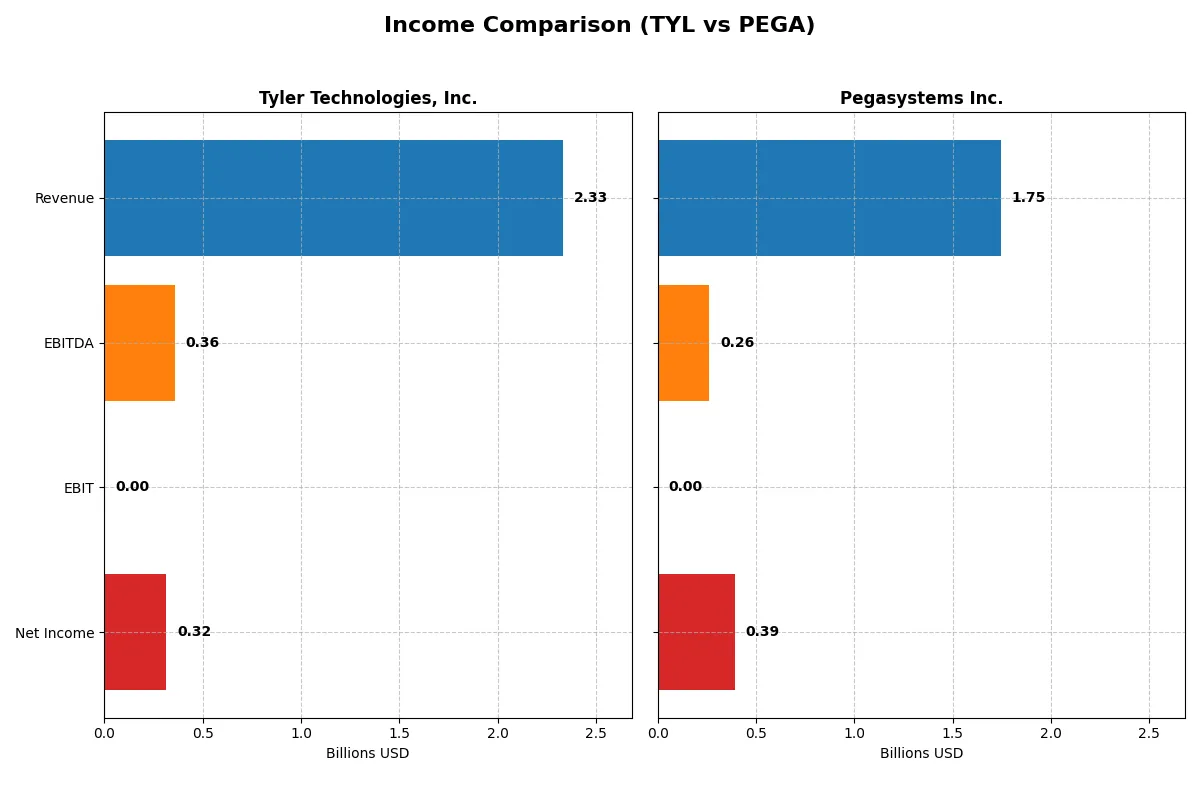
Income Statement Comparison
The following data dissects the core profitability and scalability of both corporate engines to reveal who dominates the bottom line:
| Metric | Tyler Technologies, Inc. (TYL) | Pegasystems Inc. (PEGA) |
|---|---|---|
| Revenue | 2.33B | 1.75B |
| Cost of Revenue | 1.25B | 421M |
| Operating Expenses | 670M | 1.04B |
| Gross Profit | 1.08B | 1.32B |
| EBITDA | 358M | 263M |
| EBIT | 0 | 0 |
| Interest Expense | -5M | -1.3M |
| Net Income | 316M | 393M |
| EPS | 7.32 | 2.3 |
| Fiscal Year | 2025 | 2025 |
Income Statement Analysis: The Bottom-Line Duel
This income statement comparison reveals which company executes its business model more efficiently and delivers superior profitability.
Tyler Technologies, Inc. Analysis
Tyler Technologies’ revenue grew steadily from 1.59B in 2021 to 2.33B in 2025, with net income nearly doubling from 161M to 316M. Its gross margin holds firm at 46.5%, reflecting stable cost control. The net margin improved to 13.5%, showing solid bottom-line momentum despite a one-year dip in EBIT growth.
Pegasystems Inc. Analysis
Pegasystems expanded revenue from 1.21B in 2021 to 1.75B in 2025, with net income surging over sevenfold to 393M. Its gross margin impresses at 75.9%, highlighting superior cost efficiency. The net margin doubled to 22.5%, fueled by robust revenue and margin expansion, although EBIT growth faltered last year.
Margin Power vs. Revenue Scale
Pegasystems leads with higher margins and explosive net income growth, demonstrating superior operational leverage. Tyler shows consistent revenue gains and margin stability but lags in net income expansion. For investors prioritizing margin strength and rapid profitability gains, Pegasystems offers the more attractive profile.
Financial Ratios Comparison
These vital ratios act as a diagnostic tool to expose the underlying fiscal health, valuation premiums, and capital efficiency of the companies compared:
| Ratios | Tyler Technologies (TYL) | Pegasystems (PEGA) |
|---|---|---|
| ROE | 7.8% | 50.0% |
| ROIC | 6.2% | 29.4% |
| P/E | 93.4x | 25.9x |
| P/B | 7.25x | 12.95x |
| Current Ratio | 1.35 | 1.33 |
| Quick Ratio | 1.35 | 1.33 |
| D/E | 0.19 | 0.08 |
| Debt-to-Assets | 12.3% | 3.7% |
| Interest Coverage | 50.5x | -204.7x |
| Asset Turnover | N/A | 1.07 |
| Fixed Asset Turnover | N/A | 0 |
| Payout ratio | 0% | 3.9% |
| Dividend yield | 0% | 0.15% |
| Fiscal Year | 2025 | 2025 |
Efficiency & Valuation Duel: The Vital Signs
Financial ratios act as a company’s DNA, exposing hidden risks and operational strengths that shape investor decisions.
Tyler Technologies, Inc.
Tyler Technologies displays a solid net margin of 13.53%, but its zero ROE and ROIC signal weak profitability. The stock trades at a stretched P/E of 61.99, suggesting high valuation risk. The absence of dividends points to reinvestment in R&D and growth initiatives, though overall ratio health remains unfavorable.
Pegasystems Inc.
Pegasystems boasts a robust 22.54% net margin and an impressive 49.97% ROE, reflecting strong profitability. Its P/E of 25.92 is moderate, yet the elevated P/B of 12.95 raises valuation concerns. The company offers a modest 0.15% dividend yield, balancing shareholder returns with ongoing growth investments.
Premium Valuation vs. Operational Safety
Pegasystems provides superior profitability with a more balanced valuation, while Tyler Technologies shows weaker returns despite high valuation multiples. Pegasystems suits investors prioritizing operational efficiency; Tyler fits those betting on reinvestment and long-term growth amid valuation risks.
Which one offers the Superior Shareholder Reward?
I see Tyler Technologies (TYL) pays no dividends but converts nearly 97% of operating cash flow into free cash flow, fueling robust buybacks. Pegasystems (PEGA) offers a modest 0.15% dividend yield, with a payout ratio near 4%, complemented by steady buybacks. Tyler’s aggressive buyback, zero dividend, and strong free cash flow generation suggest a more sustainable, shareholder-friendly capital allocation model. PEGA’s dividends add some income but its high leverage and lower free cash flow yield limit long-term reward. I conclude Tyler Technologies offers the superior total return profile for 2026 investors.
Comparative Score Analysis: The Strategic Profile
The radar chart reveals the fundamental DNA and trade-offs of Tyler Technologies and Pegasystems Inc., highlighting their core financial strengths and weaknesses:
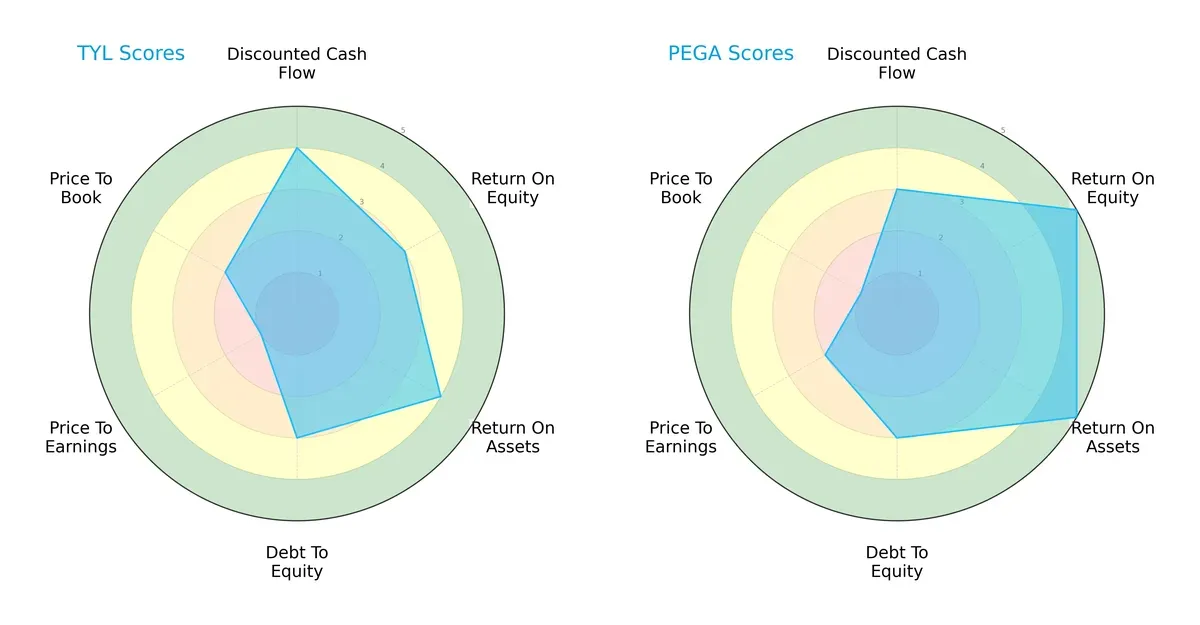
Tyler Technologies shows strength in discounted cash flow (4) and return on assets (4), but weak valuation metrics, especially price-to-earnings (1) and price-to-book (2). Pegasystems excels in profitability with top scores in ROE (5) and ROA (5), yet suffers from poor valuation scores, notably price-to-book (1). Tyler offers a more balanced risk profile, while Pegasystems relies heavily on operational efficiency to justify its premium.
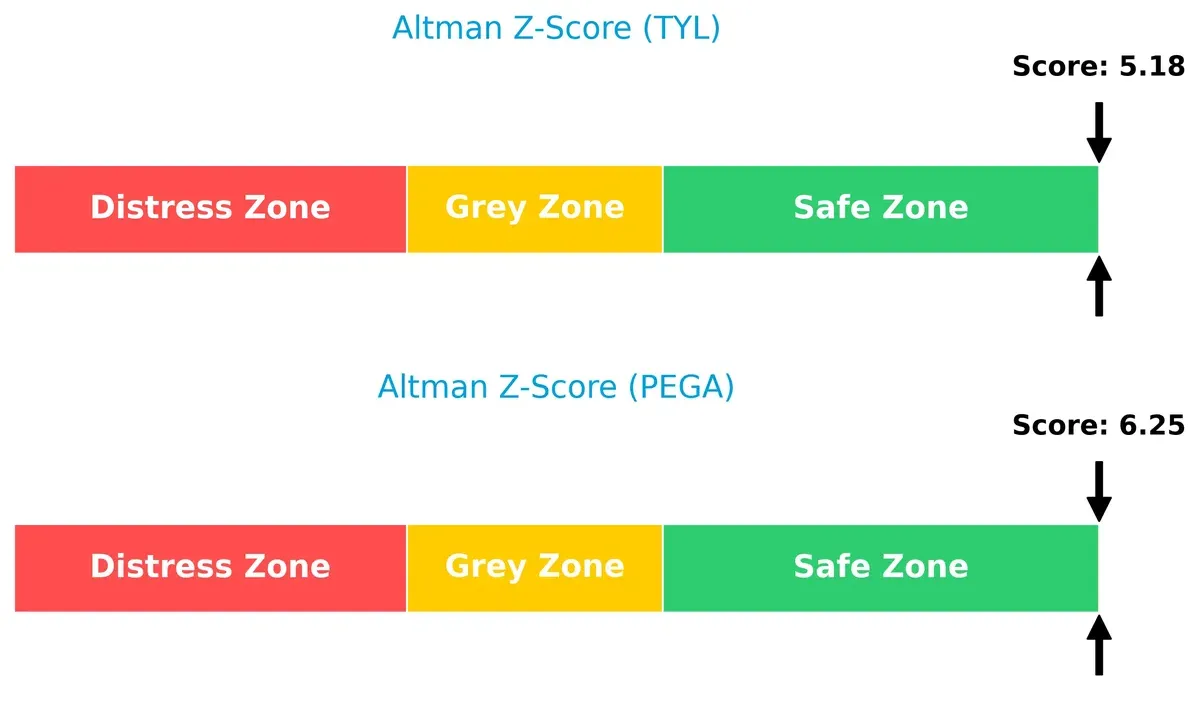
Bankruptcy Risk: Solvency Showdown
Pegasystems outperforms Tyler with a higher Altman Z-Score (6.25 vs. 5.18), both comfortably in the safe zone, signaling a lower bankruptcy risk and robust resilience in this market cycle:
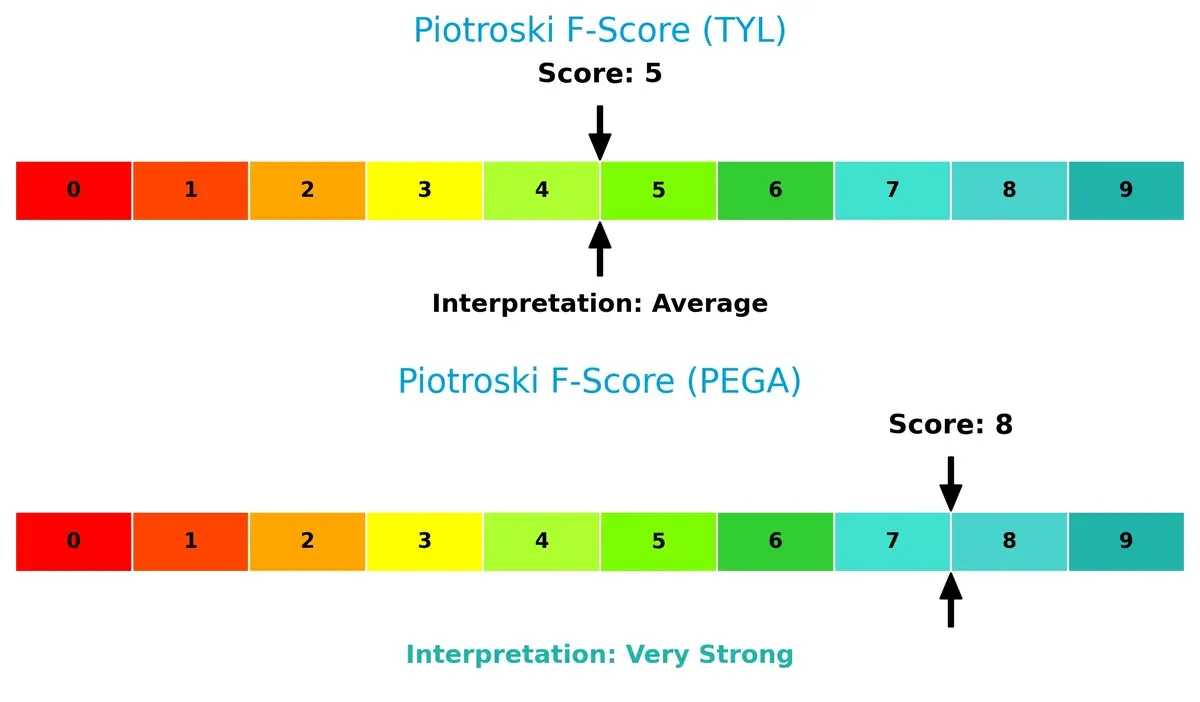
Financial Health: Quality of Operations
Pegasystems leads with a Piotroski F-Score of 8, indicating very strong financial health. Tyler’s score of 5 suggests average operational quality and potential red flags in internal metrics:
How are the two companies positioned?
This section dissects the operational DNA of Tyler Technologies and Pegasystems by comparing their revenue distribution and internal strengths and weaknesses. The goal is to confront their economic moats and identify which business model offers the most resilient, sustainable competitive advantage today.
Revenue Segmentation: The Strategic Mix
The following visual comparison dissects how Tyler Technologies and Pegasystems diversify their income streams and where their primary sector bets lie:
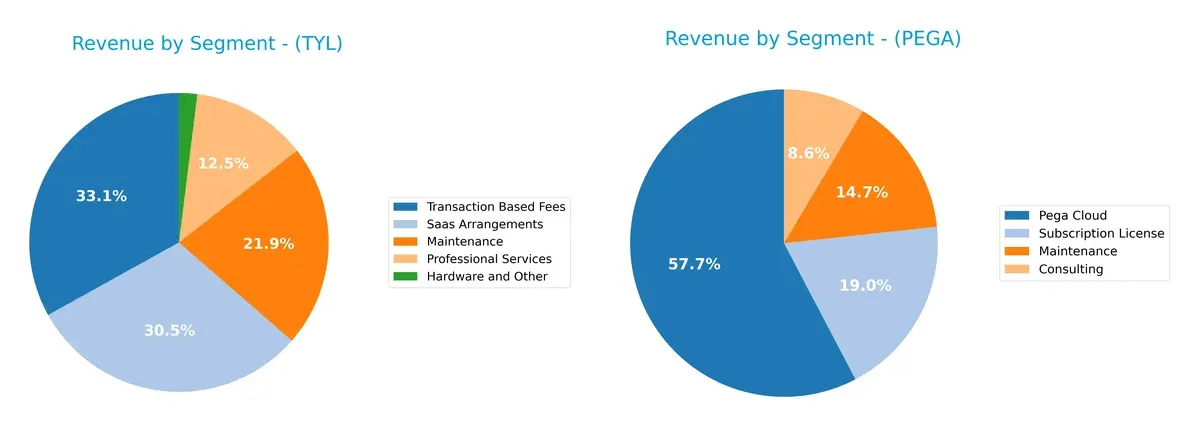
Tyler Technologies anchors revenue in Transaction Based Fees ($698M) and SaaS Arrangements ($645M), complemented by Maintenance ($463M) and Professional Services ($264M). This mix signals a strong ecosystem lock-in via recurring fees. Pegasystems dwarfs others with Pega Cloud ($1.54B) and Subscription License ($507M), supported by Maintenance ($393M) and Consulting ($228M). Pegasystems’ heavier cloud focus shows infrastructure dominance but raises concentration risk on platform reliance. Tyler’s mix feels more balanced.
Strengths and Weaknesses Comparison
This table compares the Strengths and Weaknesses of Tyler Technologies and Pegasystems based on diversification, profitability, financials, innovation, global presence, and market share:
Tyler Technologies Strengths
- Diverse product segments including SaaS, transaction fees, and maintenance
- Favorable net margin at 13.53%
- Strong balance sheet with low debt and debt-to-assets at 0%
- Established enterprise software revenue stream
Pegasystems Strengths
- Higher net margin at 22.54% and strong ROE at 49.97%
- Favorable ROIC at 29.43%, indicating efficient capital use
- Global presence across Americas, EMEA, and Asia Pacific
- Diversified revenue from cloud, consulting, and subscription licenses
Tyler Technologies Weaknesses
- Unfavorable ROE and ROIC at 0%
- Weak liquidity ratios, current and quick ratios at 0
- High P/E ratio at 61.99, potentially overvalued
- Negative interest coverage and low asset turnover
Pegasystems Weaknesses
- Unfavorable P/E and P/B ratios suggest valuation concerns
- Negative interest coverage despite favorable profitability
- Fixed asset turnover is unfavorable
- Dividend yield is minimal at 0.15%
Tyler Technologies shows strength in product diversification and a conservative balance sheet but faces profitability and liquidity challenges. Pegasystems benefits from robust profitability and global reach but must address valuation and asset efficiency issues. Both companies reveal contrasting profiles that influence their strategic focus.
The Moat Duel: Analyzing Competitive Defensibility
A structural moat is the only true shield preserving long-term profits from relentless competition erosion. Let’s dissect the battle of moats between two software firms:
Tyler Technologies, Inc.: Intangible Assets Fortress
Tyler relies on deep public sector integration and specialized software, creating high switching costs. Its stable net margins reflect this moat, but declining ROIC signals caution. Expansion into judicial and public safety markets could reinforce or strain this advantage in 2026.
Pegasystems Inc.: Scalable Platform Network Effects
Pegasystems leverages a unified customer engagement platform, generating network effects and high gross margins near 76%. Its expanding global footprint fuels strong revenue growth and a rising ROIC trend, deepening its moat with cloud and AI-driven automation in 2026.
Integration Depth vs. Platform Scale: The Moat Face-off
Pegasystems commands a wider and deeper moat, demonstrated by a robust 21% ROIC premium over WACC and accelerating profitability. Tyler’s intangible asset moat is solid but weakened by declining capital efficiency. Pegasystems is better positioned to defend and expand market share in a competitive software landscape.
Which stock offers better returns?
Over the past 12 months, Tyler Technologies, Inc. and Pegasystems Inc. showed contrasting price movements and trading dynamics, reflecting divergent investor sentiment and market momentum.
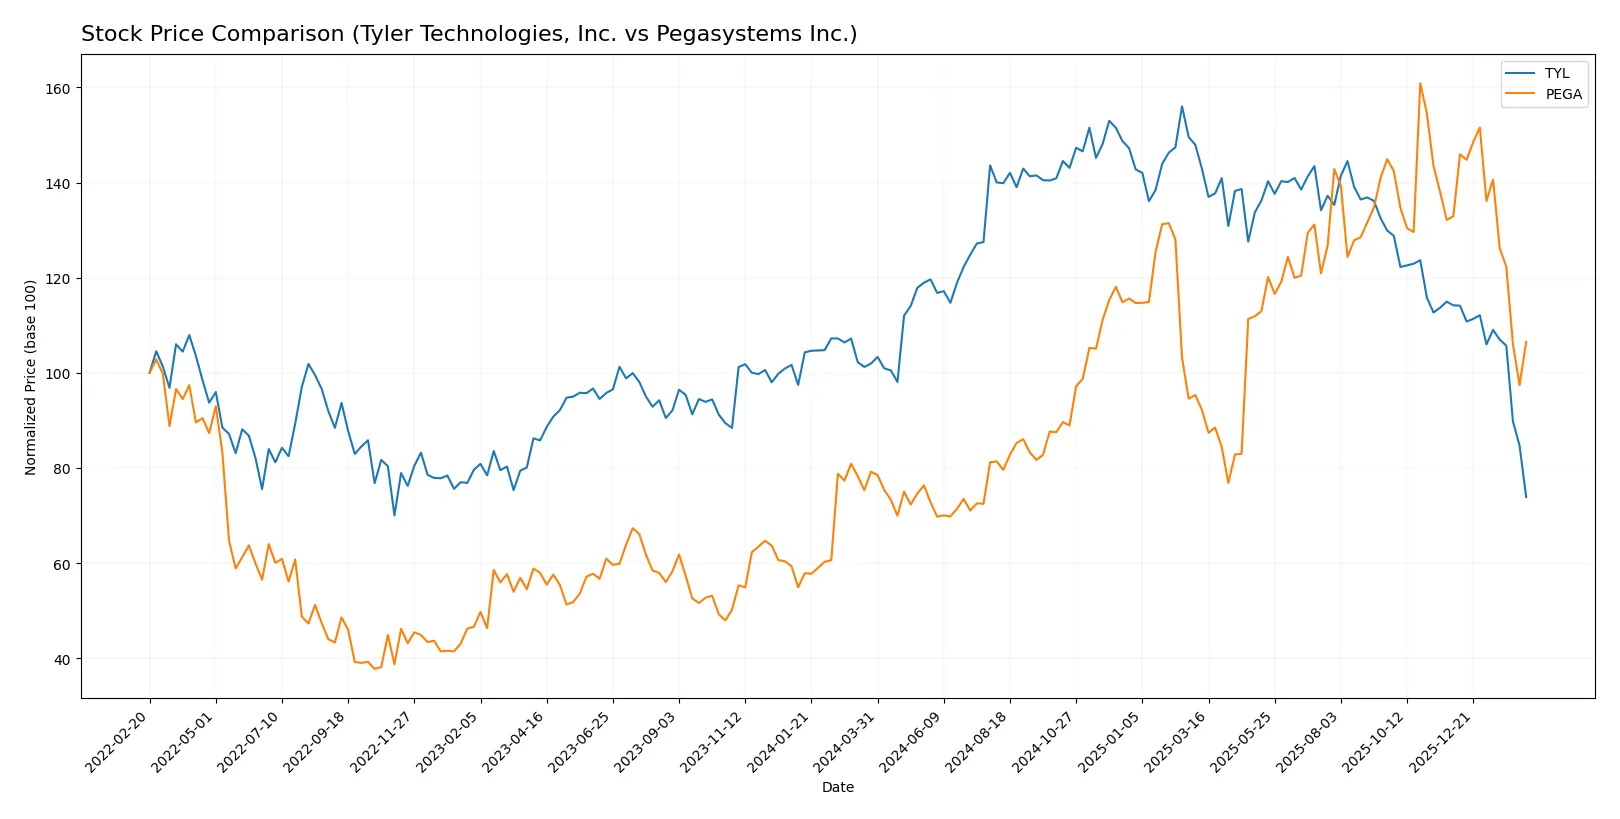
Trend Comparison
Tyler Technologies’ stock declined 27.51% over the past year, establishing a bearish trend with decelerating losses. Its price ranged between 304 and 642, showing high volatility with a 68.01 standard deviation.
Pegasystems stock rose 34.39% over the same period, confirming a bullish trend despite a recent deceleration. Price fluctuations were narrower, between 29 and 66, with a lower volatility of 10.53 standard deviation.
Comparing both, Pegasystems delivered stronger market performance over 12 months. Tyler experienced significant losses and higher volatility, while Pegasystems achieved steady gains with more balanced trading activity.
Target Prices
Analysts present a broad but optimistic target price range for Tyler Technologies and Pegasystems.
| Company | Target Low | Target High | Consensus |
|---|---|---|---|
| Tyler Technologies, Inc. | 325 | 675 | 473.91 |
| Pegasystems Inc. | 48 | 65 | 58.25 |
Tyler’s consensus target at 474 implies a 56% upside from its 304 current price, signaling strong growth expectations. Pegasystems’ 58 consensus target suggests a 33% premium over the 44 current price, reflecting solid investor confidence.

Don’t Let Luck Decide Your Entry Point
Optimize your entry points with our advanced ProRealTime indicators. You’ll get efficient buy signals with precise price targets for maximum performance. Start outperforming now!
How do institutions grade them?
The following tables summarize recent institutional grades for Tyler Technologies, Inc. and Pegasystems Inc.:
Tyler Technologies, Inc. Grades
The table below shows current and previous grades from key rating firms for Tyler Technologies, Inc.:
| Grading Company | Action | New Grade | Date |
|---|---|---|---|
| Oppenheimer | Maintain | Outperform | 2026-02-13 |
| Piper Sandler | Maintain | Overweight | 2026-02-13 |
| Needham | Maintain | Buy | 2026-02-13 |
| TD Cowen | Maintain | Buy | 2026-02-13 |
| Evercore ISI Group | Maintain | In Line | 2026-02-13 |
| Wells Fargo | Maintain | Equal Weight | 2026-02-13 |
| Barclays | Maintain | Overweight | 2026-02-13 |
| Stifel | Maintain | Buy | 2026-02-13 |
| DA Davidson | Upgrade | Buy | 2026-02-11 |
| BTIG | Maintain | Buy | 2026-02-09 |
Pegasystems Inc. Grades
The table below shows current and previous grades from key rating firms for Pegasystems Inc.:
| Grading Company | Action | New Grade | Date |
|---|---|---|---|
| Rosenblatt | Maintain | Buy | 2026-02-12 |
| RBC Capital | Maintain | Outperform | 2026-02-12 |
| Citizens | Maintain | Market Outperform | 2026-02-12 |
| Barclays | Upgrade | Overweight | 2026-02-12 |
| Wedbush | Maintain | Outperform | 2026-02-12 |
| Citigroup | Maintain | Buy | 2026-02-12 |
| Rosenblatt | Maintain | Buy | 2026-02-06 |
| JP Morgan | Maintain | Overweight | 2025-12-05 |
| RBC Capital | Maintain | Outperform | 2025-10-23 |
| Wedbush | Maintain | Outperform | 2025-10-23 |
Which company has the best grades?
Both companies receive predominantly positive ratings, but Tyler Technologies shows a stronger consensus of “Buy” and “Outperform” grades, including a recent upgrade. Pegasystems also has solid “Outperform” and “Buy” grades, with a recent upgrade by Barclays. Investors may interpret Tyler’s consistent buy-side momentum as a sign of strong institutional confidence.
Risks specific to each company
The following categories identify the critical pressure points and systemic threats facing both firms in the 2026 market environment:
1. Market & Competition
Tyler Technologies, Inc.
- Operates mainly in public sector software with stable demand but faces limited growth in highly competitive niche markets.
Pegasystems Inc.
- Focuses on enterprise software across multiple sectors, facing intense competition from large cloud and automation providers.
2. Capital Structure & Debt
Tyler Technologies, Inc.
- Shows a conservative debt profile with favorable debt-to-equity metrics but weak liquidity ratios, posing short-term risk.
Pegasystems Inc.
- Maintains low debt levels and moderate current and quick ratios, reflecting balanced financial flexibility.
3. Stock Volatility
Tyler Technologies, Inc.
- Exhibits below-market beta (0.9), implying lower price fluctuations relative to the tech sector benchmark.
Pegasystems Inc.
- Displays higher beta (1.07), indicating greater stock volatility consistent with growth-oriented tech peers.
4. Regulatory & Legal
Tyler Technologies, Inc.
- Faces regulatory scrutiny typical for public sector software providers, including data privacy and government contracting compliance.
Pegasystems Inc.
- Encounters broad regulatory challenges across global markets, especially in data protection and cross-border software deployment.
5. Supply Chain & Operations
Tyler Technologies, Inc.
- Relies on strategic cloud partnerships, such as AWS, but limited exposure to complex global supply chains reduces operational risk.
Pegasystems Inc.
- Operates a global software delivery model with potential risks from international service disruptions and technology platform dependencies.
6. ESG & Climate Transition
Tyler Technologies, Inc.
- ESG initiatives less visible; public sector alignment may pressure transparency and sustainability efforts.
Pegasystems Inc.
- Stronger emphasis on ESG integration given diverse client base and global footprint, but still faces evolving compliance demands.
7. Geopolitical Exposure
Tyler Technologies, Inc.
- Primarily US-focused, limiting geopolitical risk but exposing it to domestic policy shifts and budget constraints.
Pegasystems Inc.
- Global operations increase exposure to geopolitical volatility, trade tensions, and regulatory fragmentation in key regions.
Which company shows a better risk-adjusted profile?
Tyler’s most impactful risk lies in its weak liquidity ratios, signaling short-term financial strain despite low leverage. Pegasystems faces significant geopolitical and competitive risks but demonstrates stronger profitability and financial health. Pegasystems’ higher Piotroski score (8 vs. 5) and safe-zone Altman Z-score reflect a better risk-adjusted profile, supported by diversified markets and robust operational metrics.
Final Verdict: Which stock to choose?
Tyler Technologies stands out as a robust cash generator with steady revenue growth and solid income quality. Its main point of vigilance lies in its declining return on invested capital and stretched valuation multiples. This stock suits investors seeking exposure to an established software player with moderate growth appetite.
Pegasystems boasts a clear strategic moat with a rapidly growing ROIC well above its cost of capital. Its superior profitability and financial strength offer better stability compared to Tyler. This stock fits well in growth-at-a-reasonable-price (GARP) portfolios aiming for sustainable value creation.
If you prioritize consistent cash flow and established market presence, Tyler Technologies presents a compelling scenario despite some efficiency concerns. However, if you seek accelerating profitability and a durable competitive advantage, Pegasystems outshines with superior capital returns and financial health.
Disclaimer: Investment carries a risk of loss of initial capital. The past performance is not a reliable indicator of future results. Be sure to understand risks before making an investment decision.
Go Further
I encourage you to read the complete analyses of Tyler Technologies, Inc. and Pegasystems Inc. to enhance your investment decisions: