Home > Comparison > Technology > MSTR vs PEGA
The strategic rivalry between Strategy Inc and Pegasystems Inc. defines the current trajectory of the technology sector’s software application landscape. Strategy Inc operates as a bitcoin treasury company coupled with AI-driven analytics, presenting a capital-intensive, innovation-led model. Pegasystems Inc. delivers comprehensive enterprise software and automation solutions, emphasizing scalable customer engagement. This analysis contrasts their growth and risk profiles to identify which company offers superior risk-adjusted returns for a diversified portfolio.
Table of contents
Companies Overview
Strategy Inc and Pegasystems Inc. each command significant roles in the software application market, shaping enterprise solutions globally.
Strategy Inc: Bitcoin Treasury and AI Analytics Leader
Strategy Inc primarily operates as a bitcoin treasury company, offering investors diverse Bitcoin exposure via equity and fixed income securities. Its core revenue engines include AI-powered enterprise analytics software, Strategy One and Strategy Mosaic, which enable non-technical users to access actionable insights and unify data governance. In 2025, it strategically rebranded to emphasize its dual focus on cryptocurrency assets and advanced analytics.
Pegasystems Inc.: Enterprise Software Innovator
Pegasystems Inc. is a leading developer of enterprise software applications focused on customer engagement and digital process automation. Its main products, Pega Platform and Pega Infinity, streamline sales, service, and customer decision-making across multiple channels. In 2025, Pegasystems prioritized intelligent automation and cloud-based deployment to enhance enterprise agility and customer experience worldwide.
Strategic Collision: Similarities & Divergences
Both companies drive growth through software-centric innovation but diverge sharply in focus—Strategy Inc. fuses cryptocurrency asset management with AI analytics, while Pegasystems emphasizes customer engagement and digital automation. Their primary competition lies in enterprise decision support and automation platforms. Strategy Inc. appeals to investors seeking bold exposure to crypto-assets; Pegasystems suits those favoring steady SaaS growth and broader enterprise software adoption.
Income Statement Comparison
The following data dissects the core profitability and scalability of both corporate engines to reveal who dominates the bottom line:
| Metric | Strategy Inc (MSTR) | Pegasystems Inc. (PEGA) |
|---|---|---|
| Revenue | 477M | 1.75B |
| Cost of Revenue | 149M | 421M |
| Operating Expenses | 5.62B | 1.04B |
| Gross Profit | 328M | 1.32B |
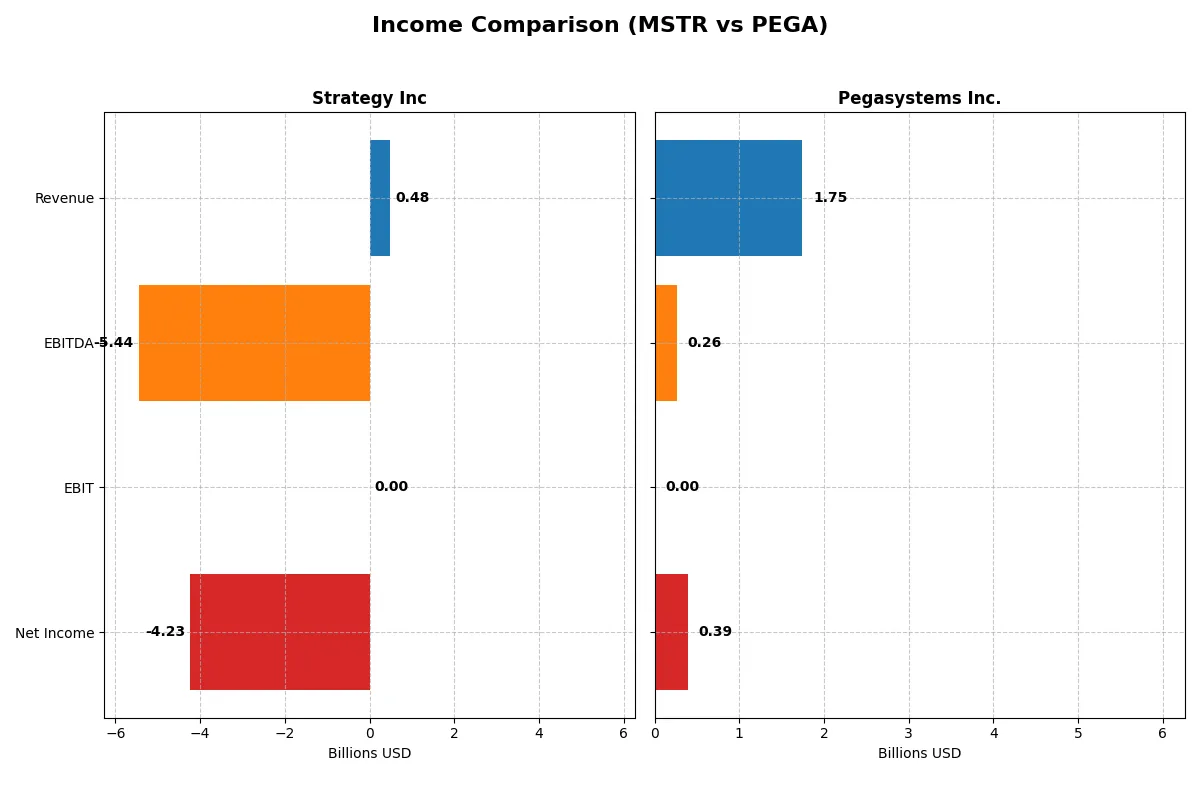
| EBITDA | -5.44B | 263M |
| EBIT | 0 | 0 |
| Interest Expense | -65M | -1.29M |
| Net Income | -4.23B | 393M |
| EPS | -15.23 | 2.30 |
| Fiscal Year | 2025 | 2025 |
Income Statement Analysis: The Bottom-Line Duel
This income statement comparison reveals which company runs its business with superior efficiency and stronger profitability.
Strategy Inc Analysis
Strategy Inc’s revenue declined by 6.6% over five years, with a slight 3% lift in 2025. Gross margin remains healthy at 68.7%, but net margin plunged to -886%, reflecting heavy losses. The 2025 net income hit -4.2B, signaling severe operational struggles despite stable revenue and gross profits.
Pegasystems Inc. Analysis
Pegasystems Inc. grew revenue 44% over five years, accelerating 17% in 2025. It maintains an impressive gross margin near 76% and a positive net margin of 22.5%. Net income surged to 393M in 2025, showing strong momentum and disciplined cost control driving profitable growth.
Margin Mastery vs. Revenue Resilience
Pegasystems clearly outperforms with robust revenue growth and strong net profitability, while Strategy Inc. struggles with deep losses despite stable top-line figures. For investors, Pegasystems’ profile of expanding margins and earnings growth offers a more compelling fundamental case.
Financial Ratios Comparison
These vital ratios act as a diagnostic tool to expose the underlying fiscal health, valuation premiums, and capital efficiency of the companies compared below:
| Ratios | Strategy Inc (MSTR) | Pegasystems Inc. (PEGA) |
|---|---|---|
| ROE | -8.29% | 49.97% |
| ROIC | -6.19% | 29.43% |
| P/E | -9.98 | 25.92 |
| P/B | 0.83 | 12.95 |
| Current Ratio | 5.62 | 1.33 |
| Quick Ratio | 5.62 | 1.33 |
| D/E (Debt-to-Equity) | 0.16 | 0.08 |
| Debt-to-Assets | 13.44% | 3.73% |
| Interest Coverage | 83.80 | -204.75 |
| Asset Turnover | 0.008 | 1.07 |
| Fixed Asset Turnover | 6.29 | 0 (not available) |
| Payout ratio | 0 | 3.92% |
| Dividend yield | 0 | 0.15% |
| Fiscal Year | 2025 | 2025 |
Efficiency & Valuation Duel: The Vital Signs
Financial ratios act as a company’s DNA, revealing hidden risks and operational excellence behind headline figures.
Strategy Inc
Strategy Inc shows weak profitability, with negative ROE (-8.29%) and net margin, signaling operational challenges. The stock trades at a negative P/E, suggesting distress or unusual earnings. Despite a strong current ratio (5.62), the company offers no dividend, focusing on R&D investment (19.7% of revenue) to drive future growth.
Pegasystems Inc.
Pegasystems Inc. posts robust profitability, with a 49.97% ROE and 22.54% net margin, reflecting operational strength. The valuation is stretched, with a P/E of 25.92 and P/B near 13, indicating high market expectations. It pays a small dividend (0.15%) while maintaining healthy reinvestment in R&D (17.9%) to sustain growth momentum.
Premium Valuation vs. Operational Safety
Pegasystems offers superior profitability and moderate risk, albeit at a premium valuation. Strategy Inc’s negative returns and mixed liquidity metrics present higher risk despite a conservative balance sheet. Investors seeking growth with operational resilience may prefer Pegasystems, while those wary of earnings volatility might view Strategy Inc’s profile with caution.
Which one offers the Superior Shareholder Reward?
Strategy Inc (MSTR) pays no dividends and has no share buybacks, reflecting a reinvestment focus despite recent losses and negative free cash flow. Pegasystems Inc. (PEGA) pays a modest dividend yield of 0.15%, with a low payout ratio (~4%) and consistent buybacks fueling shareholder returns. I see PEGA’s balanced distribution, underpinned by stable free cash flow and profitability, as more sustainable. MSTR’s lack of distributions and negative margins raise red flags for near-term rewards. In 2026, PEGA offers the superior total return profile through dividends and active buybacks, aligned with steady earnings and capital discipline.
Comparative Score Analysis: The Strategic Profile
The radar chart reveals the fundamental DNA and trade-offs of Strategy Inc and Pegasystems Inc, highlighting their financial strengths and weaknesses:
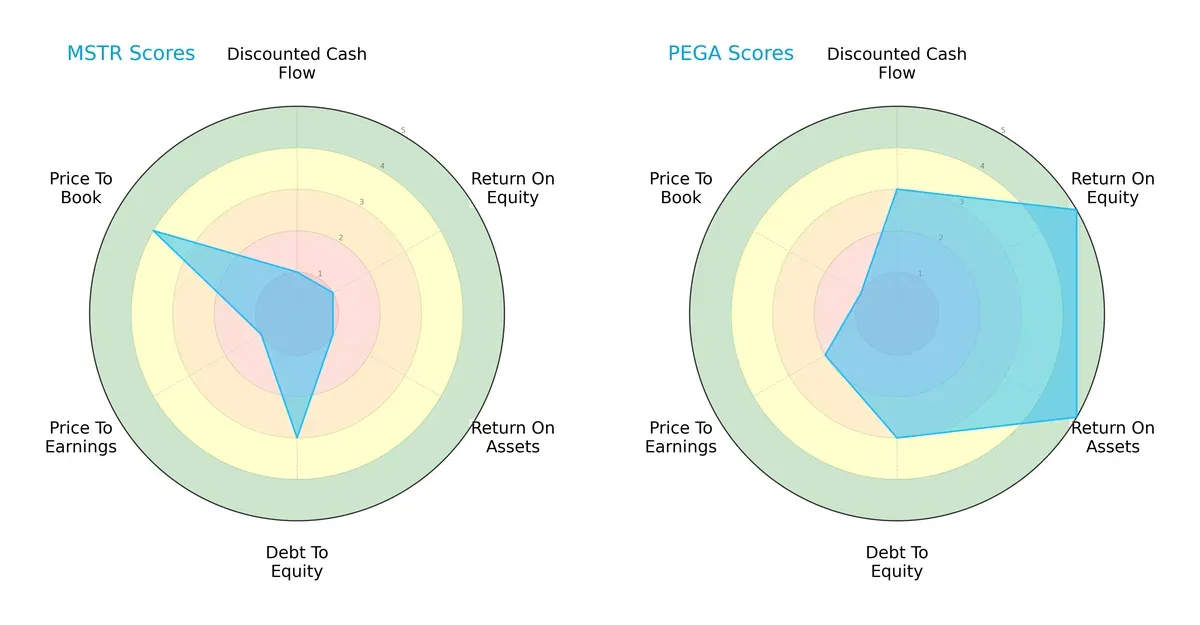
Pegasystems Inc shows superior operational efficiency with high ROE and ROA scores (5 each), while Strategy Inc lags significantly (1 each). Both share moderate debt management (score 3). Strategy Inc’s valuation looks more attractive by price-to-book (score 4) but suffers from weak discounted cash flow and price-to-earnings scores. Pegasystems presents a more balanced and robust profile, leveraging operational excellence rather than valuation bargains.
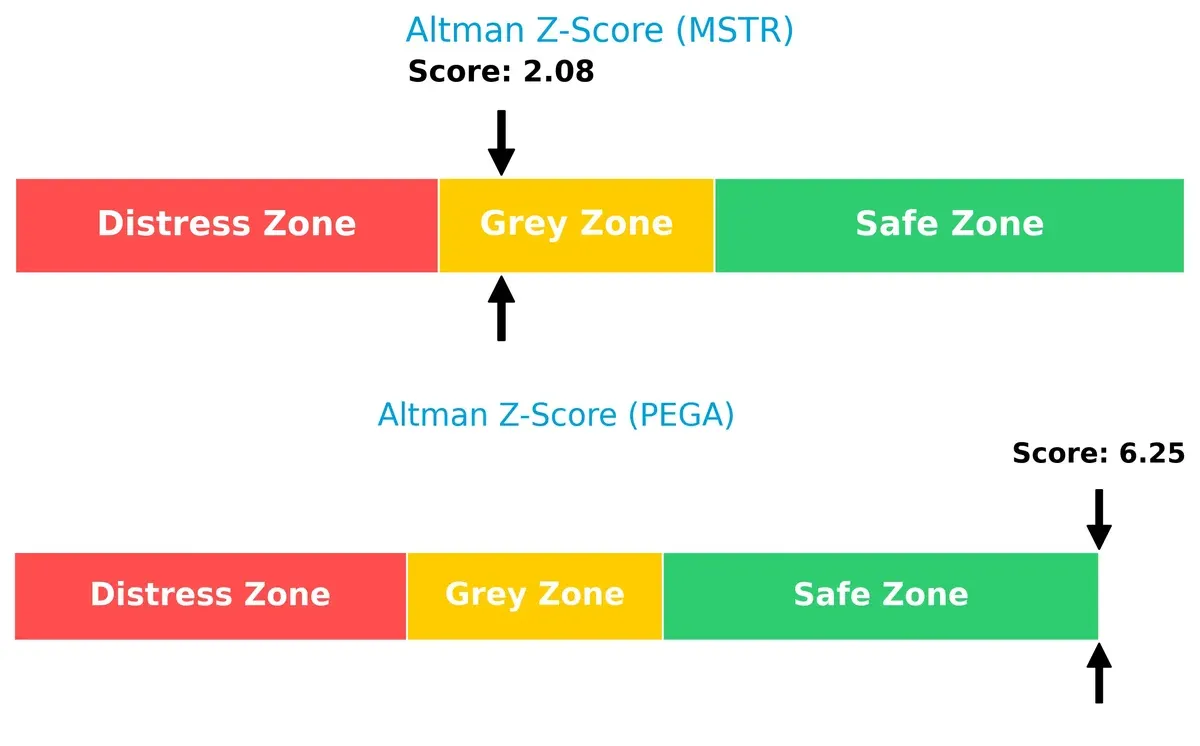
Bankruptcy Risk: Solvency Showdown
Pegasystems Inc’s Altman Z-Score of 6.25 places it securely in the safe zone, signaling low bankruptcy risk. Strategy Inc’s 2.08 score falls in the grey zone, indicating moderate survival risk in this cycle:
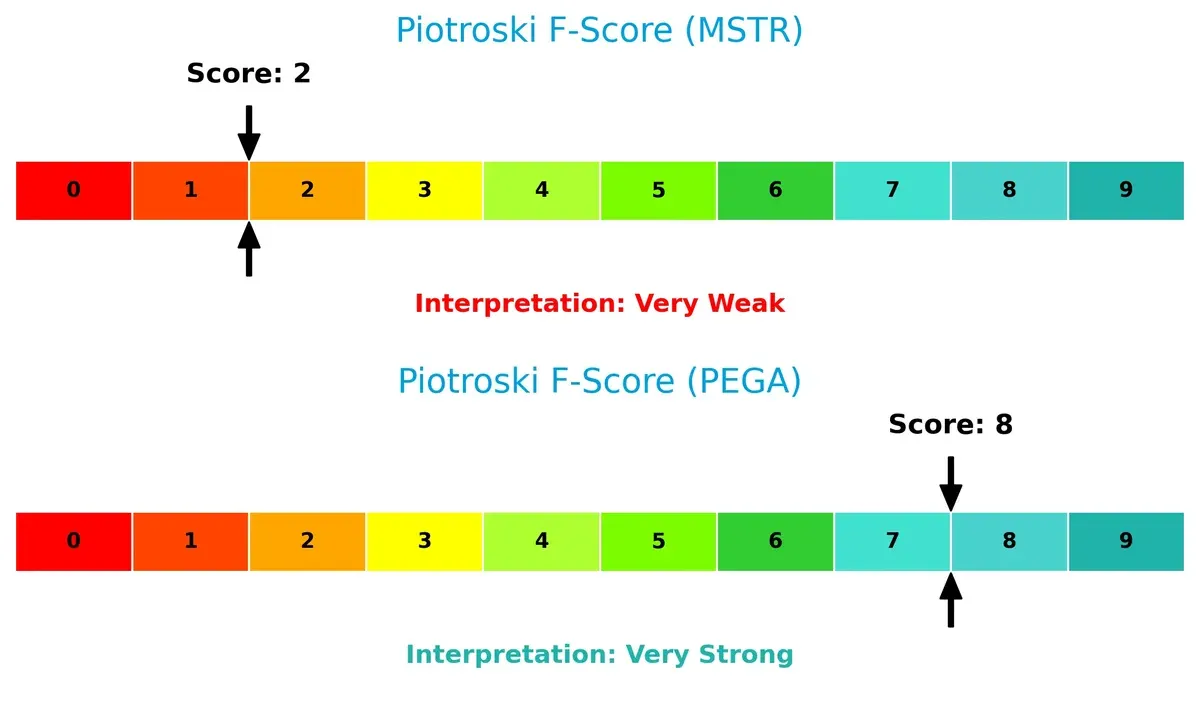
Financial Health: Quality of Operations
Pegasystems Inc scores an impressive 8 on the Piotroski F-Score, reflecting strong internal financial health and operational quality. Strategy Inc’s low score of 2 raises red flags about its financial stability and efficiency:
How are the two companies positioned?
This section dissects the operational DNA of Strategy Inc and Pegasystems Inc. by comparing their revenue distribution and internal strengths and weaknesses. The goal is to confront their economic moats to identify which model offers the most resilient, sustainable competitive advantage today.
Revenue Segmentation: The Strategic Mix
This visual comparison dissects how Strategy Inc and Pegasystems Inc. diversify their income streams and where their primary sector bets lie:
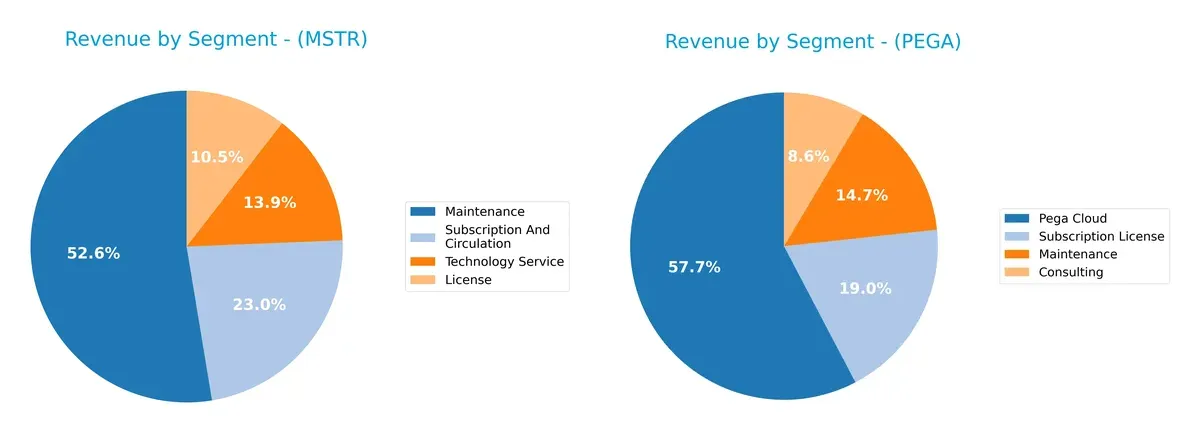
Strategy Inc anchors its revenue heavily on Maintenance at $244M, with Subscription and License trailing at $107M and $49M respectively, showing moderate diversification. Pegasystems Inc. pivots on Pega Cloud, which dwarfs other segments at $1.54B, while Subscription License and Maintenance contribute $507M and $393M. Pegasystems’ cloud dominance signals strong ecosystem lock-in, but also concentration risk. Strategy Inc’s balanced mix limits risk but may cap growth potential.
Strengths and Weaknesses Comparison
This table compares the Strengths and Weaknesses of Strategy Inc and Pegasystems Inc.:
Strategy Inc Strengths
- Low debt-to-equity ratio of 0.16
- Favorable quick ratio at 5.62
- Strong fixed asset turnover at 6.29
Pegasystems Inc. Strengths
- High net margin at 22.54%
- Strong ROE at 49.97%
- Robust ROIC at 29.43%
- Favorable debt-to-assets at 3.73%
- Solid asset turnover at 1.07
Strategy Inc Weaknesses
- Negative net margin at -886.26%
- Negative ROE at -8.29%
- ROIC at -6.19% below WACC at 17%
- Unfavorable interest coverage
- Unfavorable current ratio at 5.62
- Negative asset turnover at 0.01
Pegasystems Inc. Weaknesses
- Unfavorable P/E at 25.92 and P/B at 12.95
- Unfavorable fixed asset turnover at 0
- Unfavorable interest coverage
- Dividend yield low at 0.15%
Strategy Inc shows financial leverage discipline but suffers from severe profitability issues and weak operational efficiency. Pegasystems exhibits strong profitability and operational metrics but faces valuation and asset utilization challenges. Both companies present distinct financial profiles that influence their strategic focus.
The Moat Duel: Analyzing Competitive Defensibility
A structural moat is the only true defense against relentless competition eroding long-term profits, protecting sustainable shareholder value as follows:
Strategy Inc: Data-Driven Intangible Assets Moat
Strategy Inc leverages proprietary AI analytics and bitcoin treasury expertise. Its moat shows in volatile margins and negative net income but growing ROIC signals improving capital efficiency. Expansion in AI enterprise analytics offers potential to deepen this moat in 2026.
Pegasystems Inc.: Platform Ecosystem Moat
Pegasystems builds a sticky software platform unifying customer engagement and automation. Unlike Strategy Inc, it delivers consistently high margins and strong net income growth. Its expanding cloud and intelligent automation offerings position it to widen its moat amid digital transformation trends.
Moat Strength Showdown: Intangible Assets vs. Platform Ecosystem
Pegasystems maintains a deeper, more durable moat with ROIC far exceeding WACC and robust margin expansion. Strategy Inc’s moat is fragile but improving. Pegasystems is better equipped to defend and grow market share in 2026.
Which stock offers better returns?
The past year shows divergent price movements: Strategy Inc’s stock fell sharply while Pegasystems Inc. climbed significantly, both experiencing deceleration in trend momentum.
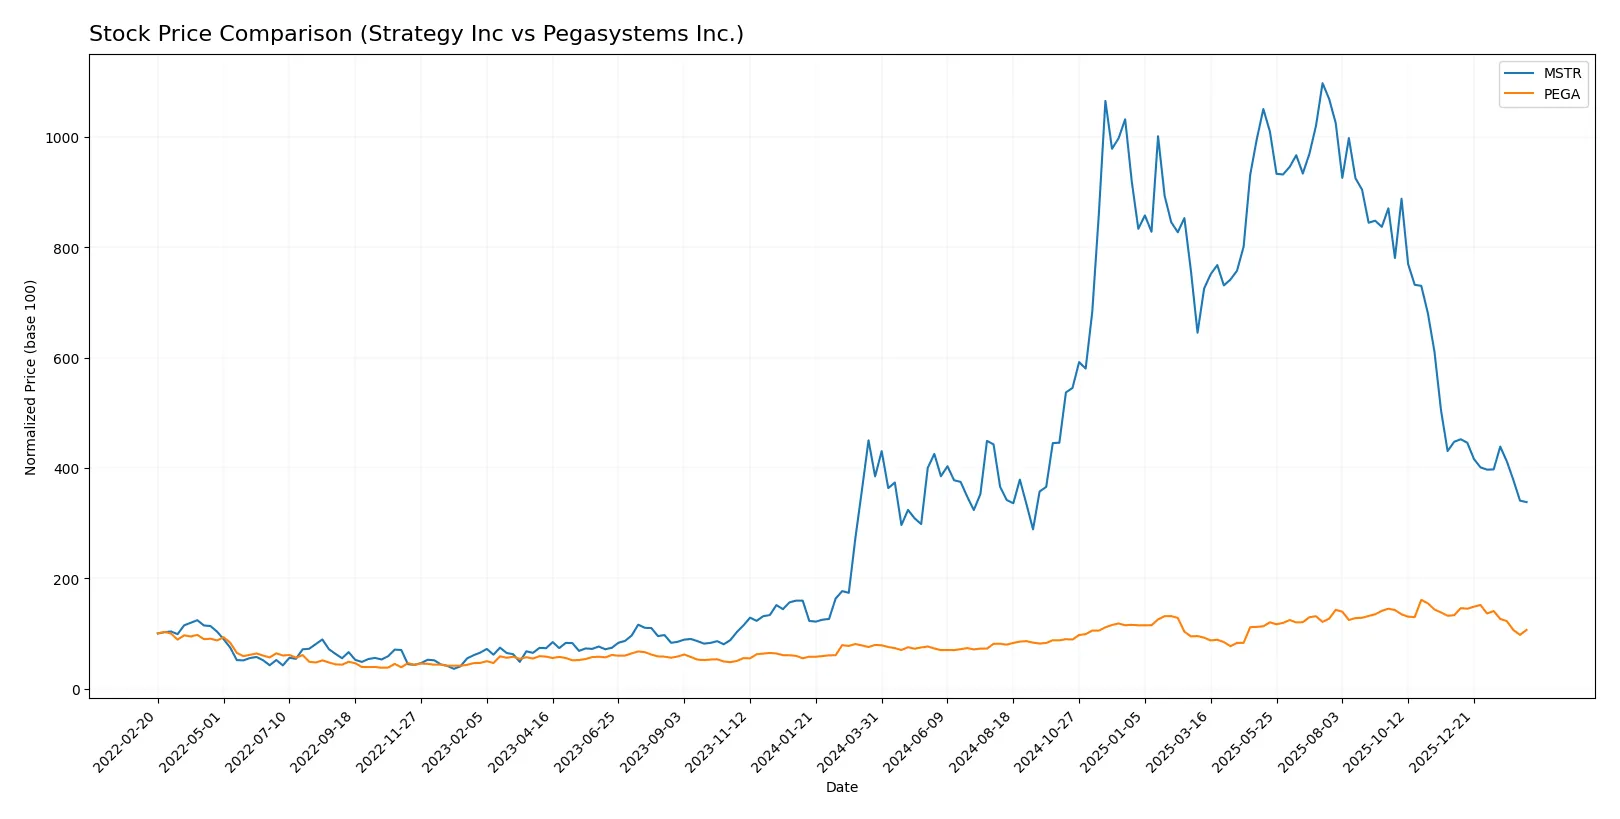
Trend Comparison
Strategy Inc’s stock declined 12.09% over the past 12 months, marking a bearish trend with decelerating losses. Its price ranged widely from 114.3 to 434.58, indicating high volatility.
Pegasystems Inc.’s stock rose 34.39% in the same period, reflecting a bullish trend with decelerating gains. The price moved between 28.73 and 66.27, showing moderate volatility.
Comparing the two, Pegasystems Inc. delivered superior market performance with a strong positive return, while Strategy Inc. experienced a notable downturn.
Target Prices
Analysts present a wide but constructive range for both Strategy Inc and Pegasystems Inc.
| Company | Target Low | Target High | Consensus |
|---|---|---|---|
| Strategy Inc | 175 | 705 | 374.5 |
| Pegasystems Inc. | 48 | 65 | 58.25 |
The consensus targets for Strategy Inc and Pegasystems Inc. significantly exceed their current prices, reflecting strong analyst optimism despite the volatility in Strategy Inc’s high beta environment.

Don’t Let Luck Decide Your Entry Point
Optimize your entry points with our advanced ProRealTime indicators. You’ll get efficient buy signals with precise price targets for maximum performance. Start outperforming now!
How do institutions grade them?
Strategy Inc Grades
The following table summarizes recent institutional grades for Strategy Inc:
| Grading Company | Action | New Grade | Date |
|---|---|---|---|
| Cantor Fitzgerald | Maintain | Overweight | 2026-02-09 |
| BTIG | Maintain | Buy | 2026-02-06 |
| Canaccord Genuity | Maintain | Buy | 2026-02-04 |
| Mizuho | Maintain | Outperform | 2026-01-16 |
| TD Cowen | Maintain | Buy | 2026-01-15 |
| Citigroup | Maintain | Buy | 2025-12-22 |
| Bernstein | Maintain | Outperform | 2025-12-08 |
| Monness, Crespi, Hardt | Upgrade | Neutral | 2025-11-10 |
| Canaccord Genuity | Maintain | Buy | 2025-11-03 |
| HC Wainwright & Co. | Maintain | Buy | 2025-11-03 |
Pegasystems Inc. Grades
The following table summarizes recent institutional grades for Pegasystems Inc.:
| Grading Company | Action | New Grade | Date |
|---|---|---|---|
| Rosenblatt | Maintain | Buy | 2026-02-12 |
| RBC Capital | Maintain | Outperform | 2026-02-12 |
| Citizens | Maintain | Market Outperform | 2026-02-12 |
| Barclays | Upgrade | Overweight | 2026-02-12 |
| Wedbush | Maintain | Outperform | 2026-02-12 |
| Citigroup | Maintain | Buy | 2026-02-12 |
| Rosenblatt | Maintain | Buy | 2026-02-06 |
| JP Morgan | Maintain | Overweight | 2025-12-05 |
| RBC Capital | Maintain | Outperform | 2025-10-23 |
| Wedbush | Maintain | Outperform | 2025-10-23 |
Which company has the best grades?
Pegasystems Inc. consistently receives strong grades with several Outperform and Buy ratings, including recent upgrades. Strategy Inc. has mostly Buy and Overweight grades but fewer upgrades. Pegasystems’ higher consistency in positive ratings may attract investor confidence.
Risks specific to each company
The following categories identify the critical pressure points and systemic threats facing both firms in the 2026 market environment:
1. Market & Competition
Strategy Inc
- Faces intense volatility due to bitcoin exposure and niche AI analytics market.
Pegasystems Inc.
- Competes in broader enterprise software with diversified customer base, less niche risk.
2. Capital Structure & Debt
Strategy Inc
- Low debt-to-equity (0.16) supports moderate leverage; however, interest coverage is negative, signaling risk in covering debt costs.
Pegasystems Inc.
- Maintains conservative debt levels (0.08) with similar negative interest coverage, but stronger overall financial health.
3. Stock Volatility
Strategy Inc
- High beta (3.54) indicates extreme price swings, reflecting bitcoin market sensitivity.
Pegasystems Inc.
- Modest beta (1.07) shows relatively stable stock price, aligned with sector norms.
4. Regulatory & Legal
Strategy Inc
- Regulatory uncertainty in cryptocurrency markets poses elevated risks.
Pegasystems Inc.
- Faces standard software industry compliance risks but no major regulatory headwinds reported.
5. Supply Chain & Operations
Strategy Inc
- Operations tied to global AI software and bitcoin treasury management, vulnerable to tech disruptions.
Pegasystems Inc.
- Larger scale with diversified operations reduces operational risk but depends on cloud infrastructure stability.
6. ESG & Climate Transition
Strategy Inc
- Limited disclosure on ESG initiatives, raising concerns on sustainability and investor appeal.
Pegasystems Inc.
- Increasing focus on ESG and digital transformation aligns with market trends, improving long-term viability.
7. Geopolitical Exposure
Strategy Inc
- Significant international bitcoin holdings expose it to geopolitical shifts in crypto regulation.
Pegasystems Inc.
- Global presence with diversified markets mitigates single-region geopolitical risk.
Which company shows a better risk-adjusted profile?
Strategy Inc’s largest risk is extreme stock volatility amplified by bitcoin market exposure. Pegasystems’ key risk lies in high valuation multiples amid moderate operating risks. Pegasystems demonstrates a better risk-adjusted profile, supported by stronger profitability, safer Altman Z-score (6.25 vs. 2.08), and robust Piotroski score (8 vs. 2). The recent surge in bitcoin volatility justifies caution on Strategy Inc despite its low debt; Pegasystems’ stable earnings and diversified footprint offer more prudent investment potential.
Final Verdict: Which stock to choose?
Strategy Inc’s superpower lies in its ability to maintain a strong liquidity position, signaling resilience amid operational challenges. However, its negative returns and value destruction warrant caution. It fits portfolios seeking speculative opportunities with a tolerance for volatility and turnaround potential.
Pegasystems Inc. boasts a robust economic moat fueled by efficient capital use and steady income growth. Its safety profile surpasses Strategy Inc., supported by solid profitability and financial health. It suits investors favoring steady growth and durable competitive advantages within a balanced risk framework.
If you prioritize turnaround plays and can withstand short-term volatility, Strategy Inc. might attract due to its liquidity cushion despite value erosion. However, if you seek sustainable profitability and a proven moat, Pegasystems Inc. outshines with better stability and value creation, commanding a premium in growth-focused portfolios.
Disclaimer: Investment carries a risk of loss of initial capital. The past performance is not a reliable indicator of future results. Be sure to understand risks before making an investment decision.
Go Further
I encourage you to read the complete analyses of Strategy Inc and Pegasystems Inc. to enhance your investment decisions: