In the fast-evolving software application industry, Salesforce, Inc. (CRM) and Pegasystems Inc. (PEGA) stand out as key players driving innovation in customer engagement and digital process automation. Both companies offer powerful platforms that help enterprises enhance customer experiences and streamline operations, competing in overlapping markets with distinct strategic approaches. This article will analyze their strengths to help you decide which company is the more compelling investment opportunity in 2026.
Table of contents
Companies Overview
I will begin the comparison between Salesforce and Pegasystems by providing an overview of these two companies and their main differences.
Salesforce Overview
Salesforce, Inc. is a leading provider of customer relationship management (CRM) technology that aims to connect companies with their customers globally. Its Customer 360 platform offers solutions in sales, service, marketing, commerce, analytics, and integration, serving various industries like financial services and healthcare. With over 76K employees and a market cap of $218.5B, Salesforce emphasizes a comprehensive, scalable approach to customer engagement and enterprise software.
Pegasystems Overview
Pegasystems Inc. develops and supports enterprise software, focusing on customer engagement and process automation through its Pega Platform and Pega Infinity. The company serves diverse sectors including financial services, healthcare, and government, offering intelligent automation and cloud services. Headquartered in Massachusetts, Pegasystems has around 5.4K employees and a market cap of $8.8B, positioning itself as a specialized provider in digital process automation and customer service software.
Key similarities and differences
Both Salesforce and Pegasystems operate in the software application industry with a focus on customer engagement and enterprise solutions. They provide platforms that integrate automation and analytics to enhance client operations. However, Salesforce has a significantly larger scale, broader product suite, and greater market capitalization, while Pegasystems is more specialized with a focus on digital process automation and cloud infrastructure for enterprise applications.
Income Statement Comparison
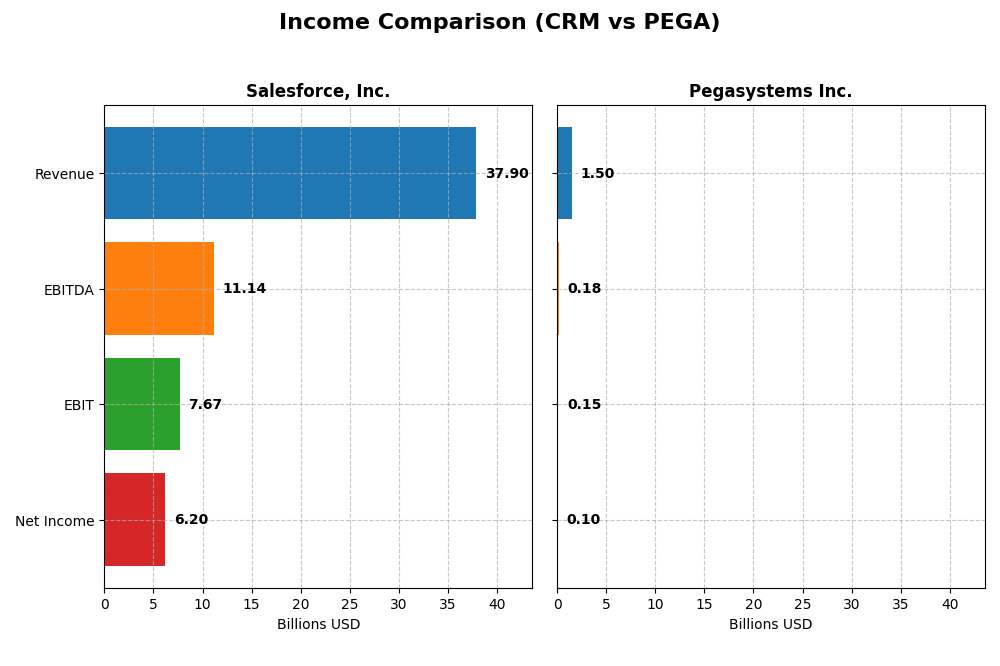
The table below presents a side-by-side comparison of key income statement metrics for Salesforce, Inc. and Pegasystems Inc. for their most recent fiscal years, reflecting their financial performance.
| Metric | Salesforce, Inc. (CRM) | Pegasystems Inc. (PEGA) |
|---|---|---|
| Market Cap | 218.5B | 8.8B |
| Revenue | 37.9B | 1.5B |
| EBITDA | 11.1B | 185M |
| EBIT | 7.7B | 149M |
| Net Income | 6.2B | 99M |
| EPS | 6.44 | 0.58 |
| Fiscal Year | 2025 | 2024 |
Income Statement Interpretations
Salesforce, Inc.
Salesforce’s revenue and net income showed strong upward trends from 2021 to 2025, with revenue rising from $21.3B to $37.9B and net income growing from $4.1B to $6.2B. Margins generally improved, with gross margin at 77.19% and net margin at 16.35% in 2025. The latest year saw favorable growth in revenues (+8.7%) and net income (+37.8%), alongside a significant EPS increase (+51.4%).
Pegasystems Inc.
Pegasystems experienced consistent revenue growth from $1.02B in 2020 to $1.5B in 2024, with net income recovering from negative figures early in the period to $99M in 2024. Gross margin remained favorable at 73.9%, while EBIT margin was neutral at 9.98%. In 2024, revenue grew moderately by 4.5%, but net margin and EPS improved substantially by nearly 40% and 37.5%, respectively.
Which one has the stronger fundamentals?
Salesforce demonstrates stronger fundamentals with higher absolute revenue and net income, superior margins, and more robust recent growth rates, particularly in profitability metrics. Pegasystems shows impressive net income recovery and margin improvements but operates on a smaller scale with more moderate revenue growth. Both companies have favorable income evaluations, though Salesforce’s scale and margin stability suggest a stronger income statement foundation.
Financial Ratios Comparison
The table below presents a side-by-side comparison of key financial ratios for Salesforce, Inc. (CRM) and Pegasystems Inc. (PEGA) based on the most recent fiscal year data available.
| Ratios | Salesforce, Inc. (CRM) | Pegasystems Inc. (PEGA) |
|---|---|---|
| ROE | 10.13% | 16.94% |
| ROIC | 7.95% | 7.40% |
| P/E | 53.04 | 80.12 |
| P/B | 5.37 | 13.57 |
| Current Ratio | 1.06 | 1.23 |
| Quick Ratio | 1.06 | 1.23 |
| D/E (Debt-to-Equity) | 0.19 | 0.94 |
| Debt-to-Assets | 11.07% | 31.09% |
| Interest Coverage | 26.49 | 18.12 |
| Asset Turnover | 0.37 | 0.85 |
| Fixed Asset Turnover | 7.03 | 14.36 |
| Payout ratio | 24.80% | 10.28% |
| Dividend yield | 0.47% | 0.13% |
Interpretation of the Ratios
Salesforce, Inc.
Salesforce shows a mix of strengths and weaknesses in its financial ratios. The company has favorable net margin, quick ratio, debt-to-equity, and interest coverage ratios, indicating solid profitability and liquidity management. However, high P/E and P/B ratios and low asset turnover suggest valuation concerns and less efficient asset use. The dividend yield is low at 0.47%, reflecting modest shareholder returns through dividends.
Pegasystems Inc.
Pegasystems presents a slightly favorable ratio profile with strong return on equity and fixed asset turnover, suggesting efficient capital use and profitability. Neutral ratings on net margin, ROIC, and leverage ratios indicate stable operations but moderate risk. The company’s dividend yield is quite low at 0.13%, consistent with a cautious approach to shareholder payouts and potential reinvestment priorities.
Which one has the best ratios?
Both companies have slightly favorable overall ratio evaluations, but Salesforce exhibits a higher proportion of favorable ratios (42.86% vs. 28.57%) and stronger interest coverage and leverage metrics. Pegasystems offers better equity returns but faces higher valuation multiples and neutral to unfavorable liquidity ratios. The choice depends on investor preference for profitability, valuation, and risk tolerance.
Strategic Positioning
This section compares the strategic positioning of Salesforce and Pegasystems, including market position, key segments, and exposure to disruption:
Salesforce, Inc.
- Leading market cap of 218B with strong NYSE presence; faces competitive pressure in software applications
- Diverse segments: Sales, Service, Marketing, Commerce, Integration, Analytics, and Platform services drive revenue
- Exposed to technological disruption through cloud platform, analytics, Slack integration, and flexible app building
Pegasystems Inc.
- Smaller market cap of 8.8B listed on NASDAQ with competitive pressure in enterprise software markets
- Focused on Pega Platform, customer engagement, digital automation, cloud, consulting, and licensing revenue
- Faces disruption via cloud adoption, intelligent automation, unified customer engagement platforms, and Pega Cloud services
Salesforce vs Pegasystems Positioning
Salesforce pursues a highly diversified approach across multiple cloud-based customer relationship and analytics segments, enabling broad industry reach. Pegasystems maintains a concentrated focus on customer engagement and automation platforms, emphasizing cloud and consulting services. Diversification offers broader market exposure, while concentration may allow specialized innovation.
Which has the best competitive advantage?
Both companies are slightly unfavorable in MOAT evaluation, shedding value but showing growing ROIC trends. Neither currently demonstrates a strong economic moat; both face challenges in efficiently generating returns above their cost of capital.
Stock Comparison
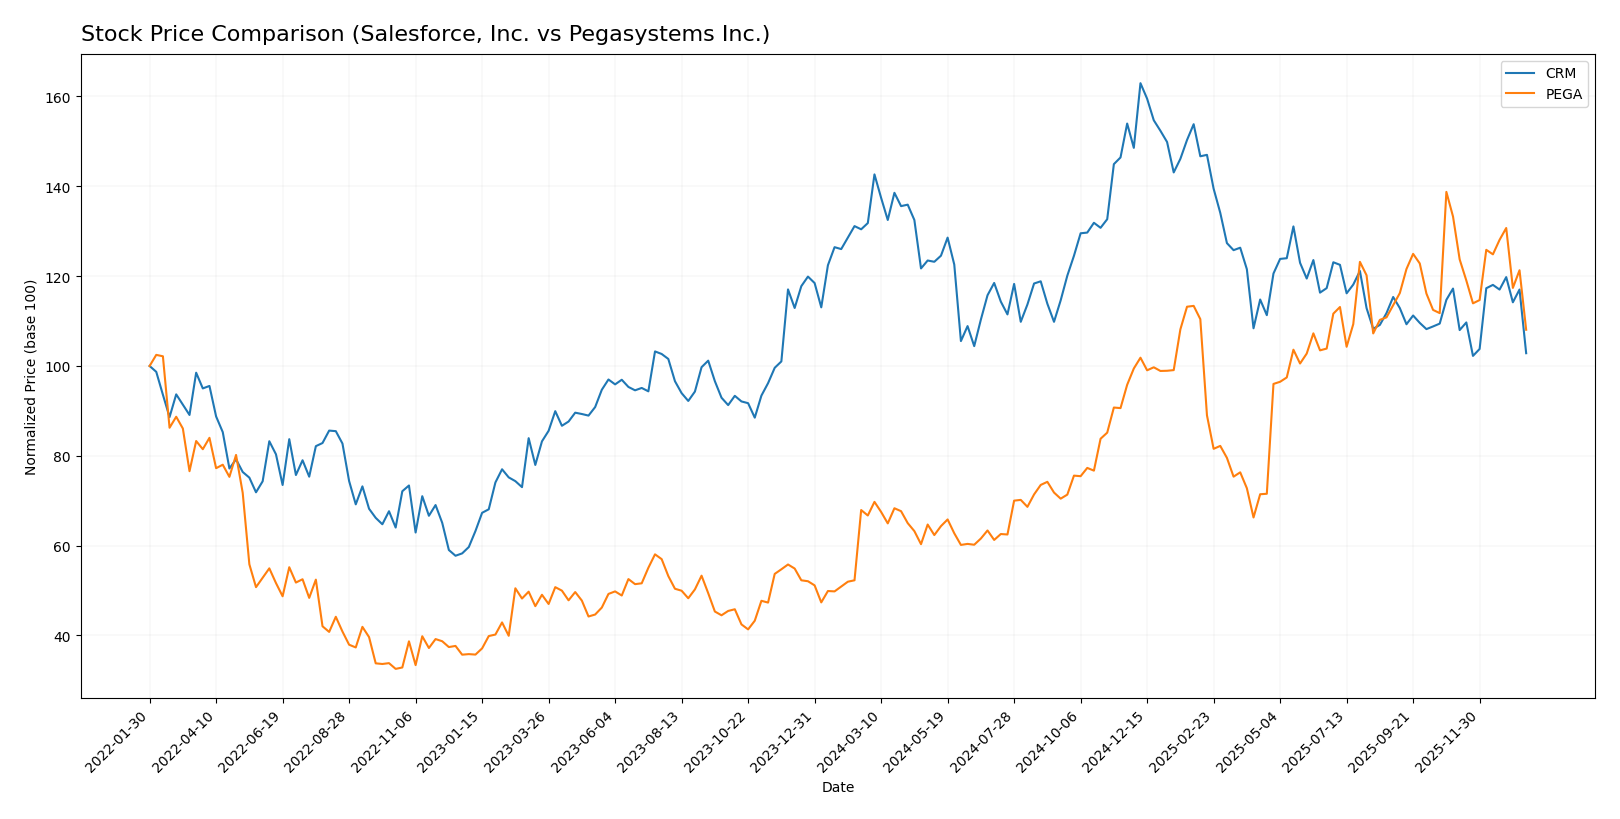
The stock price movements of Salesforce, Inc. (CRM) and Pegasystems Inc. (PEGA) over the past year show contrasting trends, with CRM experiencing a sustained decline and PEGA posting significant gains before recent downturns.
Trend Analysis
Salesforce, Inc. (CRM) shows a bearish trend over the past 12 months with a price decline of -21.98%, marked by accelerating downward momentum and high volatility (std deviation 31.8). Recent months show a smaller -12.28% drop but with a slight positive slope.
Pegasystems Inc. (PEGA) presents a bullish trend during the same period, gaining 61.99% with decelerating growth and moderate volatility (std deviation 10.77). However, the recent trend reversed with an -18.92% decline and a negative slope.
Comparing both stocks, PEGA delivered the highest market performance over the past year with a 61.99% increase, while CRM experienced a significant decline of -21.98%.
Target Prices
Analyst consensus indicates significant upside potential for both Salesforce, Inc. and Pegasystems Inc.
| Company | Target High | Target Low | Consensus |
|---|---|---|---|
| Salesforce, Inc. | 400 | 250 | 324.17 |
| Pegasystems Inc. | 80 | 67 | 74 |
The target consensus for Salesforce at $324.17 is well above its current price of $228.56, suggesting strong growth expectations. Similarly, Pegasystems’ consensus target of $74 exceeds its current price of $51.66, signaling positive analyst sentiment.
Analyst Opinions Comparison
This section compares analysts’ ratings and grades for Salesforce, Inc. and Pegasystems Inc.:
Rating Comparison
Salesforce, Inc. Rating
- Rating: B+ with a very favorable overall evaluation.
- Discounted Cash Flow Score: 4, indicating a favorable valuation.
- ROE Score: 4, showing favorable profit generation efficiency.
- ROA Score: 4, reflecting favorable asset utilization.
- Debt To Equity Score: 3, suggesting moderate financial risk.
- Overall Score: 3, assessed as moderate.
Pegasystems Inc. Rating
- Rating: B+ with a very favorable overall evaluation.
- Discounted Cash Flow Score: 3, indicating a moderate valuation.
- ROE Score: 5, indicating very favorable profit generation.
- ROA Score: 5, reflecting very favorable asset utilization.
- Debt To Equity Score: 3, suggesting moderate financial risk.
- Overall Score: 3, assessed as moderate.
Which one is the best rated?
Both Salesforce and Pegasystems share the same overall rating score and rating grade of B+. Pegasystems scores higher in ROE and ROA, while Salesforce has a higher discounted cash flow score. Debt risk and overall scores are equal.
Scores Comparison
Here is the comparison of the financial health scores for Salesforce, Inc. and Pegasystems Inc.:
Salesforce, Inc. Scores
- Altman Z-Score: 5.26, indicating a safe zone with low bankruptcy risk.
- Piotroski Score: 7, categorized as strong financial strength.
Pegasystems Inc. Scores
- Altman Z-Score: 10.23, indicating a safe zone with very low bankruptcy risk.
- Piotroski Score: 8, categorized as very strong financial strength.
Which company has the best scores?
Based strictly on the data, Pegasystems Inc. has higher scores than Salesforce, Inc. in both the Altman Z-Score and Piotroski Score, indicating stronger financial stability and health.
Grades Comparison
Here is a comparison of recent grades and ratings from reliable grading companies for both Salesforce, Inc. and Pegasystems Inc.:
Salesforce, Inc. Grades
The following table summarizes recent grades assigned by well-known financial institutions to Salesforce, Inc.:
| Grading Company | Action | New Grade | Date |
|---|---|---|---|
| Barclays | Maintain | Overweight | 2026-01-12 |
| RBC Capital | Maintain | Sector Perform | 2026-01-05 |
| Morgan Stanley | Maintain | Overweight | 2025-12-09 |
| Citigroup | Maintain | Neutral | 2025-12-08 |
| DA Davidson | Maintain | Neutral | 2025-12-05 |
| Citizens | Maintain | Market Outperform | 2025-12-04 |
| Deutsche Bank | Maintain | Buy | 2025-12-04 |
| Wedbush | Maintain | Outperform | 2025-12-04 |
| Northland Capital Markets | Maintain | Market Perform | 2025-12-04 |
| Canaccord Genuity | Maintain | Buy | 2025-12-04 |
Overall, Salesforce’s grades reflect a positive consensus with multiple buy and outperform ratings, indicating steady confidence among analysts.
Pegasystems Inc. Grades
The following table shows recent grades from recognized analysts for Pegasystems Inc.:
| Grading Company | Action | New Grade | Date |
|---|---|---|---|
| JP Morgan | Maintain | Overweight | 2025-12-05 |
| Wedbush | Maintain | Outperform | 2025-10-23 |
| RBC Capital | Maintain | Outperform | 2025-10-23 |
| Barclays | Maintain | Equal Weight | 2025-10-23 |
| Rosenblatt | Maintain | Buy | 2025-10-23 |
| DA Davidson | Upgrade | Buy | 2025-10-22 |
| Rosenblatt | Maintain | Buy | 2025-10-15 |
| Rosenblatt | Maintain | Buy | 2025-07-24 |
| DA Davidson | Maintain | Neutral | 2025-07-24 |
| Wedbush | Maintain | Outperform | 2025-07-24 |
Pegasystems shows a generally favorable rating profile with a progression toward buy and outperform grades, reflecting improving analyst sentiment.
Which company has the best grades?
Salesforce, Inc. has received a larger volume of buy and outperform ratings compared to Pegasystems Inc., which has more neutral and equal weight grades alongside some buy upgrades. This suggests Salesforce currently enjoys broader analyst confidence, which may influence investor interest and perceived stability.
Strengths and Weaknesses
Below is a comparison of key strengths and weaknesses for Salesforce, Inc. (CRM) and Pegasystems Inc. (PEGA) based on their latest financial and strategic data.
| Criterion | Salesforce, Inc. (CRM) | Pegasystems Inc. (PEGA) |
|---|---|---|
| Diversification | Highly diversified product portfolio with strong revenue streams across Sales Cloud (8.32B), Service Cloud (9.05B), and Integration & Analytics (5.78B) in 2025. | More focused portfolio; main revenue from Pega Cloud (1.13B) and Subscription License (398M) in 2024. |
| Profitability | Net margin favorable at 16.35%, ROIC neutral at 7.95%, but currently shedding value (ROIC below WACC). | Net margin neutral at 6.63%, ROE favorable at 16.94%, also shedding value but with improving profitability. |
| Innovation | Strong innovation evidenced by growing ROIC trend (762% growth) and continuous expansion in cloud and analytics segments. | Moderate innovation with growing ROIC trend (224% growth), focus on cloud and subscription models. |
| Global presence | Large global footprint with significant scale in multiple cloud offerings supporting broad enterprise customers. | Smaller global presence, more niche market focus with cloud-based and consulting services. |
| Market Share | Leading market share in CRM and cloud software markets, supported by extensive product ecosystem. | Smaller market share with niche positioning in process automation and customer engagement software. |
Key takeaways: Salesforce shows a highly diversified and innovative business with strong profitability metrics despite currently shedding value, signaling investment caution but growth potential. Pegasystems is more focused with improving profitability and innovation but holds a smaller market share and less diversification. Both companies maintain slightly unfavorable moats due to ROIC below WACC, yet their improving trends suggest potential future value creation.
Risk Analysis
Below is a comparative risk table for Salesforce, Inc. (CRM) and Pegasystems Inc. (PEGA) based on the most recent financial and operational data for 2025 and 2024 respectively:
| Metric | Salesforce, Inc. (CRM) | Pegasystems Inc. (PEGA) |
|---|---|---|
| Market Risk | Beta 1.27; high valuation multiples increase sensitivity to market shifts | Beta 1.08; high P/E and P/B ratios suggest valuation risk |
| Debt Level | Low debt-to-equity (0.19) and strong interest coverage (28.18) | Moderate debt-to-equity (0.94) with good interest coverage (21.87) |
| Regulatory Risk | Moderate, given global footprint and data privacy laws | Moderate, with exposure to multiple international markets |
| Operational Risk | Large employee base (76K); complexity in integrating multiple platforms | Smaller scale (5.4K employees); reliance on platform stability |
| Environmental Risk | Moderate; technology sector exposure but low direct footprint | Moderate; similar sector with focus on cloud infrastructure |
| Geopolitical Risk | High, due to extensive global operations | Moderate, less global but still international exposure |
The most likely and impactful risks for both companies stem from market volatility driven by high valuation multiples, especially PEGA’s elevated P/E and P/B ratios, which could amplify downside in market corrections. Salesforce’s low debt reduces financial risk, but its operational complexity and global regulatory environment require cautious monitoring. Pegasystems’ moderate leverage and strong financial scores provide some cushion, yet valuation risk remains significant.
Which Stock to Choose?
Salesforce, Inc. (CRM) shows a strong income evolution with an 8.72% revenue growth in 2025 and favorable profitability metrics including a 16.35% net margin. Its financial ratios are slightly favorable overall, supported by low debt levels (net debt to EBITDA at 0.23) and a solid rating of B+ with a very favorable status. However, its economic moat is slightly unfavorable as ROIC remains below WACC despite improving profitability.
Pegasystems Inc. (PEGA) displays moderate income growth with a 4.51% increase in revenue in 2024 and favorable net margin growth over the period. Its financial ratios are also slightly favorable, though with a higher debt ratio (debt to equity 0.94) and a B+ rating that is very favorable. The company’s moat is similarly slightly unfavorable due to ROIC below WACC, yet it benefits from a strong upward ROIC trend.
Considering ratings and comprehensive financial evaluations, Salesforce might appear more stable with stronger profitability and lower debt, which could suit risk-averse or quality-focused investors. Pegasystems, with its higher ROE and growing ROIC, might appeal to those with a more risk-tolerant profile seeking growth potential despite higher leverage.
Disclaimer: Investment carries a risk of loss of initial capital. The past performance is not a reliable indicator of future results. Be sure to understand risks before making an investment decision.
Go Further
I encourage you to read the complete analyses of Salesforce, Inc. and Pegasystems Inc. to enhance your investment decisions: