In the dynamic world of specialty retail, PDD Holdings Inc. and Williams-Sonoma, Inc. stand out as influential players with distinct approaches. PDD Holdings leverages its innovative e-commerce platforms to connect diverse consumer needs digitally, while Williams-Sonoma excels in omni-channel home goods retail with strong brand portfolios. This comparison explores their market strategies and growth potential to help you identify the most compelling investment opportunity in 2026. Let’s dive into which company could best complement your portfolio.
Table of contents
Companies Overview
I will begin the comparison between PDD Holdings Inc. and Williams-Sonoma, Inc. by providing an overview of these two companies and their main differences.
PDD Holdings Inc. Overview
PDD Holdings Inc. is a multinational commerce group focused on integrating businesses and people into the digital economy. The company operates Pinduoduo, an e-commerce platform offering a wide range of products including agricultural produce, apparel, electronics, and household goods. Headquartered in Dublin, Ireland, PDD Holdings emphasizes a broad digital marketplace approach in the specialty retail sector.
Williams-Sonoma, Inc. Overview
Williams-Sonoma, Inc. is an omni-channel specialty retailer specializing in home products such as cookware, furniture, and decor. The company operates multiple brands including Williams Sonoma, Pottery Barn, and West Elm, selling through 544 physical stores and e-commerce platforms worldwide. Based in San Francisco, California, Williams-Sonoma targets a lifestyle-focused consumer market with a diverse product portfolio.
Key similarities and differences
Both companies operate in the specialty retail sector but differ significantly in business models. PDD Holdings focuses on digital marketplaces connecting consumers and businesses primarily through e-commerce platforms. In contrast, Williams-Sonoma combines physical retail stores with online sales, offering branded home goods and lifestyle products. Market cap and employee scale also differ, with PDD Holdings substantially larger and more digitally oriented.
Income Statement Comparison
The following table compares key income statement metrics for PDD Holdings Inc. and Williams-Sonoma, Inc. for their most recent fiscal year, providing a clear snapshot of each company’s financial performance.

| Metric | PDD Holdings Inc. (PDD) | Williams-Sonoma, Inc. (WSM) |
|---|---|---|
| Market Cap | 169B CNY | 24.4B USD |
| Revenue | 394B CNY | 7.71B USD |
| EBITDA | 109B CNY | 1.66B USD |
| EBIT | 108B CNY | 1.43B USD |
| Net Income | 112B CNY | 1.13B USD |
| EPS | 81.24 CNY | 8.91 USD |
| Fiscal Year | 2024 | 2024 |
Income Statement Interpretations
PDD Holdings Inc.
PDD Holdings has demonstrated strong revenue and net income growth from 2020 to 2024, with revenue surging from 59B CNY to nearly 394B CNY and net income increasing from a loss of 7.2B CNY in 2020 to 112B CNY in 2024. Margins have improved significantly, with a gross margin of 60.92% and net margin at 28.55% in 2024, reflecting enhanced profitability. The latest year saw robust growth with revenue up 59% and net margin expanding by 17.78%, indicating accelerating operational efficiency.
Williams-Sonoma, Inc.
Williams-Sonoma’s revenue grew moderately over 2020-2024, rising from 6.8B USD to about 7.7B USD, though it experienced a slight 0.5% revenue decline in 2024. Net income increased steadily, reaching 1.13B USD in 2024, supported by a net margin improvement to 14.59%. The company’s gross margin remained stable at 46.45%, while EBIT margin rose to 18.55%. Despite the minor revenue dip, earnings per share increased by 20.74%, reflecting profitability gains.
Which one has the stronger fundamentals?
PDD Holdings exhibits stronger fundamentals, marked by exceptional revenue and net income growth and superior margin expansion, including a high 28.55% net margin in 2024. Williams-Sonoma shows stable but slower growth with a slight recent revenue decline and lower profit margins. Both companies have favorable income statements, yet PDD’s rapid growth and margin improvements position it with more robust financial momentum.
Financial Ratios Comparison
The table below presents key financial ratios for PDD Holdings Inc. and Williams-Sonoma, Inc. based on their most recent fiscal year data, enabling a straightforward side-by-side comparison.
| Ratios | PDD Holdings Inc. (2024) | Williams-Sonoma, Inc. (2024) |
|---|---|---|
| ROE | 35.9% | 52.5% |
| ROIC | 28.4% | 29.9% |
| P/E | 8.7 | 23.7 |
| P/B | 3.13 | 12.45 |
| Current Ratio | 2.21 | 1.44 |
| Quick Ratio | 2.20 | 0.74 |
| D/E | 0.034 | 0.629 |
| Debt-to-Assets | 2.1% | 25.4% |
| Interest Coverage | 0 | 0 |
| Asset Turnover | 0.78 | 1.45 |
| Fixed Asset Turnover | 66.26 | 3.49 |
| Payout Ratio | 0% | 24.9% |
| Dividend Yield | 0% | 1.05% |
Interpretation of the Ratios
PDD Holdings Inc.
PDD Holdings shows mostly strong financial ratios, with a favorable net margin of 28.55% and a high return on equity at 35.89%. Its low debt-to-equity ratio (0.03) and strong liquidity ratios indicate solid financial health, though a high price-to-book ratio is a concern. The company does not pay dividends, likely due to its reinvestment strategy and growth focus.
Williams-Sonoma, Inc.
Williams-Sonoma displays good profitability metrics, including a notable return on equity of 52.52% and a favorable return on invested capital of 29.89%. Liquidity is moderate, with a current ratio of 1.44 but a less favorable quick ratio of 0.74. It pays dividends with a 1.05% yield, reflecting a balanced approach to shareholder returns and financial stability.
Which one has the best ratios?
PDD Holdings presents a more favorable overall ratio profile, with 78.57% of its ratios rated favorable compared to 50% for Williams-Sonoma. PDD’s stronger profitability and liquidity metrics contrast with Williams-Sonoma’s mixed liquidity and higher valuation concerns, positioning PDD as having the better ratio standing based on this data.
Strategic Positioning
This section compares the strategic positioning of PDD and WSM, including market position, key segments, and exposure to technological disruption:
PDD
- Market leader in multinational e-commerce with low beta, facing moderate competitive pressure globally.
- Diverse e-commerce portfolio including agricultural produce, apparel, electronics, and online marketing services.
- Operates digital platforms like Pinduoduo and Temu, leveraging e-commerce but vulnerable to tech shifts.
WSM
- Specialty retail leader in home products with higher beta, exposed to intense retail competition.
- Focused on home furnishings and decor across multiple lifestyle brands and retail channels.
- Invests in 3-D imaging and augmented reality for home furnishings, integrating tech in retail experience.
PDD vs WSM Positioning
PDD pursues a diversified e-commerce strategy across many product categories, while WSM concentrates on home specialty retail with multiple lifestyle brands. PDD’s broad market reach contrasts with WSM’s focused brand portfolio and omni-channel distribution.
Which has the best competitive advantage?
Both companies demonstrate a very favorable moat with growing ROIC above WACC, indicating durable competitive advantages. PDD’s higher ROIC growth suggests a stronger value creation compared to WSM’s steady but lower ROIC improvement.
Stock Comparison
The past year revealed contrasting stock performance dynamics between PDD Holdings Inc. and Williams-Sonoma, Inc., with notable divergent price trajectories and trading volumes reflecting differing investor sentiment.
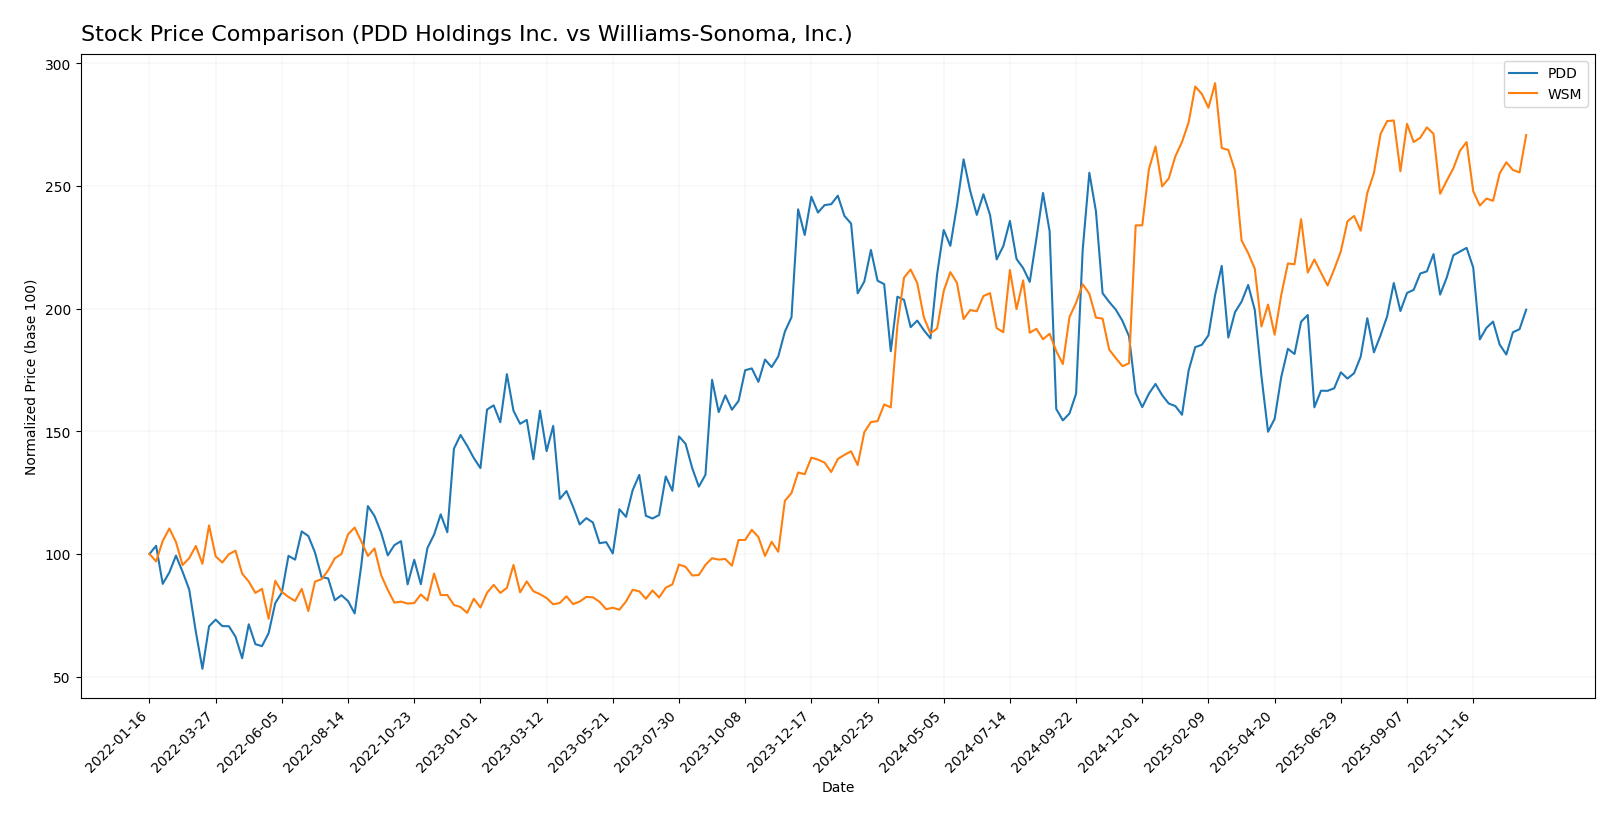
Trend Analysis
PDD Holdings Inc. exhibited a bearish trend over the past 12 months, with a price decline of 10.88%, decelerating as volatility measured by a 15.64 std deviation remained elevated. The highest and lowest prices reached 157.57 and 90.5 respectively.
Williams-Sonoma, Inc. showed a bullish trend over the same period, with a substantial 76.06% price increase despite a deceleration pattern and higher volatility at a 25.4 std deviation. The stock traded between 113.05 and 214.6.
Comparing both, Williams-Sonoma delivered the highest market performance with a strong positive return, whereas PDD faced a declining stock price, indicating substantial divergence in investor outcomes.
Target Prices
The current analyst consensus reflects a positive outlook with notable upside potential for both PDD Holdings Inc. and Williams-Sonoma, Inc.
| Company | Target High | Target Low | Consensus |
|---|---|---|---|
| PDD Holdings Inc. | 170 | 120 | 147.29 |
| Williams-Sonoma, Inc. | 230 | 175 | 205.75 |
Analysts expect PDD Holdings to trade above its current price of 120.55 USD, targeting a consensus around 147.29 USD. Williams-Sonoma’s consensus target of 205.75 USD also suggests upside from its current 199.04 USD price, signaling moderate growth potential.
Analyst Opinions Comparison
This section compares analysts’ ratings and grades for PDD Holdings Inc. and Williams-Sonoma, Inc.:
Rating Comparison
PDD Rating
- Rating: A+ indicating a very favorable overall assessment.
- Discounted Cash Flow Score: 4, favorable, suggesting reasonable valuation.
- ROE Score: 5, very favorable, showing strong profit generation efficiency.
- ROA Score: 5, very favorable, reflecting excellent asset utilization.
- Debt To Equity Score: 5, very favorable, indicating low financial risk.
- Overall Score: 4, favorable, reflecting strong financial health.
WSM Rating
- Rating: B+ with a very favorable status but lower than PDD’s rating.
- Discounted Cash Flow Score: 3, moderate, indicating less favorable valuation.
- ROE Score: 5, very favorable, equally strong profit generation efficiency.
- ROA Score: 5, very favorable, matching PDD in asset utilization efficiency.
- Debt To Equity Score: 2, moderate, suggesting higher financial leverage risk.
- Overall Score: 3, moderate, indicating a less strong financial position.
Which one is the best rated?
Based on the provided ratings and scores, PDD is better rated overall with an A+ rating and higher scores in discounted cash flow, debt-to-equity, and overall financial health compared to WSM’s B+ rating and moderate scores.
Scores Comparison
The comparison of Altman Z-Score and Piotroski Score for PDD Holdings Inc. and Williams-Sonoma, Inc. is as follows:
PDD Scores
- Altman Z-Score: 2.84, in the grey zone indicating moderate bankruptcy risk.
- Piotroski Score: 6, classified as average financial strength.
WSM Scores
- Altman Z-Score: 7.04, in the safe zone indicating low bankruptcy risk.
- Piotroski Score: 7, classified as strong financial strength.
Which company has the best scores?
Williams-Sonoma has higher scores on both Altman Z-Score and Piotroski Score compared to PDD Holdings, indicating stronger financial health and lower bankruptcy risk based on the provided data.
Grades Comparison
Here is a comparison of the latest grades assigned to PDD Holdings Inc. and Williams-Sonoma, Inc.:
PDD Holdings Inc. Grades
The following table summarizes recent grades assigned to PDD Holdings Inc. by reputable grading companies:
| Grading Company | Action | New Grade | Date |
|---|---|---|---|
| Freedom Capital Markets | Maintain | Buy | 2026-01-06 |
| B of A Securities | Maintain | Neutral | 2025-11-19 |
| B of A Securities | Maintain | Neutral | 2025-08-26 |
| Barclays | Maintain | Overweight | 2025-08-26 |
| Benchmark | Maintain | Buy | 2025-08-26 |
| New Street Research | Downgrade | Neutral | 2025-08-26 |
| China Renaissance | Downgrade | Hold | 2025-05-28 |
| Benchmark | Maintain | Buy | 2025-05-28 |
| JP Morgan | Maintain | Neutral | 2025-05-28 |
| Jefferies | Maintain | Buy | 2025-05-27 |
PDD Holdings Inc. shows a predominantly Buy and Neutral rating trend, with occasional downgrades from Buy to Neutral or Hold.
Williams-Sonoma, Inc. Grades
The following table summarizes recent grades assigned to Williams-Sonoma, Inc. by reputable grading companies:
| Grading Company | Action | New Grade | Date |
|---|---|---|---|
| Evercore ISI Group | Maintain | In Line | 2025-12-23 |
| RBC Capital | Maintain | Outperform | 2025-11-21 |
| Telsey Advisory Group | Maintain | Outperform | 2025-11-20 |
| UBS | Maintain | Neutral | 2025-11-20 |
| TD Cowen | Maintain | Buy | 2025-11-20 |
| Citigroup | Maintain | Neutral | 2025-11-20 |
| Telsey Advisory Group | Maintain | Outperform | 2025-11-19 |
| Telsey Advisory Group | Maintain | Outperform | 2025-11-14 |
| Wells Fargo | Maintain | Equal Weight | 2025-11-11 |
| Evercore ISI Group | Maintain | In Line | 2025-10-14 |
Williams-Sonoma, Inc. displays a consistent trend with many Outperform and Neutral ratings, reflecting moderate optimism.
Which company has the best grades?
PDD Holdings Inc. holds a consensus rating of Buy with more grades in the Buy category, while Williams-Sonoma, Inc. has a Hold consensus with numerous Neutral and Outperform ratings. This suggests PDD may be viewed more favorably by analysts, potentially influencing investor confidence and portfolio positioning.
Strengths and Weaknesses
Below is a comparative overview of key strengths and weaknesses for PDD Holdings Inc. (PDD) and Williams-Sonoma, Inc. (WSM) based on recent financial and strategic data.
| Criterion | PDD Holdings Inc. | Williams-Sonoma, Inc. |
|---|---|---|
| Diversification | Strong diversification with balanced revenue from online marketing (198B CNY) and transaction services (196B CNY) | Moderate diversification across multiple retail segments like Pottery Barn, West Elm, and Williams Sonoma, with the largest segment around 3B USD |
| Profitability | High profitability: Net margin 28.55%, ROE 35.89%, ROIC 28.35%, very favorable ratios overall | Solid profitability: Net margin 14.59%, ROE 52.52%, ROIC 29.89%, but higher WACC (10.8%) and mixed ratio evaluations |
| Innovation | Demonstrates growing ROIC and value creation indicating strong competitive advantage and innovation | Also shows growing ROIC and very favorable moat status, but innovation impact less pronounced compared to PDD |
| Global presence | Large presence in China with expanding online marketplaces and marketing platforms | Strong US retail presence with growing e-commerce but less global footprint |
| Market Share | Leading in e-commerce marketing and transaction services in China, rapidly growing | Significant market share in home furnishing retail in the US, diversified across brands |
Key takeaways: PDD exhibits strong and balanced diversification with robust profitability and a durable competitive moat driven by innovation and efficient capital use. Williams-Sonoma maintains a solid market position and profitability but shows slightly less diversification and higher capital costs, indicating more cautious investment consideration.
Risk Analysis
The table below compares key risk metrics for PDD Holdings Inc. and Williams-Sonoma, Inc. based on the most recent fiscal year data.
| Metric | PDD Holdings Inc. | Williams-Sonoma, Inc. |
|---|---|---|
| Market Risk | Very low beta (0.006) indicating minimal market volatility exposure | High beta (1.582) signaling strong sensitivity to market swings |
| Debt level | Very low debt-to-equity (0.03) and debt-to-assets (2.1%) ratios | Moderate debt-to-equity (0.63) but manageable debt-to-assets (25.41%) |
| Regulatory Risk | Moderate, operating internationally with e-commerce regulations in multiple countries | Moderate, subject to US and international retail regulations |
| Operational Risk | Medium, reliant on digital platforms with high asset turnover efficiency | Medium, with diversified retail stores and e-commerce channels |
| Environmental Risk | Moderate, as e-commerce logistics may have carbon footprint concerns | Moderate, retail operations and supply chain sustainability matters |
| Geopolitical Risk | Elevated, given its China-based operations amid global trade tensions | Lower, US-based with some international exposure |
PDD’s minimal market risk and low debt profile reduce financial distress likelihood despite moderate geopolitical risks. Williams-Sonoma faces higher market risk and leverage, but strong operational performance and a safe Altman Z-Score mitigate default risk. Geopolitical and regulatory risks remain significant for PDD, the most impactful uncertainties for investors.
Which Stock to Choose?
PDD Holdings Inc. shows a strong income evolution with a 59% revenue growth over one year and a 562% increase over the 2020-2024 period. Its profitability ratios are very favorable, with a 28.55% net margin and a 35.89% ROE. The company maintains very low debt levels and a strong current ratio of 2.21, supported by a very favorable A+ rating.
Williams-Sonoma, Inc. exhibits moderate income growth, with a slight revenue decline of -0.5% over the past year but a 13.7% increase over the overall period. Profitability ratios are favorable, including a 14.59% net margin and a high 52.52% ROE. Its debt levels are moderate, and liquidity ratios are neutral to unfavorable. The firm holds a solid B+ rating.
For investors, PDD’s very favorable rating and robust income growth suggest potential appeal for growth-oriented profiles, while WSM’s strong profitability and safer financial scores might appear more attractive for those prioritizing stability and quality investing. The choice could depend on individual risk tolerance and investment strategy preferences.
Disclaimer: Investment carries a risk of loss of initial capital. The past performance is not a reliable indicator of future results. Be sure to understand risks before making an investment decision.
Go Further
I encourage you to read the complete analyses of PDD Holdings Inc. and Williams-Sonoma, Inc. to enhance your investment decisions: