Investors seeking growth opportunities often compare companies within the specialty retail sector, where innovation and market reach drive success. PDD Holdings Inc. and Ulta Beauty, Inc. both operate in this dynamic industry, yet they focus on different segments and strategies—PDD emphasizes a vast e-commerce ecosystem, while Ulta leads in beauty retail with a strong physical and digital presence. This article will explore their strengths and challenges to help you identify the more compelling investment option.
Table of contents
Companies Overview
I will begin the comparison between PDD Holdings Inc. and Ulta Beauty, Inc. by providing an overview of these two companies and their main differences.
PDD Holdings Inc. Overview
PDD Holdings Inc. is a multinational commerce group focused on integrating businesses and consumers into the digital economy. It operates platforms like Pinduoduo and Temu, offering a wide range of products from agriculture to electronics and personal care. Founded in 2015 and based in Dublin, Ireland, PDD aims to leverage e-commerce to connect various market segments within the specialty retail industry.
Ulta Beauty, Inc. Overview
Ulta Beauty, Inc. is a U.S.-based specialty retailer focused on beauty products and salon services. Operating over 1,300 stores nationwide, it offers cosmetics, skincare, haircare, and professional salon services, along with private label products. Established in 1990 and headquartered in Bolingbrook, Illinois, Ulta Beauty combines in-store retail with e-commerce through its website and mobile apps to reach a broad consumer base.
Key similarities and differences
Both companies operate in the specialty retail sector but serve distinct markets and geographies. PDD Holdings emphasizes digital commerce platforms with a broad product assortment, while Ulta Beauty concentrates on beauty and personal care with physical stores complemented by online sales. PDD’s model is primarily marketplace-driven, whereas Ulta integrates retail and service-oriented experiences, reflecting different approaches to consumer engagement and revenue generation.
Income Statement Comparison
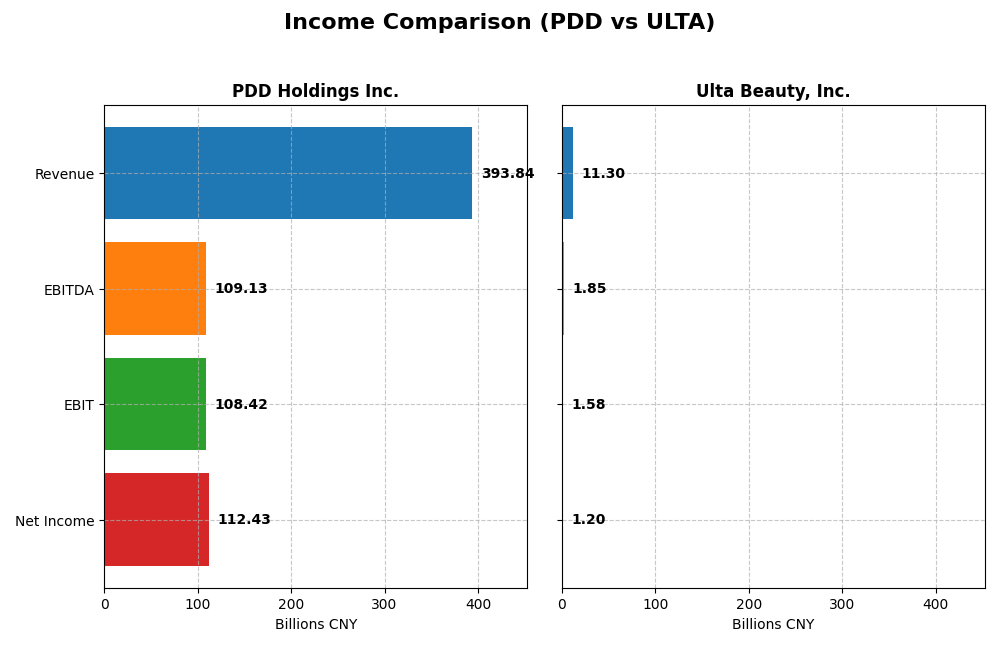
This table compares key income statement metrics for PDD Holdings Inc. and Ulta Beauty, Inc. based on their most recent fiscal year results.
| Metric | PDD Holdings Inc. (2024, CNY) | Ulta Beauty, Inc. (2024, USD) |
|---|---|---|
| Market Cap | 169B | 29.9B |
| Revenue | 394B | 11.3B |
| EBITDA | 109B | 1.85B |
| EBIT | 108B | 1.58B |
| Net Income | 112B | 1.20B |
| EPS | 81.24 | 25.44 |
| Fiscal Year | 2024 | 2024 |
Income Statement Interpretations
PDD Holdings Inc.
From 2020 to 2024, PDD Holdings Inc. demonstrated robust revenue and net income growth, with revenue soaring from 59.5B CNY to 394B CNY and net income expanding from a loss of 7.2B CNY to a profit of 112.4B CNY. Margins improved significantly, with a gross margin reaching 60.92% and net margin at 28.55% in 2024. The latest year showed strong acceleration in growth and margin expansion, reflecting favorable operational leverage.
Ulta Beauty, Inc.
Ulta Beauty’s revenue rose steadily from 6.2B USD in 2020 to 11.3B USD in 2024, accompanied by net income growth from 176M USD to 1.2B USD. Margins remained stable but modest, with a 2024 gross margin of 38.84% and net margin of 10.63%. However, growth slowed in 2024, with a slight revenue increase of 0.79% and declines in EBIT and net margin, indicating some pressure on profitability.
Which one has the stronger fundamentals?
PDD Holdings shows stronger fundamentals with consistently high margin improvement and substantial revenue and net income growth, supported by favorable margin expansion and operational efficiency. Ulta Beauty, while profitable with stable margins, experienced slower recent growth and margin contractions. PDD’s performance highlights more dynamic growth and profitability trends in comparison.
Financial Ratios Comparison
The following table presents key financial ratios for PDD Holdings Inc. and Ulta Beauty, Inc. based on their most recent fiscal year data, facilitating a direct comparison of their financial performance and position.
| Ratios | PDD Holdings Inc. (2024) | Ulta Beauty, Inc. (2024) |
|---|---|---|
| ROE | 35.9% | 48.3% |
| ROIC | 28.4% | 26.6% |
| P/E | 8.7 | 16.2 |
| P/B | 3.13 | 7.82 |
| Current Ratio | 2.21 | 1.70 |
| Quick Ratio | 2.20 | 0.60 |
| D/E | 0.034 | 0.773 |
| Debt-to-Assets | 2.1% | 32.0% |
| Interest Coverage | 0 (not available) | 0 (not available) |
| Asset Turnover | 0.78 | 1.88 |
| Fixed Asset Turnover | 66.3 | 3.96 |
| Payout Ratio | 0% | 0% |
| Dividend Yield | 0% | 0% |
Interpretation of the Ratios
PDD Holdings Inc.
PDD Holdings Inc. shows mostly strong ratios with favorable net margin (28.55%), ROE (35.89%), ROIC (28.35%), and liquidity ratios above 2.0, indicating solid profitability and financial stability. The price-to-book ratio is relatively high at 3.13, which may raise valuation concerns. The company currently does not pay dividends, likely due to a reinvestment strategy or growth focus.
Ulta Beauty, Inc.
Ulta Beauty displays solid profitability with favorable net margin (10.63%), ROE (48.27%), and ROIC (26.61%), though its quick ratio of 0.6 is weak, suggesting potential liquidity risks. The price-to-book ratio is elevated at 7.82, indicating a premium valuation. Like PDD, Ulta does not pay dividends, possibly prioritizing reinvestment and growth over shareholder payouts.
Which one has the best ratios?
PDD Holdings’ ratios are generally stronger and more balanced, with 78.57% favorable metrics and excellent liquidity, compared to Ulta’s 57.14% favorable ratios and weaker quick ratio. However, Ulta’s higher return on equity and asset turnover highlight operational efficiency. Overall, PDD’s financial profile appears more robust based on the available ratios.
Strategic Positioning
This section compares the strategic positioning of PDD Holdings Inc. and Ulta Beauty, Inc., including market position, key segments, and exposure to technological disruption:
PDD Holdings Inc.
- Operates a large multinational e-commerce platform with diverse product categories under competitive pressure.
- Key segments include transaction services and online marketing across various product categories globally.
- Positioned in digital commerce, leveraging technology to integrate businesses and consumers globally.
Ulta Beauty, Inc.
- U.S.-focused beauty retailer with significant physical store presence facing retail competition.
- Key drivers are cosmetics, skincare, salon services, and its private label products in the U.S.
- Primarily retail and salon services with e-commerce presence, less exposed to digital disruption.
PDD Holdings Inc. vs Ulta Beauty, Inc. Positioning
PDD operates a diversified global e-commerce platform spanning multiple product categories, while Ulta focuses on a concentrated U.S. beauty retail and service market. PDD benefits from scale and digital integration; Ulta leverages physical stores and private labels.
Which has the best competitive advantage?
Both companies demonstrate a very favorable moat with growing ROIC above WACC, indicating durable competitive advantages; PDD’s higher market cap and broader platform suggest a stronger scale advantage, while Ulta excels in specialized retail services.
Stock Comparison
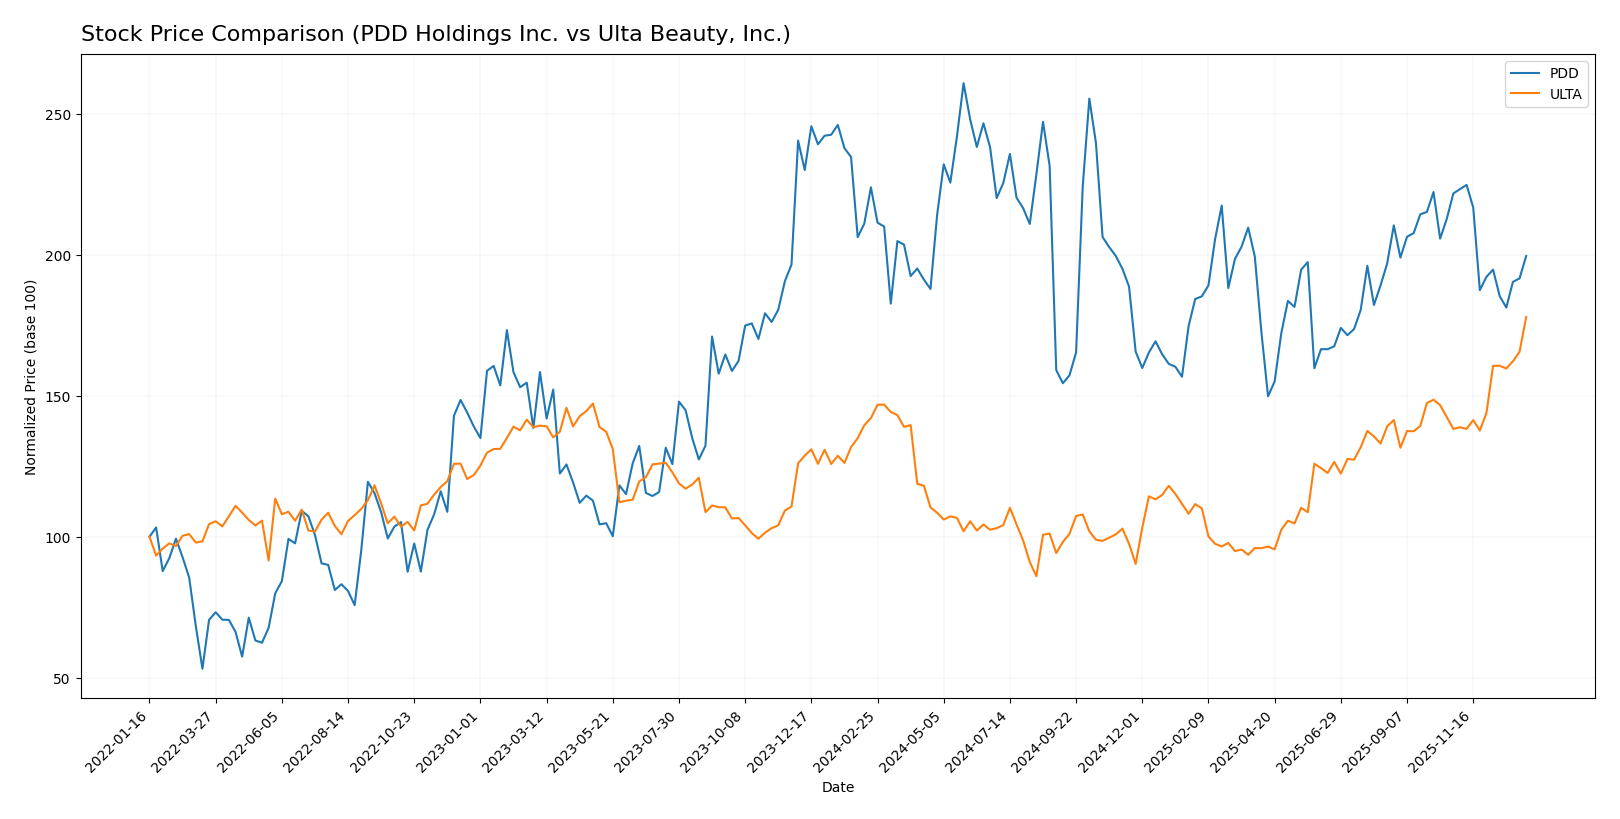
The stock price movements over the past 12 months reflect contrasting performances, with PDD Holdings Inc. experiencing a bearish trend marked by deceleration, while Ulta Beauty, Inc. shows a strong bullish trend with accelerating gains.
Trend Analysis
PDD Holdings Inc. reported a -10.88% price change over the past year, indicating a bearish trend with deceleration. The stock fluctuated between a high of 157.57 and a low of 90.5, exhibiting moderate volatility with a 15.64 std deviation.
Ulta Beauty, Inc. posted a 25.2% price increase during the same period, reflecting a bullish trend with acceleration. Its price ranged from 322.17 to 666.18, displaying significant volatility with a 78.09 std deviation.
Comparing both, Ulta Beauty delivered the highest market performance with a clear bullish trend, whereas PDD Holdings faced a bearish trend and weaker price appreciation.
Target Prices
The current analyst target consensus for PDD Holdings Inc. and Ulta Beauty, Inc. suggests potential upside from current market prices.
| Company | Target High | Target Low | Consensus |
|---|---|---|---|
| PDD Holdings Inc. | 170 | 120 | 147.29 |
| Ulta Beauty, Inc. | 780 | 425 | 648.4 |
Analysts expect PDD’s stock to rise moderately above its current price of 120.55 USD, while Ulta Beauty is projected to maintain strength near its current 666.18 USD price, indicating generally positive sentiment for both stocks.
Analyst Opinions Comparison
This section compares analysts’ ratings and grades for PDD Holdings Inc. and Ulta Beauty, Inc.:
Rating Comparison
PDD Rating
- Rating: A+, considered very favorable for its financial standing.
- Discounted Cash Flow Score: 4, indicating favorable valuation based on cash flows.
- ROE Score: 5, very favorable, showing excellent profit generation from equity.
- ROA Score: 5, very favorable, indicating efficient asset utilization.
- Debt To Equity Score: 5, very favorable, reflecting low financial risk.
- Overall Score: 4, favorable overall financial health assessment.
ULTA Rating
- Rating: A-, also very favorable but slightly lower than PDD’s rating.
- Discounted Cash Flow Score: 4, similarly favorable valuation on future cash flows.
- ROE Score: 5, very favorable, equally strong in generating profits from equity.
- ROA Score: 5, very favorable, matching PDD in asset efficiency.
- Debt To Equity Score: 2, moderate, showing higher financial risk than PDD.
- Overall Score: 4, favorable but with a lower debt-to-equity score compared to PDD.
Which one is the best rated?
PDD holds a superior rating with an A+ compared to Ulta’s A-. Both companies share equally high ROE and ROA scores, but PDD’s significantly better debt-to-equity score gives it an edge in financial stability.
Scores Comparison
Here is a comparison of the key financial scores for PDD Holdings Inc. and Ulta Beauty, Inc.:
PDD Scores
- Altman Z-Score: 2.84, indicating grey zone with moderate bankruptcy risk.
- Piotroski Score: 6, categorized as average financial strength.
ULTA Scores
- Altman Z-Score: 6.64, indicating safe zone with low bankruptcy risk.
- Piotroski Score: 6, categorized as average financial strength.
Which company has the best scores?
ULTA shows a significantly higher Altman Z-Score in the safe zone, suggesting stronger financial stability compared to PDD’s grey zone score. Both companies share an identical average Piotroski Score of 6.
Grades Comparison
The following analysis compares the recent grades and ratings assigned to PDD Holdings Inc. and Ulta Beauty, Inc. by reputable financial grading firms:
PDD Holdings Inc. Grades
This table summarizes the latest grades from recognized grading companies for PDD Holdings Inc.:
| Grading Company | Action | New Grade | Date |
|---|---|---|---|
| Freedom Capital Markets | Maintain | Buy | 2026-01-06 |
| B of A Securities | Maintain | Neutral | 2025-11-19 |
| B of A Securities | Maintain | Neutral | 2025-08-26 |
| Barclays | Maintain | Overweight | 2025-08-26 |
| Benchmark | Maintain | Buy | 2025-08-26 |
| New Street Research | Downgrade | Neutral | 2025-08-26 |
| China Renaissance | Downgrade | Hold | 2025-05-28 |
| Benchmark | Maintain | Buy | 2025-05-28 |
| JP Morgan | Maintain | Neutral | 2025-05-28 |
| Jefferies | Maintain | Buy | 2025-05-27 |
Overall, PDD Holdings demonstrates a predominantly stable grade trend, with most firms maintaining Buy or Neutral ratings, though some downgrades to Hold and Neutral have occurred.
Ulta Beauty, Inc. Grades
The following grades from established financial institutions reflect the current consensus on Ulta Beauty, Inc.:
| Grading Company | Action | New Grade | Date |
|---|---|---|---|
| B of A Securities | Maintain | Neutral | 2026-01-08 |
| UBS | Maintain | Buy | 2026-01-07 |
| Argus Research | Maintain | Buy | 2026-01-02 |
| Oppenheimer | Maintain | Outperform | 2025-12-10 |
| TD Cowen | Upgrade | Buy | 2025-12-08 |
| Morgan Stanley | Maintain | Overweight | 2025-12-08 |
| Guggenheim | Maintain | Neutral | 2025-12-05 |
| UBS | Maintain | Buy | 2025-12-05 |
| Canaccord Genuity | Maintain | Buy | 2025-12-05 |
| Baird | Maintain | Outperform | 2025-12-05 |
Ulta Beauty’s grades show a strong positive trend, with several Buy and Outperform ratings and an upgrade noted, indicating consistent confidence from analysts.
Which company has the best grades?
Ulta Beauty, Inc. holds comparatively stronger analyst ratings than PDD Holdings Inc., with a higher number of Buy and Outperform grades and recent upgrades. This suggests that analysts see relatively better growth or stability potential in Ulta, which could influence investor sentiment and portfolio positioning accordingly.
Strengths and Weaknesses
Below is a comparison of key strengths and weaknesses of PDD Holdings Inc. and Ulta Beauty, Inc. based on their latest financial and market data.
| Criterion | PDD Holdings Inc. | Ulta Beauty, Inc. |
|---|---|---|
| Diversification | Strong focus on online marketing & transaction services, rapidly growing revenue segments in China (CNY 198B and 196B in 2024) | Primarily beauty retail and salon services, with steady growth in gift card breakage revenue (~$24M in 2024) |
| Profitability | High net margin (28.55%), ROIC at 28.35%, very favorable profitability metrics | Solid profitability with 10.63% net margin, ROIC at 26.61%, favorable but lower margin than PDD |
| Innovation | High innovation in e-commerce platform efficiency and marketing services | Innovation focused on omni-channel retail experience and customer loyalty programs |
| Global presence | Strong presence in Chinese and emerging markets e-commerce | Primarily US-focused with growing e-commerce sales but limited international footprint |
| Market Share | Large and growing market share in Chinese online retail | Leading US beauty retailer but facing intense competition |
Key takeaways: PDD Holdings demonstrates robust profitability and rapid growth driven by its diversified online marketing and transaction services in China, supported by a very favorable economic moat. Ulta Beauty shows solid profitability with a strong US market presence and innovation in customer experience, though with more concentrated market exposure and slightly lower margins. Both companies have durable competitive advantages but differ in geographic focus and diversification.
Risk Analysis
Below is a comparison table highlighting key risk factors for PDD Holdings Inc. and Ulta Beauty, Inc. based on the most recent data from 2024.
| Metric | PDD Holdings Inc. | Ulta Beauty, Inc. |
|---|---|---|
| Market Risk | Very low beta (0.006), indicating minimal volatility relative to the market | Moderate beta (0.853), moderate market sensitivity |
| Debt Level | Very low debt-to-equity (0.03), very favorable leverage | Moderate debt-to-equity (0.77), neutral risk |
| Regulatory Risk | Moderate, due to multinational e-commerce operations, including China and U.S. markets | Moderate, focused on U.S. retail regulations and consumer protection |
| Operational Risk | Exposure to supply chain and platform operational challenges given large user base | Risks tied to retail store operations and e-commerce fulfillment |
| Environmental Risk | Low, given e-commerce model, but some impact from logistics and packaging | Moderate, retail operations with possible sustainability pressures |
| Geopolitical Risk | Elevated, due to China-U.S. tensions affecting cross-border trade and regulatory environment | Low, primarily U.S.-focused business |
PDD’s most impactful risks are geopolitical and regulatory, given its cross-border e-commerce presence, though its very low debt and minimal market volatility reduce financial risk. Ulta carries moderate market and operational risks linked to retail dynamics, with higher debt levels adding financial caution. Investors should weigh PDD’s geopolitical exposure against Ulta’s retail sector challenges for balanced risk management.
Which Stock to Choose?
PDD Holdings Inc. exhibits strong income growth with a 59.04% revenue increase in 2024 and a 28.55% net margin, supported by very favorable financial ratios including a 35.89% ROE and low debt levels. The company is rated A+ with a very favorable overall financial standing.
Ulta Beauty, Inc. shows modest revenue growth of 0.79% in 2024 and a 10.63% net margin, with favorable profitability metrics such as a 48.27% ROE but a higher debt ratio. Its rating is A- with a generally favorable financial profile but some neutral to unfavorable ratio indicators.
For investors, PDD might appear more attractive for those seeking high growth and strong value creation evidenced by its very favorable rating and superior income statement performance. Conversely, Ulta could be seen as suitable for investors valuing steady profitability and a safe financial status, given its stable rating and less volatile growth.
Disclaimer: Investment carries a risk of loss of initial capital. The past performance is not a reliable indicator of future results. Be sure to understand risks before making an investment decision.
Go Further
I encourage you to read the complete analyses of PDD Holdings Inc. and Ulta Beauty, Inc. to enhance your investment decisions: